
ABSTRACT
Liver fibrosis is a common response to chronic liver injury, ultimately leading to cirrhosis. The activation of hepatic stellate cells (HSCs) plays a dominant role in liver fibrosis. The regulatory roles of long noncoding RNAs (lncRNAs) in multiple human diseases have been observed. This study was dedicated to investigating the regulatory effects of the lncRNA nuclear paraspeckle assembly transcript 1 (Neat1) on liver fibrosis and HSC activation. Upregulation of Neat1 and cytohesin 3 (Cyth3) and downregulation of miR-148a-3p and miR-22-3p were observed in mouse fibrotic liver tissues. Knockdown of Neat1 or Cyth3 attenuated liver fibrosis and collagen deposition in vivo and the activation of HSCs in vitro. An miR-148a-3p and miR-22-3p inhibitor facilitated HSC activation and collagen fiber expression. Neat1 directly targeted miR-148a-3p and miR-22-3p to modulate Cyth3 expression. Knockdown of Neat1 inhibited Cyth3 expression via the competing endogenous RNA (ceRNA) mechanism of sponging miR-148a-3p and miR-22-3p to regulate liver fibrosis and HSC activation. The ceRNA regulatory network may promote a better understanding of liver fibrogenesis, contribute to an original agreement of liver fibrosis etiopathogenesis and provide insights into the development of a novel domain of lncRNA-directed therapy against liver fibrosis.
Introduction
As one of the most common consequences of chronic hepatic injury, liver fibrosis is characterized by a sophisticated network of molecular mechanisms affecting the accumulation of extracellular matrix (ECM) proteins during liver fibrogenesis, which distorts the normal structure of the liver, ultimately resulting in cirrhosis and hepatic carcinoma [Citation1–3]. Hepatic stellate cells (HSCs) have been identified as the crucial cell type responsible for ECM production during liver fibrogenesis [Citation4]. Activation of HSCs is a momentous event in the progression of liver fibrosis [Citation5]. Further studies of the regulatory molecular mechanism of HSC activation will be conducive to the prevention or treatment of liver fibrosis [Citation6]. However, the pathological mechanism of liver fibrosis is currently only partially understood.
Noncoding RNAs are important constituents of the mammalian transcriptome and include long noncoding RNAs (lncRNAs, >200 nt) and microRNAs (approximately 20–22 nt), which have already been shown to play a pivotal role in fibrotic diseases [Citation7]. Previous investigations have shown that the aberrant expression of lncRNAs is associated with the progression of liver fibrosis by serving as competing endogenous RNAs (ceRNAs), leading to the dysregulation of related gene products [Citation8,Citation9]. Han et al. provided evidence that the lncRNA Tug1 accelerates the progression of liver fibrosis by downregulating miR-29b [Citation10]. As shown in the study by Tu et al., lincRNA-p21 coordinates miR-30 expression levels by serving as a ceRNA in liver fibrosis [Citation11]. The lncRNA Neat1 has been shown by Yu et al. to control the transcription of multiple genes, including some genes that participate in cancer progression [Citation12]. Moreover, a reduction in Neat1 expression inhibits liver fibrosis and HSC activation through the miR-122/KLF6 molecular axis [Citation13]. However, Neat1 may affect diseases by regulating numerous downstream-related genes, and the underlying molecular mechanisms of Neat1 in the progression of liver fibrosis are still not completely clear.
Recent studies have also revealed that various miRNAs are involved in HSC activation and liver fibrosis processes via complex mechanisms, such as miR-21, miR-19b-3p, miR-214, and miR-199a-3p [Citation14–18]. MicroRNA-148a (miR-148a) is abnormally expressed in subjects with liver fibrosis and has already been identified as a suppressor, depending on the particular target genes. For example, Li et al. revealed a negative effect of miR-148a on HSC activation by regulating TGFBR2 and TGFBR1 [Citation19]. Jung et al. verified that miR-148a overexpression in vivo reduces tumor malignancy and liver fibrosis [Citation20]. The role of another miRNA investigated in the present study, microRNA-22 (miR-22), has not been reported in liver fibrosis. Zhou et al. predicted that miR-22-3p might participate in the activation of HSCs [Citation21]. In addition, many studies have reported that miR-22 is involved in a series of liver diseases, including hepatic carcinoma [Citation22,Citation23] and liver cirrhosis [Citation24]. Despite the immense amount of concrete research, studies on the mutual effects of miR-148a or miR-22 on targeting genes involved in liver fibrosis are still worthwhile. Cytohesin 3 (Cyth3), a common target gene of miR-148a and miR-22 predicted by a bioinformatics analysis, is associated with full insulin signaling in mammals [Citation25]. However, the effective mechanism by which Cyth3 functions in liver fibrosis, particularly its reciprocity with noncoding RNAs such as lncRNAs and miRNAs, remains vague.
In the present study, we aimed to reveal the biological functions and the potential molecular mechanism of the lncRNA Neat1 in liver fibrosis by performing in vivo and in vitro experiments. Knockdown of Neat1 obviously inhibited liver fibrosis and HSC activation by sponging miR-148a-3p and miR-22-3p to suppress Cyth3 expression levels. Our basic experimental outcomes provide plenary evidence to reveal a novel lncRNA/miRNA/mRNA signaling pathway and regulatory network of Neat1/miR-148a-3p/miR-22-3p/Cyth3 in liver fibrosis, supplying a crucial insight into the regulatory mechanism of lncRNAs in liver fibrosis progression and new therapeutic options for liver fibrosis.
Materials and methods
Mouse model of liver fibrosis
Eight-wk-old male C57BL/6 J mice were acquired from Hunan SJA Laboratory Animal Co., Ltd. (Changsha, China) and fed in a temperature-controlled room with a stabilized temperature of 25 ± 2°C, a humidity level of 50–70% air and a stable 12 h light/12 h dark cycle at a specific pathogen-free (SPF) level. Liver injury developed in normal mice after an intraperitoneal injection of carbon tetrachloride (CCl4). In simple terms, a set of mice (N = 6) was injected with 10% CCl4 (Aladdin, Shanghai, China) dissolved in olive oil at a dose of 6 μl/g of body weight two times per week for 6 consecutive weeks (twelve times). Another set of mice (N = 6) was deemed the controls and injected with olive oil alone. After 6 wk, the mice were sacrificed by cervical dislocation, and hepatic tissues were collected for analysis. Animal protection measures and all experimental procedures were completely enforced according to the protocol of the animal experiment regulations authorized by The Third Xiangya Hospital.
Microarray analysis
The expression of microRNAs was analyzed using the GSE77271 microarray in the GEO public database based on the data published by Jeongeun et al. [Citation26], in which three pairs of liver tissue samples and liver tissue samples from corn oil-treated and CCl4-treated Mus musculus were collected. Aberrantly expressed miRNAs were screened using R software and the GPL17912 platform with a fold change greater than 2 and P value less than 0.05 as screening conditions. The top 10 differentially expressed miRNAs are shown in a heat map.
RNA extraction and quantitative RT-PCR
Total RNA was extracted from the liver tissues and cells using TRIzol™ (Invitrogen, Carlsbad, CA, USA), and 2.0 μg of total RNA were applied to reverse transcription using the PrimeScript® Stra Strand Synthesis Kit (TaKaRa, Tokyo, Japan). Quantitative PCR was conducted using the QuantiTect® SYBR® Green RT-PCR Kit (QIAGEN, Dusseldorf, Germany). The quantified expression of the lncRNA Neat1, Cyth3 mRNA, miR-22-3p, and miR-148a-3p were standardized to U6 (for miRNAs) or β-actin (for the lncRNA and mRNA) using the 2−ΔΔCt method. The primer sequences are listed in Table S1.
Lentiviral vector for shRNA-Neat1
The Neat1 shRNA or nonsense shRNA was inserted into the BLOCK-iT™ lentiviral RNAi expression system (Invitrogen). The sequences of Neat1 shRNA are listed in Table S1. Briefly, 293 T cells were cotransfected with packaging vectors and lentiviral vectors. The supernatant was collected after 48 h. The viral supernatant was concentrated with Virus Concentration Kits & Titering (System Biosciences, Palo Alto, CA, USA). High titer virus (1 × 10⁹ PFU/mL) was resuspended in PBS. The CCl4-induced mice received Lv-shNeat1 (1 × 10⁹ PFU/mL) or its vector control (1 × 10⁹ PFU/mL) via intravenous injection once every 2 wk for 6 wk (3 times). The experimental mice were casually separated into 4 groups (N = 6 per group): (i) Control group, (ii) CCl4 group, (iii) CCl4+ Lv-shCtrl group, and (iv) CCl4+ Lv-shNeat1 group. After 6 wk, mice were sacrificed, and hepatic tissues were harvested, fixed and embedded for hematoxylin & eosin (HE) and Masson’s trichrome staining.
Hepatic hydroxyproline content
A hydroxyproline content assay was performed to determine the total collagen content. Liver tissue samples (50 mg) were homogenized, processed in HCl and hydrolyzed at 110°C overnight. After centrifugation of the lysate at 12,000 g for 10 min at 4°C, the liquid supernatant was dried in a vacuum concentrator. Then, the samples were incubated with Ehrlich’s reagent, and the hepatic hydroxyproline content was evaluated using a Hydroxyproline Assay Kit (Colorimetric) (Abnova, Taipei, Taiwan) in a microplate reader at 560 nm. Data were standardized to the liver weight.
Histopathological examination
The histopathological examination of mouse liver tissues was implemented using hematoxylin & eosin (HE) staining or Sirius Red staining. The liver tissue samples were placed in a 10% formalin solution, dehydrated in an ethanol gradient, embedded in paraffin, and sliced into 4 μm thick slices. After deparaffinization, the slices were subjected to H&E staining or Sirius Red staining. Then, the samples were observed and photographed under a light microscope (Olympus, Tokyo, Japan).
Masson’s trichrome staining
Preprocessed mouse liver tissues were sliced into 4 µm thick slices. Wiegerts’ Iron Hematoxylin Solution (Sigma-Aldrich, St. Louis, MO, USA) was applied to stain the cell nucleus for 5 min. After 3 washes with sterile deionized water, the slices were dyed using 0.7% Masson-Ponceau-acid fuchsin staining solution (Sigma-Aldrich) for 10 min. The slices were then rinsed with 2% glacial acetic acid and differentiated in phosphomolybdic acid for 4 min. The slices were directly stained with a 2% aniline blue dye solution (Sigma-Aldrich). Following dehydration with an ethanol gradient, clearing with xylene and mounting with neutral resins, images of the stained slices were observed and photographed using a light microscope.
Western blot assay
Total protein was extracted from liver tissues and HSCs using RIPA lysis buffer (Beyotime, Shanghai, China). After a quantitative analysis using the bicinchoninic acid method, 80 μg of total protein were separated using SDS-polyacrylamide gel electrophoresis and transferred onto polyvinylidene difluoride (PVDF) membranes. Membranes were blocked with TBS-T buffer containing 5% nonfat milk for 1 h. Then, the membranes were incubated with primary antibodies, including anti-alpha smooth muscle actin (Cat# ab32575, 1/1000, Abcam, Cambridge, MA, USA), anti-collagen I (Cat# ab34710, 1/1000, Abcam) and anti-beta actin (Cat# ab8227, 1:1000, Abcam) antibodies, at 4°C overnight. After three washes with TBST, the membranes were then hybridized with the horseradish peroxidase (HRP)-linked rabbit anti-mouse IgG H&L secondary antibody (Cat# ab6728, 1:2000, Abcam) at 25°C for 1.5 h. Signals were detected with an ECL system (Life Technologies Corporation, Gaithersburg, MD, USA).
Cell lines and culture
Mouse hepatic stellate cell lines (HSCs) were acquired from BeNa Culture Collection (Beijing, China). The HSCs were cultivated in 90% high glucose Dulbecco’s Modified Eagle’s Medium (DMEM, Thermo Fisher Scientific, Waltham, MA, USA) supplemented with 10% fetal bovine serum (FBS, Sigma-Aldrich, St. Louis, MO, USA) in a humidified atmosphere of 5% CO2 at 37°C. HSCs were exposed to 10 ng/ml transforming growth factor (TGF)-β1 for 24 h. Cells were harvested for further experiments.
Cell transfection
The shRNA sequences targeting Neat1 and Cyth3 were designed by BLOCK-iTTM RNAi Designer (Invitrogen). A lentivirus carrying shRNA-Neat1 (lv-shNeat1), a lentivirus carrying shRNA-Cyth3 (lv-shCyth3), scrambled shRNA, miR-148a-3p inhibitor, miR-22-3p inhibitor and inhibitor control were acquired from GenePharma Technology Co., Ltd. (Shanghai, China). The sequences are listed in Table S1. HSCs were cultivated in 6-well plates at a density of 1 × 10⁶ cells per well for 24 h at 37°C with 5% CO2 until cell confluence reached 80–90%. Lipofectamine™3000 (Life Technologies Corporation, Gaithersburg, MD, USA) was used for transfection according to the manufacturer’s instructions. HSCs stimulated with TGF-β1 were divided into 11 groups: (i) a negative control group, (ii) lv-shCtrl group (transfected with the scrambled shRNA), (iii) lv-shNeat1 group (transfected with the lentivirus carrying shRNA-Neat1), (iv) lv-shCyth3 group (transfected with the lentivirus carrying shRNA-Cyth3), (v) inhibitor NC group (transfected with the blank vector of the inhibitor), (vi) miR-148a-3p inhibitor group (transfected with the miR-148a-3p inhibitor), (vii) miR-22-3p inhibitor group (transfected with the miR-22-3p inhibitor), (viii) Mix1 group (transfected with lv-shNeat1+ the miR-148a-3p inhibitor), (ix) Mix2 group (transfected with lv-shNeat1+ the miR-22-3p inhibitor), (x) Mix3 group (transfected with lv-shCyth3+ the miR-148a-3p inhibitor), and (xi) Mix4 group (transfected with lv-shCyth3+ the miR-22-3p inhibitor). The transfected HSCs were harvested for further experiments.
EdU staining
Cell proliferation was measured using Click-iT® EdU Alexa Fluor 488 Flow Cytometry Assay Kits (Thermo Fisher Scientific) according to previously described methods [Citation27]. HSCs were incubated with a 10 μM 5-ethoxy 2-deoxyuridine (EdU) solution at 37°C for 2 hours. After 48 h, HSCs were digested with trypsin and collected. After washes with PBS containing 1% BSA and fixation in 100 µl of Click-iT® fixative for 15 min, HSCs were permeabilized with 100 μl of 1× Click-iT® saponin and washed with the reagent at 25°C for 15 min. Then, HSCs were incubated in a 500 μl reaction mixture supplemented with Alexa Fluor 488, CuSO4, buffer additive and PBS at 25°C for half an hour. Next, HSCs were washed with 3 ml of 1× Click-iT® saponin-based permeabilization and wash reagent once. Finally, the cells were resuspended in 500 μl of 1× Click-iT® saponin-based permeabilization and wash reagent and analyzed using a Beckmann FC 500 MCL/MPL flow cytometer.
Immunofluorescence staining
HSCs were incubated with 4% paraformaldehyde for 20 min and then incubated with 0.1% Triton X-100 for 5 min. After the pretreatment, the cells were incubated with antibodies against α-SMA (Cat# ab32575, 1/500, Abcam) and collagen I (Cat# ab34710, 1/500, Abcam) overnight at 4°C, followed by an incubation with secondary antibodies conjugated with FITC or Cy5 (Abcam, Cat#ab6717 and ab6564) at 37°C for 60 min. Immunofluorescence staining was observed and photographed under a fluorescence microscope (Leica, Wetzlar, Germany).
Immunohistochemistry (IHC)
Immunohistochemical staining was performed on 4 μm-thick slices of mouse liver tissues. Briefly, the tissues were embedded in paraffin, and then the slices were deparaffinized and rehydrated through a graded series of alcohol solutions and washed with phosphate-buffered saline (PBS) 2 times for 10 min. Next, the sections were incubated with 0.3% H2O2 for 15 min and further incubated overnight with rabbit polyclonal primary antibodies against smooth muscle actin (Cat# ab32575, 1/200) and collagen I (Cat# ab34710, 1/50, Abcam). Then, the sections were incubated with 45 µl of horseradish peroxidase-conjugated goat polyclonal anti-rabbit IgG H&L (HRP) secondary antibody (1:500, ab6721, Abcam) at 37°C for 30 min. Slices were stained with the 3,3ʹ-diaminobenzidine (DAB) working solution for 3 min and then washed with water for 10 min. Slices were counterstained with hematoxylin. After washing the slices with water for 10 min, the sections were finally dehydrated and mounted. The slices were observed under a microscope.
Luciferase assay
The targeting relationships between Neat1 and miR-22-3p or miR-148a-3p were predicted using the ENCORI database (http://starbase.sysu.edu.cn). Then, targeting relationships between Cyth3 and miR-22-3p or miR-148a-3p were predicted using the TargetScan v7.2 database (http://www.targetscan.org/vert_72/).
The pmirGLO, pmirGLO-Neat1-wt or pmirGLO-Neat1-mut, pmirGLO-Cyth3-wt and pmirGLO-Cyth3-mut plasmids were purchased from Youbio (Changsha, China) and then cotransfected with miR-148a-3p or miR-22-3p mimics/inhibitor or mimics/inhibitor control into HSCs using Lipofectamine-mediated gene transfer. HSCs were collected 48 h after gene transfection, and luciferase activity was determined according to the specification of the dual-luciferase reporting assay system (Promega, Madison, WI, USA).
Statistical analysis
The animal experiments were performed at least six independent times. The cellular experiments were performed at least three independent times. The data are presented as the means ± SD. Statistical calculations were performed with GraphPad Prism 6.0 software. Student’s t-test was used to compare the differences between two groups. One-way ANOVA was applied to analyze differences among three or more groups. P-values <0.05 were regarded as statistically significant.
Results
Neat1 was upregulated in mice with liver fibrosis and targeted both miR-148a-3p and miR-22-3p
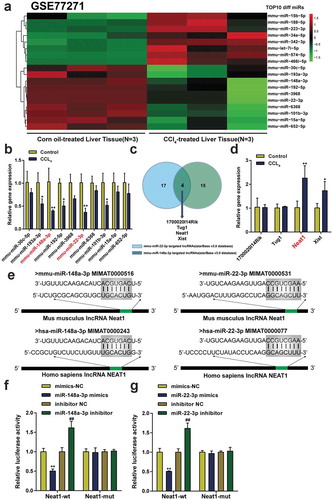
Abnormally expressed microRNAs in the CCl4-induced mouse model of hepatic fibrosis were screened by analyzing the GSE77271 microRNA microarray based on the Agilent-046065 Mouse miRNA V19.0 platform and are presented as a heat map. The top 10 upregulated and downregulated miRNAs are shown in . Then, the outcomes of the qPCR assay showed that miR-148a-3p and miR-22-3p were the most substantially downregulated miRNAs in CCl4-induced mice compared with other miRNAs in the top 10 downregulated miRNAs (P< 0.01, ). Next, a bioinformatics analysis (ENCORI database) was conducted to predict target lncRNAs for miR-148a-3p or miR-22-3p. Four lncRNAs (1700020I14Rik, Tug1, Neat1, and Xist) targeted both miR-148a-3p and miR-22-3p (). Among them, the lncRNA Neat1 showed the most marked increase following CCl4 treatment, and its expression in the CCl4 group exceeded the expression in the control group by two times (P< 0.01, ). The putative binding sequence between Neat1 and miR-22-3p or miR-148a-3p was predicted in both Homo sapiens and Mus musculus using the online database ENCORI (). Both miR-22-3p and miR-148a-3p directly interacted with the corresponding Neat1 3ʹUTR in mice and the Neat1 3ʹUTR in humans. Luciferase activity assays revealed that miR-148a-3p or miR-22-3p mimics decreased the luciferase activity of Neat1-wt, while the miR-148a-3p or miR-22-3p inhibitor significantly increased the luciferase activity of Neat1-wt. However, none of the transfection groups affected the luciferase activity of Neat1-mut ().
Figure 1. Neat1 was upregulated in mice with liver fibrosis and targeted both miR-148a-3p and miR-22-3p. (a) The expression profile of microRNAs in liver tissues from 3 pairs of CCl4-induced mice and normal mice was analyzed. The top 10 differentially expressed miRNAs are depicted in a heatmap, and the threshold value was set to P< 0.05 and a fold change value >2. (b) The expression levels of miR-148a-3p and miR-22-3p were downregulated to the greatest extent among the top 10 differentially expressed miRNAs analyzed using qPCR. *P< 0.05, **P< 0.01 compared to the Control group. (c) Four lncRNAs (1700020I14Rik, Tug1, Neat1, and Xist) were targets of both miR-148a-3p and miR-22-3p according to the ENCORI database. (d) The expression level of Neat1 was upregulated to the greatest extent in CCl4-induced mice. N = 6; *P< 0.05, **P< 0.01 compared to Control group. (e) Prediction of binding sites in the Mus musculus Neat1 3ʹUTR and Homo sapiens Neat1 3ʹUTR for miR-148a-3p or miR-22-3p. (f-g) The targeting relationship between Neat1 and miR-148a-3p (f) or miR-22-3p (g) was verified by performing luciferase reporter assay in HSCs. N = 3; **P< 0.01 compared to mimics NC group; ##P< 0.01 compared to inhibitor NC group
Knockdown of Neat1 suppressed hepatic fibrosis in vivo
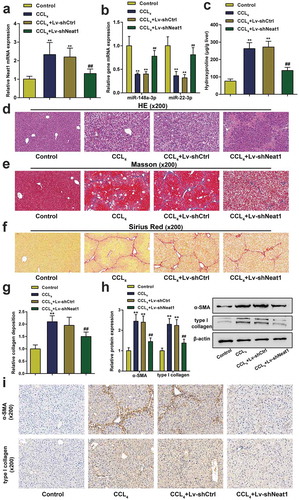
The Neat1 shRNA was transfected into mice to regulate the expression of the lncRNA Neat1 and assess the function of Neat1 in the progression of hepatic fibrosis. The expression level of Neat1 in the lv-shNeat1 group was significantly decreased compared to the shRNA control group (P< 0.01, ). The expression levels of miR-148a-3p or miR-22-3p were decreased in CCl4-induced mice, while knockdown of Neat1 relieved the inhibitory effect of CCl4 on miR-148a-3p or miR-22-3p levels (P< 0.01, ). The hepatic hydroxyproline content in mice transfected with shNeat1 was reduced by approximately 120% compared with mice exposed to CCl4 (P< 0.01, ). The severity of hepatic fibrosis was evaluated by performing H&E staining (), Masson’s trichrome staining () and Sirius Red staining (&G). Moreover, western blot and IHC staining showed that Neat1 knockdown resulted in the inhibition of CCl4-induced expression of the α-SMA and type I collagen proteins (&I). All the aforementioned outcomes suggested that the damage to tissues and accumulation of collagen caused by CCl4 were dramatically relieved by Neat1 downregulation in vivo.
Figure 2. Knockdown of Neat1 inhibited CCl4-induced liver fibrosis in mice. Mice were randomized into four groups: (i) a control group (normal mice), (ii) CCl4 group (CCl4-induced mice), (iii) CCl4+ Lv-shCtrl group, and (iv) CCl4+ Lv-shNeat1 group. (a) The expression of Neat1 in the Lv-shNeat1 group was inhibited. (b) The effect of Neat1 knockdown on miR-148a-3p or miR-22-3p levels. (c) Quantification of the hepatic hydroxyproline content in different experimental groups. (d) Assessment of tissue damage using H&E staining. (e) Evaluation of liver fibrosis using Masson’s trichrome staining. (f-g) The degree of liver fibrosis was evaluated by staining tissue sections with Sirius Red. (h) The levels of the α-SMA and type I collagen proteins were detected using western blotting. (i) The expression levels of α-SMA and type I collagen were detected using IHC staining. N = 6; **P< 0.01, compared with Control group; ##P< 0.01, compared with CCl4 group
Knockdown of Neat1 suppressed the activation of HSCs in vitro
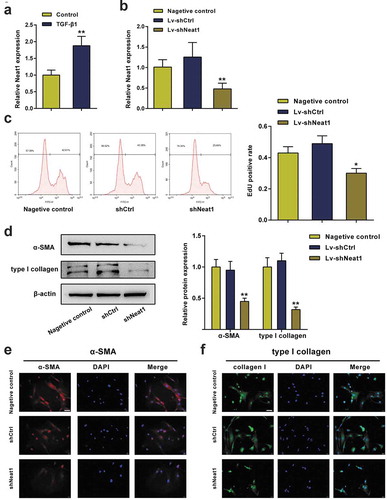
Next, the effect of Neat1 on HSC proliferation and collagen expression was investigated in vitro. Treatment with transforming growth factor (TGF)-β1, a widely used stimulus for HSC activation, significantly upregulated the expression level of Neat1 in HSCs (P< 0.01, ). Then, HSCs stimulated with TGF-β1 were divided into the negative control group (untransfected HSCs), shCtrl group (HSCs transfected with the scrambled shRNA) and shNeat1 group (HSCs transfected with the Neat1 shRNA). qPCR results showed that Neat1 was dramatically downregulated by approximately 50% compared to the negative control group, portending efficient transfection (P< 0.01, ). The EdU assay revealed that knockdown of Neat1 observably restrained HSC activation (P< 0.05, ). As confirmed by the western blot assay () and immunofluorescence staining (), the α-SMA and type I collagen contents were markedly reduced by Neat1 knockdown. These outcomes indicated that Neat1 knockdown inhibited HSC activation and collagen expression.
Figure 3. Knockdown of Neat1 inhibited HSC proliferation and collagen expression. (a) HSCs were treated with transforming growth factor (TGF)-β1 (10.0 ng/mL) for 24 h. The relative expression level of the lncRNA Neat1 was analyzed. (b) HSCs stimulated with TGF-β1 were assigned to the (i) negative control group (untransfected cells), (ii) shCtrl group (cells infected with a lentivirus containing the scrambled shRNA) or (iii) shNeat1 group (cells infected with a lentivirus containing the Neat1 shRNA). The relative Neat1 expression level was reduced in the shNeat1 group. (c) HSC proliferation was measured using the EdU assay. (d) The expression of the α-SMA and type I collagen proteins in HSCs was detected using western blotting. (e-f) Immunofluorescence staining for α-SMA (red) (e) and type I collagen (green) (f) was evaluated using a fluorescence microscope. DAPI-stained nuclei are indicated in blue. Scale bar, 40 μm. N = 3; **P< 0.01, compared with negative control group
The effects of miR-148a-3p and miR-22-3p on HSC activation
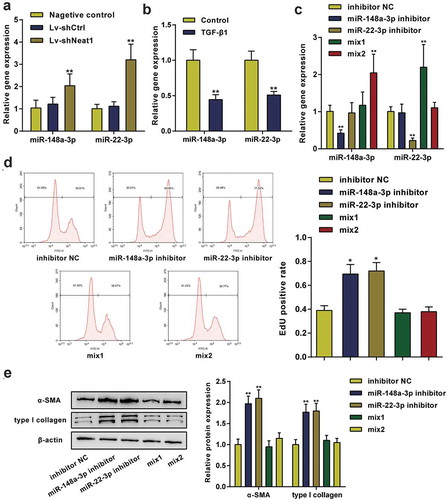
As shown in , Neat1 knockdown noticeably increased miR-148a-3p or miR-22-3p expression levels (P< 0.01). Moreover, miR-148a-3p or miR-22-3p expression levels were dramatically downregulated in HSCs stimulated with TGF-β1 compared to normal HSCs (P< 0.01, ). HSCs were divided into 5 groups to further study the effects of miR-148a-3p and miR-22-3p on HSC proliferation and collagen expression: the inhibitor NC group (cells transfected with the blank vector of the inhibitor), miR-148a-3p inhibitor group (cells transfected with the miR-148a-3p inhibitor), miR-22-3p inhibitor group (cells transfected with the miR-22-3p inhibitor), Mix1 group (cells transfected with shNeat1+ miR-148a-3p inhibitor) and Mix2 group (cells transfected with shNeat1+ miR-22-3p inhibitor), and then the transfection efficiency was detected using qPCR (). EdU data showed that the miR-148a-3p or miR-22-3p inhibitor markedly promoted HSC proliferation compared with the inhibitor NC group, while the stimulatory effect of the inhibitor was eliminated by Neat1 knockdown (P< 0.01, ). Similarly, the miR-148a-3p or miR-22-3p inhibitor markedly increased α-SMA and type I collagen protein expression (P< 0.01, ). These outcomes proved that the inhibition of miR-148a-3p or miR-22-3p promoted HSC proliferation and collagen expression, while the effects of the miR-148a-3p or miR-22-3p inhibitor were eliminated by Neat1 knockdown.
Figure 4. miR-148a-3p and miR-22-3p were involved in HSC activation. (a) Knockdown of Neat1 increased miR-148a-3p and miR-22-3p expression levels in HSCs. N = 3; **P< 0.01, compared with negative control group. (b) The relative expression levels of miR-148a-3p and miR-22-3p in TGF-β1-stimulated and normal HSCs were analyzed. N = 3; **P< 0.01, compared with normal group. (c) HSCs were divided into five groups: (i) inhibitor NC group (cells transfected with the blank vector of the inhibitor), (ii) miR-148a-3p inhibitor group (cells transfected with the miR-148a-3p inhibitor), (iii) miR-22-3p inhibitor group (cells transfected with the miR-22-3p inhibitor), (iv) Mix1 group (cells transfected with Lv-shNeat1+ miR-148a-3p inhibitor) and (v) Mix2 group (cells transfected with Lv-shNeat1+ miR-22-3p inhibitor), and then the transfection efficiency was detected using qPCR. (d) The effect of miR-148a-3p or miR-22-3p on HSC proliferation was determined by performing an EdU assay. (e) The effect of miR-148a-3p or miR-22-3p on α-SMA and type I collagen protein expression in HSCs was detected using western blotting. N = 3; **P< 0.01, compared with inhibitor NC group
Interaction between Cyth3 and miR-148a-3p or miR-22-3p
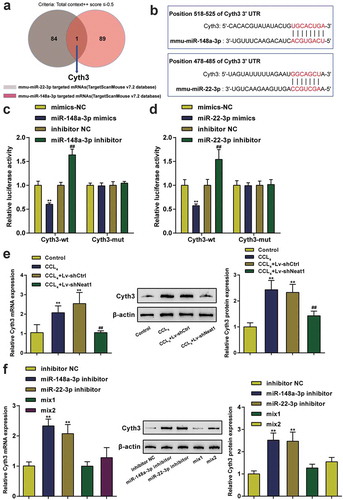
The downstream mRNA targets of miR-148a-3p and miR-22-3p were predicted by the TargetScan v7.2 database, and Cyth3 was selected as the only candidate under the screening condition of a total context++ score ≤ −0.5 (). The binding sites between Cyth3 and miR-22-3p or miR-148a-3p are shown in . Then, the targeting relationships between Cyth3 and miR-148a-3p or miR-22-3p were validated by performing a luciferase activity assay (). The Cyth3 mRNA and protein expression levels were also verified to be high in CCl4-induced mice compared with normal mice and were reduced by Neat1 knockdown (P< 0.01, ). However, the miR-148a-3p or miR-22-3p inhibitor markedly increased Cyth3 mRNA and protein expression levels in HSCs (P< 0.01, ). Therefore, Cyth3 was the direct target of miR-148a-3p or miR-22-3p and regulated by Neat1, miR-148a-3p and miR-22-3p.
Figure 5. Interaction between Cyth3 and miR-148a-3p or miR-22-3p. (a) The downstream mRNA targets of miR-148a-3p and miR-22-3p were predicted by the TargetScan v7.2 database, and Cyth3 was selected as the only candidate under the screening condition of a total context++ score ≤ −0.5. (b) Potential binding sites for miR-148a-3p or miR-22-3p in Cyth3 are shown. (c-d) The targeting relationship between Cyth3 and miR-148a-3p (c) or miR-22-3p (d) was verified by performing a luciferase reporter assay in HSCs. N = 3; **P< 0.01 compared to the mimic NC group; ##P< 0.01 compared to the inhibitor NC group. (e) The expression levels of the Cyth3 mRNA and protein were elevated in CCl4-induced mice but inhibited upon Neat1 knockdown. N = 6; **P< 0.01, compared with Control group; ##P< 0.01, compared with CCl4 group. (f) The miR-148a-3p or miR-22-3p inhibitor significantly increased the expression levels of the Cyth3 mRNA and protein in HSCs. N = 3; **P< 0.01, compared with inhibitor NC group
Knockdown of Cyth3 inhibited the activation of HSCs in vitro and hepatic fibrosis in vivo
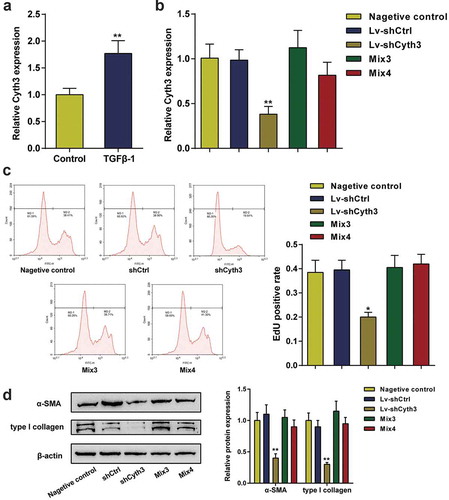
This study first investigated the expression of Cyth3 in activated HSCs to confirm the specific roles of Cyth3 in the activation of HSCs. Cyth3 mRNA expression levels were markedly upregulated in HSCs stimulated with TGF-β1 compared to normal HSCs (P< 0.01, ). HSCs were pretransfected and separated into five groups: a negative control group (untransfected cells), shCtrl group (cells transfected with the scrambled shRNA), shCyth3 group (cells transfected with the Cyth3 shRNA), Mix3 group (cells transfected with shCyth3+ miR-148a-3p inhibitor) and Mix4 group (cells transfected with shCyth3+ miR-22-3p inhibitor), and then the transfection efficiency was detected using qPCR (). Knockdown of Cyth3 observably inhibited HSC proliferation and α-SMA and type I collagen protein expression, whereas the inhibitory effect was offset by the miR-148a-3p or miR-22-3p inhibitor (P< 0.01, ). Therefore, Cyth3 downregulation attenuated the activation of HSCs in vitro.
Figure 6. Cyth3 was involved in HSC activation. (a) The relative expression level of the Cyth3 mRNA in TGF-β1-stimulated and normal HSCs was detected. N = 3; **P< 0.01, compared with the normal group. (b) HSCs were separated into five groups: (i) negative control group (untransfected cells), (i) shCtrl group (cells infected with the lentivirus containing the scrambled shRNA), (ii) shCyth3 group (cells infected with the lentivirus containing the Cyth3 shRNA), (iii) Mix3 group (cells transfected with Lv-shCyth3+ miR-148a-3p inhibitor) and (iv) Mix4 group (cells transfected with Lv-shCyth3+ miR-22-3p inhibitor). The relative Cyth3 expression level was detected in different experimental groups using qPCR. (c) The effect of Cyth3 on HSC proliferation was determined using an EdU assay. (d) The effect of Cyth3 on α-SMA and type I collagen protein expression in HSCs was detected using western blotting. N = 3; **P< 0.01, compared with negative control group
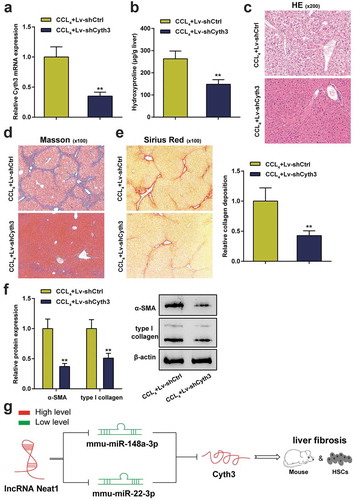
In addition, the effect of Cyth3 knockdown on hepatic fibrosis in vivo was also evaluated in a mouse model of CCl4-induced liver fibrosis. First, the lentivirus carrying the Cyth3 shRNA was injected into CCl4-induced mice to regulate the expression of the Cyth3 mRNA. The expression level of the Cyth3 mRNA in the lv-shCyth3 group was dramatically decreased compared to the control group (P< 0.01, ). The hepatic hydroxyproline content in the lv-shCyth3 group was markedly reduced (P< 0.01, ). The severity of hepatic fibrosis was evaluated by performing H&E staining (), Masson’s trichrome staining () and Sirius Red staining (). Knockdown of Cyth3 notably relieved CCl4-induced liver fibrosis in mice. Additionally, western blot results revealed that knockdown of Cyth3 prominently reduced α-SMA and type I collagen protein expression (P< 0.01, ). Taken together, this evidence revealed an original regulatory pathway through which Neat1 knockdown obstructed Cyth3 expression by regulating miR-148a-3p and miR-22-3p and participated in liver fibrosis and HSC activation ().
Figure 7. Knockdown of Cyth3 attenuated CCl4-induced hepatic fibrosis in mice. Mice were randomized to separate into two groups: (i) the CCl4+ Lv-shCtrl group and (ii) the CCl4+ Lv-shCyth3 group. (a) The expression of the Cyth3 mRNA in different groups was detected using a PCR assay. (b) Quantification of the hepatic hydroxyproline content in different experimental groups. (c) Assessment of tissue damage using H&E staining. (d) Evaluation of liver fibrosis using Masson’s trichrome staining. (e) The degree of liver fibrosis was evaluated by staining tissue sections with Sirius Red. (f) The expression levels of the α-SMA and type I collagen proteins were detected using western blotting. (g) The signaling pathway involved in liver fibrosis was discovered. Schematic representation of a working model by which Neat1 knockdown obstructed Cyth3 expression by regulating miR-148a-3p and miR-22-3p to participate in liver fibrosis and HSC activation N = 6; **P< 0.01, compared with CCl4+ Lv-shCtrl
Discussion
Based on accumulating evidence, many lncRNAs modulate protein-coding gene expression at both the posttranscriptional and transcriptional levels and participate in the crucial development of multiple types of human diseases, including liver fibrosis [Citation28,Citation29]. In the current study, the expression of the lncRNA Neat1 expression was observably upregulated in the CCl4-induced mouse fibrotic liver tissues compared with normal mouse liver tissues, indicating that Neat1 may function as a hepatic fibrosis gene. Next, the biological function of Neat1 in liver fibrosis was investigated in CCl4-induced mice in vivo and HSCs in vitro. Knockdown of Neat1 dramatically relieved the damage to the tissue and accumulation of collagen induced by CCl4 to restrain HSC activation. Similar to our observations, Yu et al. reported that a loss of NEAT1 alleviated liver fibrosis in vivo and in vitro [Citation13]. Kong et al. proposed that NEAT1 aggravates HSC autophagy and activation via the miR-29b/Atg9a regulatory axis [Citation30]. Furthermore, clinical studies indicated that the upregulation of NEAT1 is an independent risk factor associated with the prognosis of patients with hepatocellular carcinoma [Citation31]. All these outcomes revealed that Neat1 is closely related to the progression of liver fibrosis.
According to recent studies, lncRNAs serve as endogenous miRNA sponges and participate in posttranscriptional regulation through mutual effects with miRNAs [Citation32–34]. For example, Yu et al. reported that MALAT1 functions as a ceRNA to modulate Rac1 expression levels by sequestering miR-101b in hepatic fibrosis [Citation35]. In the current study, we specified the targeted reciprocity between Neat1 and miR-148a-3p or miR-22-3p through a bioinformatics prediction and luciferase reporter assay. As shown in previous studies, miR-148a-3p and miR-22-3p have different functions in liver disease [Citation36,Citation37]. Deng et al. emphasized that miR-148a-3p inhibits the proliferation of hepatic carcinoma cells infected with HCV by regulating c-Jun [Citation38]. Zhu et al. argued that miR-148a restrains the activation of HSCs and the EMT program by suppressing USP4 [Citation39]. Chen et al. documented that miR-22 overexpression inhibits hepatic carcinoma cell growth, invasion, and metastasis both in vitro and in vivo [Citation40]. Chen et al. argued that miR-22 inhibits the metastasis of liver cancer and its knockdown signifies shorter survival [Citation41]. Similarly, our study determined that a miR-148a-3p or miR-22-3p inhibitor induced HSC proliferation and collagen expression. Importantly, downregulation of miR-148a-3p or miR-22-3p nearly completely reversed the phenotype induced by Neat1 knockdown. In addition, based on the binding sequence between Neat1 and miR-148a-3p or miR-22-3p, we propose that miR-148a-3p and miR-22-3p are likely direct targets of Neat1. Thus, miR-148a-3p and miR-22-3p are downstream of Neat1 in a signaling cascade that is involved in liver fibrosis progression. Another issue to remember is that many other factors influence the molecular reciprocity of miRNAs and lncRNAs; therefore, we were unable to exclude the possibility that Neat1 targets other miRNAs. Furthermore, chronic liver inflammation has been proven to lead to fibrosis and cirrhosis [Citation42]. Multiple miRNAs are involved in hepatic inflammation and fibrosis [Citation43,Citation44]. Previous studies have provided evidence that miR-148a inhibits inflammation in various diseases, including endometritis [Citation45], disc degeneration [Citation46], and colitis [Citation47]. Moreover, miR-22-3p participates in inflammatory damage in diverse diseases. Hu et al. suggested protective effects of miR-22-3p on retinal pigment epithelial inflammatory damage by targeting the NLRP3 inflammasome [Citation48]. As shown in the study by Fang et al., overexpression of miR-22-3p relieves inflammation in response to spinal cord ischemia/reperfusion injury [Citation49]. However, the functions of miR-148a-3p and miR-22-3p in regulating the inflammatory response in liver fibrosis remain unclear and require further clarification.
Potential target genes were examined to obtain a better understanding of the molecular mechanism by which miR-22-3p and miR-148a-3p modulate the progression of liver fibrosis. Cyth3 was predicted as a direct target gene of both miR-148a-3p and miR-22-3p that bound to its 3ʹ-UTR mRNA by bioinformatics. Although the effect of Cyth3 on liver fibrosis has not been specifically studied, a previous study showed that Cyth3 is upregulated in hepatocellular carcinoma and contributes to tumor growth and vascular invasion [Citation50]. In the current study, functional experiments revealed that knockdown of Cyth3 observably inhibited HSC proliferation and collagen protein deposition. Moreover, knockdown of Cyth3 notably relieved liver fibrosis in mice treated with CCl4. Therefore, we conclude that Neat1 is coexpressed with Cyth3 in liver fibrosis and might positively regulate Cyth3 expression levels by competitively sponging miR-148a-3p and miR-22-3p.
This study still has several limitations. First, other miRNAs might be sponged by Neat1 that are involved in liver fibrosis progression, and other target genes of miR-148a-3p and miR-22-3p might play a role as well. Moreover, since all our experiments were performed in mice and cells, the research outcomes might not be directly extrapolated to humans. In future studies, we may perform tests on other animal models, such as rats or rabbits.
Conclusion
Ongoing studies have identified high expression of Neat1 in mouse liver tissues, and exhaustive authentication contributed to the finding that knockdown of Neat1 inhibited liver fibrosis and HSC activation by sponging miR-148a-3p and miR-22-3p and regulating Cyth3 expression. This evidence is conducive to a better understanding of the development and progression of liver fibrosis, thus supplying novel therapeutic strategies for this fatal disease.
Ethical approval
The guidelines for the care and use of animals were approved by the Medicine Animal Welfare Committee of The Third Xiangya Hospital.
Supplemental Material
Download Zip (84.9 KB)Acknowledgments
None.
Disclosure statement
0The authors confirm that there are no conflicts of interest.
Data availability statement
All data generated or analysed during this study are included in this published article (and its supplementary information files)
Supplementary material
Supplemental data for this article can be accessed here.
Additional information
Funding
References
- Parola M, Pinzani M. Liver fibrosis: pathophysiology, pathogenetic targets and clinical issues. Mol Aspects Med. 2019;65:37–55.
- Roderfeld M. Matrix metalloproteinase functions in hepatic injury and fibrosis. Matrix Biol. 2018;68-69:452–462.
- Zhang K, Han X, Zhang Z, et al. The liver-enriched lnc-LFAR1 promotes liver fibrosis by activating TGFbeta and Notch pathways. Nat Commun. 2017;8:144.
- Page A, Paoli PP, Hill SJ, et al. Alcohol directly stimulates epigenetic modifications in hepatic stellate cells. J Hepatol. 2015;62:388–397.
- Omar R, Yang J, Liu H, et al. Hepatic stellate cells in liver Fibrosis and siRNA-Based therapy. Rev Physiol Biochem Pharmacol. 2016;172:1–37.
- Zhang CY, Yuan WG, He P, et al. Liver fibrosis and hepatic stellate cells: etiology, pathological hallmarks and therapeutic targets. World J Gastroenterol. 2016;22:10512–10522.
- Adams BD, Parsons C, Walker L, et al. Targeting noncoding RNAs in disease. J Clin Invest. 2017;127:761–771.
- Dong BS, Shi MJ, Su SB, et al. Insight into long noncoding competing endogenous RNA networks in hepatic fibrosis: the potential implications for mechanism and therapy. Gene. 2019;687:255–260.
- Peng H, Wan LY, Liang JJ, et al. The roles of lncRNA in hepatic fibrosis. Cell Biosci. 2018;8:63.
- Han X, Hong Y, Zhang K. TUG1 is involved in liver fibrosis and activation of HSCs by regulating miR-29b. Biochem Biophys Res Commun. 2018;503:1394–1400.
- Tu X, Zhang Y, Zheng X, et al. TGF-beta-induced hepatocyte lincRNA-p21 contributes to liver fibrosis in mice. Sci Rep. 2017;7:2957.
- Yu X, Li Z, Zheng H, et al. NEAT1: A novel cancer-related long non-coding RNA. Cell Prolif. 2017;50:e12329.
- Yu F, Jiang Z, Chen B, et al. NEAT1 accelerates the progression of liver fibrosis via regulation of microRNA-122 and Kruppel-like factor 6. J Mol Med (Berl). 2017;95:1191–1202.
- Caviglia JM, Yan J, Jang MK, et al. MicroRNA-21 and Dicer are dispensable for hepatic stellate cell activation and the development of liver fibrosis. Hepatology. 2018;67:2414–2429.
- Lan T, Li C, Yang G, et al. Sphingosine kinase 1 promotes liver fibrosis by preventing miR-19b-3p-mediated inhibition of CCR2. Hepatology. 2018;68:1070–1086.
- Su Q, Kumar V, Sud N, et al. MicroRNAs in the pathogenesis and treatment of progressive liver injury in NAFLD and liver fibrosis. Adv Drug Deliv Rev. 2018;129:54–63.
- Yang X, Ma L, Wei R, et al. Twist1-induced miR-199a-3p promotes liver fibrosis by suppressing caveolin-2 and activating TGF-beta pathway. Signal Transduct Target Ther. 2020;5:75.
- Ma L, Yang X, Wei R, et al. MicroRNA-214 promotes hepatic stellate cell activation and liver fibrosis by suppressing Sufu expression. Cell Death Dis. 2018;9:718.
- Li Z, Wang J, Zeng Q, et al. Long noncoding RNA HOTTIP promotes mouse hepatic stellate cell activation via downregulating miR-148a. Cell Physiol Biochem. 2018;51:2814–2828.
- Jung KH, Zhang J, Zhou C, et al. Differentiation therapy for hepatocellular carcinoma: multifaceted effects of miR-148a on tumor growth and phenotype and liver fibrosis. Hepatology. 2016;63:864–879.
- Zhou Y, Lv X, Qu H, et al. Preliminary screening and functional analysis of circular RNAs associated with hepatic stellate cell activation. Gene. 2018;677:317–323.
- Pant K, Yadav AK, Gupta P, et al. Butyrate induces ROS-mediated apoptosis by modulating miR-22/SIRT-1 pathway in hepatic cancer cells. Redox Biol. 2017;12:340–349.
- Qiao DD, Yang J, Lei XF, et al. Expression of microRNA-122 and microRNA-22 in HBV-related liver cancer and the correlation with clinical features. Eur Rev Med Pharmacol Sci. 2017;21:742–747.
- Ji D, Li B, Shao Q, et al. MiR-22 suppresses BMP7 in the development of cirrhosis. Cell Physiol Biochem. 2015;36:1026–1036.
- Jux B, Gosejacob D, Tolksdorf F, et al. Cytohesin-3 is required for full insulin receptor signaling and controls body weight via lipid excretion. Sci Rep. 2019;9:3442.
- Hyun J, Park J, Wang S, et al. MicroRNA expression profiling in CCl(4)-Induced liver fibrosis of mus musculus. Int J Mol Sci. 2016;17:961.
- Xiao C, Hong H, Yu H, et al. MiR-340 affects gastric cancer cell proliferation, cycle, and apoptosis through regulating SOCS3/JAK-STAT signaling pathway. Immunopharmacol Immunotoxicol. 2018;40:278–283.
- Peschansky VJ, Wahlestedt C. Non-coding RNAs as direct and indirect modulators of epigenetic regulation. Epigenetics. 2014;9:3–12.
- Yang Z, Jiang S, Shang J, et al. LncRNA: shedding light on mechanisms and opportunities in fibrosis and aging. Ageing Res Rev. 2019;52:17–31.
- Kong Y, Huang T, Zhang H, et al. The lncRNA NEAT1/miR-29b/Atg9a axis regulates IGFBPrP1-induced autophagy and activation of mouse hepatic stellate cells. Life Sci. 2019;237:116902.
- Liu Z, Chang Q, Yang F, et al. Long non-coding RNA NEAT1 overexpression is associated with unfavorable prognosis in patients with hepatocellular carcinoma after hepatectomy: A Chinese population-based study. Eur J Surg Oncol. 2017;43:1697–1703.
- Militello G, Weirick T, John D, et al. Screening and validation of lncRNAs and circRNAs as miRNA sponges. Brief Bioinform. 2017;18:780–788.
- Tay Y, Rinn J, Pandolfi PP. The multilayered complexity of ceRNA crosstalk and competition. Nature. 2014;505:344–352.
- Thomson DW, Dinger ME. Endogenous microRNA sponges: evidence and controversy. Nat Rev Genet. 2016;17:272–283.
- Yu F, Lu Z, Cai J, et al. MALAT1 functions as a competing endogenous RNA to mediate Rac1 expression by sequestering miR-101b in liver fibrosis. Cell Cycle. 2015;14:3885–3896.
- Gailhouste L, Gomez-Santos L, Hagiwara K, et al. miR-148a plays a pivotal role in the liver by promoting the hepatospecific phenotype and suppressing the invasiveness of transformed cells. Hepatology. 2013;58:1153–1165.
- Zhang J, Yang Y, Yang T, et al. microRNA-22, downregulated in hepatocellular carcinoma and correlated with prognosis, suppresses cell proliferation and tumourigenicity. Br J Cancer. 2010;103:1215–1220.
- Deng Y, Wang J, Huang M, et al. Inhibition of miR-148a-3p resists hepatocellular carcinoma progress of hepatitis C virus infection through suppressing c-Jun and MAPK pathway. J Cell Mol Med. 2019;23:1415–1426.
- Zhu J, Luo Z, Pan Y, et al. H19/miR-148a/USP4 axis facilitates liver fibrosis by enhancing TGF-beta signaling in both hepatic stellate cells and hepatocytes. J Cell Physiol. 2019;234:9698–9710.
- Chen S, Pu J, Bai J, et al. EZH2 promotes hepatocellular carcinoma progression through modulating miR-22/galectin-9 axis. J Exp Clin Cancer Res. 2018;37:3.
- Chen M, Hu W, Xiong CL, et al. miR-22 targets YWHAZ to inhibit metastasis of hepatocellular carcinoma and its down-regulation predicts a poor survival. Oncotarget. 2016;7:80751–80764.
- Koyama Y, Brenner DA. Liver inflammation and fibrosis. J Clin Invest. 2017;127:55–64.
- Ning ZW, Luo XY, Wang GZ, et al. MicroRNA-21 mediates Angiotensin II-Induced Liver Fibrosis by activating NLRP3 Inflammasome/IL-1beta Axis via Targeting Smad7 and Spry1. Antioxid Redox Signal. 2017;27:1–20.
- Zhang T, Hu J, Wang X, et al. MicroRNA-378 promotes hepatic inflammation and fibrosis via modulation of the NF-kappaB-TNFalpha pathway. J Hepatol. 2019;70:87–96.
- Jiang K, Yang J, Yang C, et al. miR-148a suppresses inflammation in lipopolysaccharide-induced endometritis. J Cell Mol Med. 2020;24:405–417.
- Li G, Tang X, Chen H, et al. miR-148a inhibits pro-inflammatory cytokines released by intervertebral disc cells by regulating the p38/MAPK pathway. Exp Ther Med. 2018;16:2665–2669.
- Zhu Y, Gu L, Li Y, et al. miR-148a inhibits colitis and colitis-associated tumorigenesis in mice. Cell Death Differ. 2017;24:2199–2209.
- Hu Z, Lv X, Chen L, et al. Protective effects of microRNA-22-3p against retinal pigment epithelial inflammatory damage by targeting NLRP3 inflammasome. J Cell Physiol. 2019;234:18849–18857.
- Fang H, Yang M, Pan Q, et al. MicroRNA-22-3p alleviates spinal cord ischemia/reperfusion injury by modulating M2 macrophage polarization via IRF5. J Neurochem. 2020. DOI:10.1111/jnc.15042
- Fu Y, Li J, Feng MX, et al. Cytohesin-3 is upregulated in hepatocellular carcinoma and contributes to tumor growth and vascular invasion. Int J Clin Exp Pathol. 2014;7:2123–2132.