
ABSTRACT
We have earlier shown that p53-FL and its translational isoform ∆40p53 are differentially regulated. In this study, we have investigated the cellular effect of ∆40p53 regulation on downstream gene expression, specifically miRNAs. Interestingly, ∆40p53 showed antagonistic regulation of miR-186-5p as compared to either p53 alone or a combination of both the isoforms. We have elucidated the miR-186-5p mediated effect of ∆40p53 in cell proliferation. Upon expression of ∆40p53, we observed a significant decrease in YY1 levels, an established target of miR-186-5p, which is involved in cell proliferation. Further assays with anti-miR-186 established the interdependence of ∆40p53− miR-186-5p−YY1− cell proliferation. The results unravel a new dimension toward the understanding of ∆40p53 functions, which seems to regulate cellular fate independent of p53FL.
Introduction
P53 is the tumor suppressor gene, known as the guardian of the genome. p53 has different isoforms produced by different mechanisms. One of the isoforms of p53, which is the only translational isoform, is ∆40p53. Previous work from our laboratory has shown the presence of two Internal Ribosome Entry Sites (IRESs) within the p53 mRNA [Citation1]. It was shown that translation initiation from the first IRES generates the full-length p53 protein, whereas initiation at the second IRES generates ∆40p53 [Citation1]. We have also shown that several translation initiation factors like Polypyrimidine tract binding (PTB) protein are critical for the regulation of IRES activity [Citation2]. The pattern of expression of p53 isoforms is tissue-specific and hence, can be specifically regulated. Moreover, p53 isoforms are expressed at a lower level than p53 protein and have distinct subcellular localizations within cells suggesting their distinct biochemical activities [Citation3]. Cotransfection experiments of p53 protein with individual p53 isoforms suggest that wild-type p53 activity is modulated by its isoforms [Citation3]. This can provide a probable justification for the multiple functions played by p53 protein within the cell.
∆40p53 can form homo- and hetero-oligomer complexes with the full-length p53. p53 has a strong affinity toward this isoform [Citation4]. This binding alters the p53 activity, probably by changing the recruitment of the co-activators [Citation5]. ∆40p53 acts as a negative regulatory factor of p53 since coexpression of the two isoforms impairs the ability of p53 to transactivate target genes such as p21 and induce growth suppression [Citation6]. The ratios between the levels of these two isoforms vary during the cell cycle. Recent findings suggest that the role of ∆40p53 is most likely more complicated. It is also known that an increased amount of ∆40p53 prolongs the pluripotency in embryonic stem cells in mice. It controls the switch from pluripotency to differentiated somatic cells by regulating the p53FL activity at critical targets such as Nanog and IGF-receptor [Citation7]. ∆40p53 was observed to induce many apoptosis-related genes that were not induced by p53, such as P53BP2 and TIAL1 [Citation26]. Some studies on mice also showed that ∆40p53 can induce senescence even in absence of p53 full length [Citation9]. All these studies show that ∆40p53 is not just a negative regulator of full-length p53 but has more activity during both normal and stress conditions.
p53 protein is known to be the most frequently altered genes in human cancers [Citation10,Citation11]. p53 is also known to regulate different miRNAs [Citation12–14]. Human cancer cells are often associated with a widespread decrease in miRNAs [Citation15], which shows crosstalk between the p53 tumor suppressor pathway and the miRNA regulation system. The transcription of some pri-miRNAs is regulated by p53 through binding to consensus sites in their promoters. Also, p53 modulates miRNA processing through interaction with the Drosha-p68 complex [Citation16]. miRNAs can target various transcripts, so they are involved in diverse processes such as cellular differentiation, metabolism, and cell proliferation [Citation17]. miR-34 family, composed of miR-34a (from one transcript), miR-34b, and miR-34c (from another transcript) are direct transactivation targets of p53. They are induced following p53 activation, and their induction promotes apoptosis, cell-cycle arrest, and senescence. Some recent reports showed that p53 can also repress the expression of miRNAs. During senescence, p53 was shown to repress miR-106b and cause cell-cycle arrest because the miR-106b family is known to regulate p21/CDKN1A and promote cell-cycle progression [Citation17]. Among several cancer-associated miRNAs, studies on miR-186 are intriguing since it is found to be both upregulated and downregulated in numerous cancers. It is reported to be a tumor suppressor miRNA in the majority of the studies, while in others it is validated as an oncomir. These conflicting functions of miR-186 are mostly explored in lung cancer, colorectal cancer, hepatocellular carcinoma, prostate cancer, gastric cancer, etc. Among the several cancers, it is a well-known tumor suppressor in lung cancer, inhibiting proliferation, migration, and invasion [Citation18]. In patients with nonsmall cell lung cancer (NSCLC), low miR-186 levels in tissues are correlated with poor survival rate, suggesting miR-186 may act as a diagnostic and prognostic marker [Citation19]. It is also found to be downregulated in cancers related to the lymphatic and skeletal system [Citation20]. However, there are also reports of miR-186 where it enhances cell proliferation and migration by targeting tumor suppressor genes. Thus, several reports suggest the conflicting role of miR-186-5p in various cancers [Citation21]. Differential miRNA abundance and variable target levels are major factors contributing to diverse cellular outcomes in cancer; therefore, it is important to identify the regulatory molecules behind such regulation. The contradictory role of miR-186 in cancers is a hindrance toward its promising role in therapeutics, and therefore it is crucial to explore the possible mechanisms behind such findings. Interestingly, one of the reports suggests that wild-type p53 downregulates miR-186 while mutant p53 induces its expression [Citation22]. The role of full-length p53 in controlling the expression of miRNAs is established but the role of ∆40p53 in regulating the miRNAs is not elucidated. Since both the isoforms have some unique transactivation features, which would further result in a differentiated and specific downstream gene expression pattern [Citation13,Citation17], we wanted to understand the role of ∆40p53 in the regulation of miR-186-5p expression and its downstream consequences.
Therefore, in the present study, we have focused on the changes in the expression of miR-186-5p in cells expressing either one of the isoforms or both the isoforms, p53FL and ∆40p53 in lung cancer and colon cancer cell lines with a different experimental approach. Results from our study showed that miR-186-5p is up-regulated only under ∆40p53 expression as compared to p53 and the combination of both the isoforms. This shows ∆40p53 alone could regulate miRNAs differentially independent of p53FL. Gene network analysis as well as literature reports further unraveled YY1 as the potential target for miR-186-5p. A concomitant decrease in the expression of YY1 the target of miR-186 and cell proliferation under ∆40p53 expression elucidates that ∆40p53 can also modulate cellular fate independent of p53FL.
MATERIALS AND METHODS
Plasmids and constructs
pGFP-hp-p53- 5'UTR-cDNA (14A): It expresses both p53FL and ∆40p53. It contains GFP cDNA preceding a hairpin, followed by p53 5'UTR and cDNA in pcDNA3 backbone (a generous gift from Dr. Robin Fahraeus, INSERM, France). pGFP-hp-p53-5'UTR (A135T)-cDNA: It is the first ATG mutant (ATG/TTG), which expresses only ∆40p53. It is a point mutant, in which 135th nucleotide is mutated (A135T), in the context of p53 cDNA, generated in this study. pGFP-hp-p53-5'UTR(A251G/T252 C/G253T)-cDNA: It is second ATG mutant (ATG/GCT), in context of p53cDNA, which expresses only full-length p53 (p53FL) [Citation23]. pmiRGLO-YY1-3'UTR: It contains YY1 3'UTR (region) cloned between PmeI and XbaI downstream of the luciferase gene. pmiRGLO-YY1-3'UTR mutant: It contains YY1 3'UTR with a mutation in the miR-186-5p binding site. 5'CCGGGCCTCTCCTTTGTATATTATTC TCGAGAATAATATACAAAGGAGAGGCTTTTT-3' sequence of shRNA was used to target YY1 3' UTR (procured from shRNA library available in Dr. Gangi Shetty Subba Rao’s Laboratory IISc, Bangalore).
Cell lines and transfections
In the current study, we have used the H1299 null p53 cell line, HCT116+/+, and HCT116 -/- cell line. These cells were maintained in DMEM (Sigma) with 10% Fetal Bovine Serum (GIBCO, Invitrogen). About 70%–80% confluent monolayer of H1299 cells were transfected with various plasmid constructs using lipofectamine (Invitrogen) in OPTIMEM. Four hours later, the medium was replaced with DMEM (with antibiotic) and 10% FBS. After 48 hours, the cells were harvested for RNA isolation and western analysis.
siRNA and anti-miR transfections
HCT116 -/- cells were transfected with 25 nM si p53 RNA (IDT). 5 ' - AACCUCUUGGUGAA
CCUUAGUACCT-3' is the sequence for p53 siRNA, directed against the 3'UTR of p53; therefore, it targets both p53 as well as Δ40p53. A nonspecific siRNA (si nsp) (Dharmacon) was used in the experiments as control. Similarly, anti-miR-186-5p obtained from Ambion (Cat#: 4464084, ID: MH11753) (Applied Biosystems) is also used (40 nM) to partially silence miR-186. A nonspecific anti-miR obtained from Dharmacon (Cat#: IN-001005-01-05) was used in experiments as control. After 48 h, the cells were harvested in passive lysis buffer for reporter gene assays and in RIPA lysis buffer for Western blot analysis.
Site-directed mutagenesis
First ATG mutant (ATG/TTG) and second ATG mutant (ATG/GCT) were generated using Mega Primer-A (5'GGATCTGACTGCGGCTCCTCCAAGGCAGTGACCCGGA3') and MegaPrimer-B (5'GGACAGCATCAAATCATCAGCTGCCTTGGGACGGCAAG3') respectively, using QuikChange Lightning Multi Site-Directed Mutagenesis Kit (Stratagene, USA) as per manufacturer’s protocol. DNA was isolated from transformed E. Coli XL-10-Gold colonies. pmiRGLO-YY1-3'UTR mutant for one of the miR-186 binding site was generated by PCR amplification of template DNA (pmiRGLO-YY1-3'UTR) using two mutagenic primers:
Forward Primer:5'ATGAACTTCGCATCAAAAGACAAAAGAAAATACAACAGTGCTAAAAATGG-3' Reverse Primer: 5'-CCATTTTTAGCACTGTTGTATTTTCTTTTGTCTTTTGATGCGAAGTTCAT-3', followed by DpnI digestion. DNA was isolated from transformed E.coli DH5α colonies and was verified by DNA sequencing.
Western blot analysis
Protein concentrations of the extracts were assayed by Bradford (Bio-Rad) and equal amounts of cell extracts were separated by SDS 12% PAGE and transferred to nitrocellulose membrane (Sigma). Samples were then analyzed by Western blotting using a rabbit-raised anti-p53 polyclonal antibody (CM1, a kind gift from Dr. Robin Fahraeus, INSERM, France and Prof. J.C. Bourdon, of University of Dundee, UK), followed by secondary antibody (horseradish peroxidase-conjugated anti-mouse or anti-rabbit IgG; Sigma). Mouse-monoclonal anti-β-actin antibody (Sigma) was used as a control for equal loading of total cell extracts. YY1 antibody (Santa Cruz Biotechnology, Cat. No. SC-7341 H10) was used to detect YY1 protein. For WB quantitative comparison, the intensity of immunoblots was analyzed using Mutigauge V3.0 software (Fuji Photo Film). For blots, the quantified densities of proteins were normalized against the respective actin band.
RNA isolation and real-time PCR
Total RNA was extracted using TRIzol reagent (Sigma). RNA amount was quantified with Nanospectrophotometer and reverse transcribed (ABI). miRNAs were quantified with the Taqman-based method. The TaqMan microRNA Assay System was used for miRNA detection and quantification. The RT reaction was performed in a final volume of 15 μl containing 1.5 μl of 10X RT buffer, 5 μl of total RNA (10 ng), 3 μl of 5X miRNA-specific RT .primer, 0.15 μl of 100 mM dNTP, 0.19 μl of 20 U/μl RNase inhibitor, and 1 μl of MultiScribe reverse transcriptase (50 U/μl). The reaction condition was 30 min at 16°C, 30 min at 42°C, and 5 min at 85°C. Real-time PCR was then performed in a 20 μl reaction containing 1.33 μl of 1:10 diluted RT product, 10 μl of 10X TaqMan Universal PCR master mix, and 1 μl of the primer and probe mix from the TaqMan MicroRNA Assay Kit. The reaction condition for miRNA (TaqMan) was 95°C for 10 min followed by 40 cycles of 95°C for 15 s and 60°C for 60 s. The expression of the RNU6B gene was used as the endogenous control. The thermocycling conditions for SYBR green include 1 cycle of 95°C for 10 min, and 45 cycles of 95°C for 15 s, and 60°C for 30 s and 72°C for 30 s (Applied Biosystems). 2−ΔΔCt method algorithm was used to analyze the relative changes in expressions, where actin/RNU6B served as an endogenous control. The fold change was calculated using 2−ΔΔCt. ΔCt = Ct (a target gene) −Ct (endogenous control) and ΔΔCt = ΔCt (a target sample) −ΔCt (control sample). Melting curve analysis of every qPCR was conducted after each cycle.
Luciferase assay
Firefly luciferase activity was measured using the Dual-Luciferase Reporter Assay System (Promega, USA Cat#1910) according to the manufacturer’s protocol. The transfected cells were harvested in Passive lysis buffer (PLB) after 48 hours of transfection and luciferase activity was measured.
Wound-healing assay
Wound-healing assay (scratch wound-healing assay) was performed as described previously [Citation24]. Briefly, H1299 cells were co-transfected with p53FL/∆40p53/14A/GFP and anti-miR-186-5p. About 36 h post transfection, these cells were reseeded in 12 well plates to create a confluent monolayer. The cell layers were scratched using a 10 µl pipette tip to produce a wound and further incubated for 24 h at 37⁰C. The rate of closure of the wound (gap reduction) was used to determine the wound-healing rate. Percentage gap reduction was calculated as follows: [(mean wound width-mean remaining width)/mean wound width] *100 (%).
BrdU cell proliferation assay
BrdU cell proliferation assay was performed as described in BrdU cell proliferation protocol mentioned in ab126556-BrdU Cell Proliferation ELISA Kit (colorimetric). Briefly, H1299 co-transfected with p53FL/∆40p53 and anti-miR-186-5p. About 36 h post transfection, these cells were reseeded in 96 well plate. After 12 h of reseeding BrdU solution was added and cells were incubated for 8 h, followed by the protocol as mentioned in the manual. Similar experiment was also performed in HCT116 -/- cells transfected with anti-miR-186-5p and sh YY1.
Statistical analysis
The data were expressed as mean ± SD. Statistical significance was determined using a two-sided Student’s t-test. The criterion for statistical significance was p ≤ 0.05 (*) or p ≤ 0.01 (**) or p ≤ 0.001(***) or p ≤ 0.0001(****).
RESULTS
miR-186 is upregulated under ∆40p53 expression
To further investigate and validate the above observation in mammalian cell culture system we transfected H1299 cells (p53 null) using four different constructs: (i) vector expressing only full-length p53 protein (p53FL), (ii) vector expressing only ∆40p53, (iii) vector that expresses both p53 and ∆40p53 (14A), and (iv) vector control expressing only GFP (C). Interestingly, miR-186-5p showed significant upregulation upon expression of ∆40p53 as compared to p53 alone or the combination of both. (, B). The upregulation of miR-186 by ∆40p53 expression was further validated in HCT116+/+ and HCT116-/- cells (), where HCT116+/+ expresses both p53FL and ∆40p53 and HCT116-/- expresses only ∆40p53 (). The upregulation of miR-186 as observed in HCT116-/- is mediated by ∆40p53 was further confirmed by the partial silencing of ∆40p53 using si p53 (25 nM) in HCT116-/- cells. The partial silencing of ∆40p53 in HCT116-/- cells reduced the levels of miR-186 as compared to the nonspecific si (si nsp) (, F).
Figure 1. Upregulation of miR-186 under ∆40p53 expression
∆40p53 inhibits YY1 expression mediated by miR-186
In this study, we focused on the miR-186 mediated effect of ∆40p53 in cell proliferation. In order to understand the physiological relevance of upregulation of miR-186 under ∆40p53 expression, we validated the change in the levels of one of the targets of miR-186, i.e. YY1, which is known to promote cell proliferation. RNA isolated from H1299 cells expressing p53, ∆40p53, or both (14A) and GFP as vector control was used for determining the change in YY1 mRNA and protein levels (, B). But to confirm if the change in levels of YY1 under ∆40p53 expression is because of upregulation of miR-186, a similar experiment was performed using anti-miR-186 (, D, E). Further to establish a direct link of miR-186 toYY1 3'UTR, a luciferase experiment was performed. H1299 cells were transfected with luciferase construct with YY1 3'UTR wild-type (pmiRGLO-YY1-3'UTR WT) and YY1 3'UTR mutant for the miR-186 binding site (pmiRGLO-YY1-3'UTR Mut) in the background of overexpression of ∆40p53 or the vector control. The overexpression of ∆40p53 increased the levels of miR-186 () which decreased the luciferase activity as compared to the control in case of wild-type 3'UTR. But, in the mutant 3'UTR, the inhibitory effect on the luciferase activity was reduced which resulted in increased luciferase activity (, G, H). This suggests that miR-186 directly binds to YY1 3'UTR thereby regulating its levels.
Figure 2. Overexpression of ∆40p53 downregulates YY1 expression by upregulating miR-186-5p
Experiments performed in HCT116+/+ and HCT116-/- cells also displayed downregulation of YY1 under ∆40p53 endogenous expression (, ). The downregulation of YY1 mRNA and protein levels as observed in HCT116-/- is mediated by ∆40p53 was further confirmed by the partial silencing of ∆40p53 using si p53 (25 nM) in HCT116-/- cells. After partial silencing of ∆40p53 in HCT116-/- cells the mRNA and protein levels of YY1 showed an increase as compared to the nonspecific si (si nsp) (, D). The anti-miR-186 experiments determined that the downregulation of YY1 under ∆40p53 expression is mediated by miR-186 (, F, G, H, I, J, K). The effect of anti-miR-186 on the levels of YY1 mRNA and protein was further established using a nonspecific anti-miR (Nsp anti-miR), which showed no significant change in the YY1 expression (, M, N).
Figure 3. Endogenous ∆40p53 inhibits YY1 expression mediated by miR-186-5p
Figure 3b. continue
∆40p53 inhibits cell proliferation
From different studies, it is known that YY1 promotes proliferation in cells and miR-186 inhibits cell proliferation by downregulating YY1 levels [Citation24,Citation25]. Observations from the experiment using sh YY1 in HCT116-/- cells also showed the role of YY1 in promoting cell proliferation ( B). To investigate if ∆40p53 can regulate cell proliferation, H1299 cells were co-transfected with different constructs expressing p53, ∆40p53, or both (14A) or GFP as vector control and anti-miR-186. p53 is a positive control of the inhibition of cell proliferation because it is known that p53 can inhibit cell growth. The wound-healing assay and BrdU cell proliferation assays were performed to demonstrate the role of miR-186 in cell proliferation and migration. The results show that ∆40p53 can inhibit cell migration and proliferation by upregulating miR-186 which in turn inhibits YY1 expression ( S1 D, E). The results were further strengthened by similar observation in HCT116-/- cells BrdU cell proliferation assay with and without anti-miR-186 (.
Figure 4. ∆40p53 inhibits cell proliferation mediated by miR-186-5p
DISCUSSION
There are different reports which have identified p53 regulated miRNAs and their roles [Citation11]. However, there are no studies on the shorter isoform, ∆40p53 regulated miRNAs. In this study for the first-time function of ∆40p53 in regulating miRNAs expression has been investigated. Several literature reports on miRNAs provided functional significance for the selection of a specific miRNA for this study. Since miR-186 was found to be differentially regulated in different cancers we were interested to study its role in the context of p53 isoforms that orchestrate cellular fate.
A significant change was observed in the levels of miR-186-5p under overexpression of p53FL, ∆40p53, and both the isoforms together. This regulation of miRNAs could be at the level of their transcription or processing stage, but this study focuses on the downstream functions. The observation of upregulation of miR-186-5p by ∆40p53 expression was further strengthened in other cell lines expressing only ∆40p53 endogenously (HCT116-/-) as compared to the cell line expressing both the isoforms (HCT116+/+).
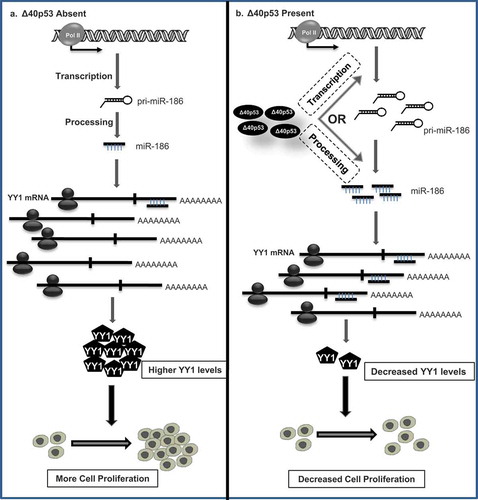
Not much detailed studies have been done to understand the functions of ∆40p53, but some studies have revealed the importance of this isoform by recognizing its role in different cellular functions like apoptosis [Citation26], senescence [Citation8], and differentiation [Citation7]. Knowing that ∆40p53 has different trans activation properties from the previous studies, the current study explores different functions of ∆40p53 mediated through the miRNAs. miR-186 is known to have tumor suppressor properties. It regulates different target genes that have oncogenic properties [Citation18,Citation24,Citation27]. It is involved in functions like regulation of cell cycle, apoptosis, and cell proliferation. Literature from our laboratory has shown that synchronized, ∆40p53 transfected H1299 cells have a higher proportion of S-phase cells 8 h and 24 h post-starvation, suggesting an anti-proliferative effect of ∆40p53 [Citation22]. Taken together the knowledge of previous studies for miR-186, the role of ∆40p53 in regulating cell proliferation mediated by miR-186 is investigated. The downstream significance of miR-186 upregulation under ∆40p53 expression was determined by checking the change in the YY1 mRNA and protein levels by overexpression of ∆40p53 and under endogenous expression of ∆40p53. YY1 is a transcriptional factor that is known to target several genes involved in proliferation and differentiation. YY1 has dual roles to play and its activity varies according to the cellular conditions. YY1 comprises one of the Polycomb group proteins that maintain transcriptional repressor complexes during embryogenesis. It forms a transcription repression complex with HDACs, which when released leads to the activation of cyclin D1 gene promoter which drives G1-phase completion [Citation28]. On the other hand, YY1 negatively regulates p53 in different ways. YY1 inhibits the transcriptional activity of p53 by inhibiting its interaction with its coactivator p300 [Citation29]. In addition to this regulation, YY1 can also act as a negative regulator under genotoxic stress, by enhancing p53 interaction with its negative regulator Mdm2, hence leading to its ubiquitination [Citation29,Citation30]. Downregulation in the YY1 levels under ∆40p53 expression and contrary upregulation in the levels after silencing of miR-186 along with the ∆40p53 expression gave evidence of regulation of YY1 by ∆40p53 mediated via miR-186 regulation. The change in the luciferase activity of the luciferase constructs (with YY1 3'UTR wild type and YY1 3'UTR mutant for the miR-186 binding site) under the overexpression of ∆40p53 also validated the direct interaction of miR-186 to the YY1 3'UTR. There was a decrease in levels of YY1 under p53FL and with the 14A (a combination of p53FL and ∆40p53). Also, the levels of miR-186 get downregulated under p53FL and with 14A as observed in . It appears that this decrease in YY1 level is not mediated through miR-186, as it did not change after anti-miR-186 treatment. As known from the literature YY1 negatively regulates p53, the decrease in steady-state YY1 mRNA and protein levels under p53 overexpression could be a survival strategy by p53. Additionally, the decrease in the YY1 expression by both the isoforms of p53 points toward a novel strategy, where both the isoforms can regulate YY1 expression but through different mechanisms. In a consequence of downregulation of YY1 expression by ∆40p53, there was a reduction in cell proliferation and the reverse was observed with the silencing of miR-186 along with ∆40p53 expression. The experiments with anti-miR-186 established the interdependence of ∆40p53− miR-186-5p−YY1− cell proliferation. This unfolds that ∆40p53 can also regulate cellular fate independent of p53FL ().
Figure 5. Model depicting the regulation of cell proliferation by ∆40p53 through miR-186-5p-YY1 axis
This study not only helps us understand the role of ∆40p53 in regulating cell proliferation but also indicates toward other functions of ∆40p53 independent of p53FL functions. The known literature of the miR-186 tells us about its other functions like regulation of cell cycle at the G1-S stage and senescence by regulating its target genes like CDK6, cyclin D1, and CK2α, respectively. From our laboratory, we have shown that the IRES element 2 in p53 mRNA responsible for ∆40p53 synthesis is more active in the G1-S phase of the cell cycle [Citation1]. With this observation, we could speculate that ∆40p53 can also regulate the cell cycle at the G1-S stage by regulating miR-186. Separate studies tell about the role of ∆40p53 and miR-186 in senescence individually [Citation8,Citation31]. Our observation that ∆40p53 can regulate the expression of miR-186 helps us hypothesize that one of the pathways by which ∆40p53 regulates senescence could be mediated by miR-186.
Taken together, this study unfolds the importance of these isoforms in the differential expression of miRNAs. It also contributes to the novel role of Δ40p53 in regulating miRNAs independent of p53 and hence the cellular fate. It will be interesting to understand the mechanism of the regulation of miRNAs by ∆40p53 alone in future studies.
Author contributions
AK and SD: Conception and design of studies. AK, SKT, and AP for analysis, interpretation, writing the article, and performing the experiments.
Supplemental Material
Download Zip (6.8 MB)Acknowledgments
We are grateful to Prof. J.C. Bourdon, of the University of Dundee, UK and Dr. Robin Fahraeus, INSERM, France, for providing us the anti-p53 antibody; We acknowledge Dr. Gangi Shetty Subba Rao for providing us the sh RNA against YY1. We also thank the present and past SD lab-members for the helpful discussion of the work. This work is supported by a research grant to SD from the Department of Biotechnology (DBT), Govt. of India. SD also acknowledges the J.C. Bose fellowship for research support. This study was also supported by the DBT-IISc partnership program. DST Fund for Improvement of Science and Technology Infrastructure (FIST) level II infrastructure and University Grants Commission Centre of Advanced Studies support is acknowledged. SKT acknowledges CSIR for fellowship.
Disclosure statement
The authors declare no conflict of interest.
Supplementary material
Supplemental data for this article can be accessed here.
Additional information
Funding
References
- Ray PS, Grover R, Das S. Two internal ribosome entry sites mediate the translation of p53 isoforms. EMBO Rep. 2006;7(4):404–410.
- Grover R, Ray PS, Das S. Polypyrimidine tract binding protein regulates IRES-mediated translation of p53 isoforms. Cell Cycle. 2008;7(14):2189–2198.
- Bourdon JC, Fernandes K, Murray-Zmijewski F, et al. p53 isoforms can regulate p53 transcriptional activity. Genes Dev. 2005;19(18):2122–2137.
- Ghosh A, Stewart D, Matlashewski G. Regulation of human p53 activity and cell localization by alternative splicing. Mol Cell Biol. 2004;24(18):7987–7997.
- Candeias MM, Malbert-Colas L, Powell DJ, et al. P53 mRNA controls p53 activity by managing Mdm2 functions. Nat Cell Biol. 2008;10(9):1098–1105.
- Powell DJ, Hrstka R, Candeias M, et al. Stress-dependent changes in the properties of p53 complexes by the alternative translation product p53/47. Cell Cycle. 2008;7(7):950–959.
- Ungewitter E, Scrable H. Delta40p53 controls the switch from pluripotency to differentiation by regulating IGF signaling in ESCs. Genes Dev. 2010;24(21):2408–2419.
- Maier B, Gluba W, Bernier B, et al. Modulation of mammalian life span by the short isoform of p53. Genes Dev. 2004;18(3):306–319.
- Soussi T. p53 alterations in human cancer: more questions than answers. Oncogene. 2007;26(15):2145–2156.
- Hollstein M, Sidransky D, Vogelstein B, et al. p53 mutations in human cancers. Science. 1991;253(5015):49–53.
- Takwi A, Li Y. The p53 pathway encounters the microRNA world. Curr Genomics. 2009;10(3):194–197.
- Suzuki HI, Yamagata K, Sugimoto K, et al. Modulation of microRNA processing by p53. Nature. 2009;460(7254):529–533.
- He L, He X, Lowe SW, et al. microRNAs join the p53 network — another piece in the tumour-suppression puzzle. Nat Rev Cancer. 2007;7(11):819–822.
- Israel A, Sharan R, Ruppin E, et al. Increased MicroRNA activity in human cancers. PLoS ONE. 2009;4(6):e6045.
- Suzuki HI, Miyazono K. Dynamics of microRNA biogenesis: crosstalk between p53 network and microRNA processing pathway. J Mol Med (Berl). 2010;88(11):1085–1094.
- Bailey SG, Sanchez-Elsner T, Stephanou A, et al. Regulating the genome surveillance system: miRNAs and the p53 super family. Apoptosis. 2010;15(5):541–552.
- Huang T, Wang G, Yang L, et al. MiR-186 inhibits proliferation, migration, and invasion of non-small cell lung cancer cells by downregulating Yin Yang 1. Cancer Biomark. 2017;21(1):221–228.
- Cai J, Wu J, Zhang H, et al. miR-186 downregulation correlates with poor survival in lung adenocarcinoma, where it interferes with cell-cycle regulation. Cancer Res. 2013;73(2):756–766.
- Wang Z, Sha HH, Li HJ. Functions and mechanisms of miR-186 in human cancer. Biomed Pharmacother. 2019;119:109428.
- Xiang Y, Tian Q, Guan L, et al. The dual role of miR-186 in cancers: oncomir battling with tumor suppressor miRNA. Front Oncol. 2020;10:233.
- Grespi F, Landre V, Molchadsky A, et al. Differential regulated microRNA by wild type and mutant p53 in induced pluripotent stem cells. Cell Death Dis. 2016;7(12):e2567.
- Khan D, Katoch A, Das A, et al. Reversible induction of translational isoforms of p53 in glucose deprivation. Cell Death Differ. 2015;22:1203–1218.
- Liang -C-C, Park AY, Guan J-L. In vitro scratch assay: a convenient and inexpensive method for analysis of cell migration in vitro. Nat Protocols. 2007;2(2):329–333.
- Thiaville MM, Kim J. Oncogenic Potential of Yin Yang 1 Mediated Through Control of Imprinted Genes. Crit Rev Oncog. 2011;16(3–4):199–209.
- Chen F, Zhou C, Lu Y, et al. [Expression of hsa-miR-186 and its role in human colon carcinoma cells]. Nan Fang Yi Ke Da Xue Xue Bao. 2013;33(5):654–660.
- Ohki R, Kawase T, Ohta T, et al. Dissecting functional roles of p53 N-terminal transactivation domains by microarray expression analysis. Cancer Sci. 2007;98(2):189–200.
- Zhu X, Shen H, Yin X, et al. miR-186 regulation of Twist1 and ovarian cancer sensitivity to cisplatin. Oncogene. 2016;35(3):323–332. .
- Atchison L, Ghias A, Wilkinson F, et al. Transcription factor YY1 functions as a PcG protein in vivo. Embo J. 2003;22(6):1347–1358.
- Sui G, Affar El B, Shi Y, et al. Yin Yang 1 is a negative regulator of p53. Cell. 2004;117(7):859–872.
- Grönroos E, Terentiev AA, Punga T, et al. YY1 inhibits the activation of the p53 tumor suppressor in response to genotoxic stress. Proceedings of the National Academy of Sciences of the United States of America (PNAS). 2004;101:12165–12170.
- Lee Y-H, Kim SY, Bae Y-S. Upregulation of miR-760 and miR-186 is associated with replicative senescence in human lung fibroblast cells. Mol Cells. 2014;37(8):620–627.