
ABSTRACT
Multipolar mitosis was observed in cancer cells under mechanical stress or drug treatment. However, a comprehensive understanding of its basic properties and significance to cancer cell biology is lacking. In the present study, live-cell imaging was employed to investigate the division and nucleation patterns in four different cell lines. Multi-daughter divisions were observed in the three cancer cell lines HepG2, HeLa and A549, but not in the transformed non-cancer cell line RPE1. Multi-daughter mother cells displayed multi-nucleation, enlarged cell area, and prolonged division time. Under acidic pH or treatment with the anti-cancer drug 5-fluorouracil (5-FU) or the phytochemical compound wogonin, multi-daughter mitoses were increased to different extents in all three cancer cell lines, reaching as high as 16% of all mitoses. While less than 0.4% of the bi-daughter mitosis were followed by cell fusion events under the various treatment conditions, 50% or more of the multi-daughter mitoses were followed by fusion events at neutral, acidic or alkaline pH. These findings revealed a “Daughter Number Variation” (DNV) process in the cancer cells, with multi-daughter divisions in Stage 1 and cell fusions leading to the formation of cells containing up to five nuclei in Stage 2. The Stage 2-fusions were inhibited by 5-FU in A549 and HeLa, and by wogonin in A549, HeLa and HepG2. The parallel relationship between DNV frequency and malignancy among the different cell lines suggests that the inclusion of anti-fusion agents exemplified by wogonin and 5-FU could be beneficial in combinatory cancer chemotherapies.
Introduction
Mitosis is fundamental to the maintenance of genomic stability by establishing bipolar spindles and executing precise segregation of chromosomes. Aberrant mitosis contributes to cancers through the accumulation of genetic abnormalities that favor cancer development [Citation1–3], and increases genotypic and phenotypic diversity in the tumor population [Citation4]. Multi-daughter cell divisions have been detected in malignant tumors since the 1890s [Citation5], and more than 3% of the mitotic cells in the SGB4 glioblastoma cell line underwent multipolar mitosis to yield viable daughter cells that completed several rounds of mitosis [Citation6]. Inductions of mitotic anomalies including multipolar division, asymmetric division, and cell fusion were observed in HeLa cells under mechanical compression [Citation7,Citation8]. Similarly, exposure to asbestos caused multipolar mitosis and aneuploidy formation in various types of cultured mammalian cells [Citation9–11], and both heat stress and ionizing radiation brought about mitotic catastrophes in U2OS osteosarcoma cells with multiple centrosomes [Citation12,Citation13]. As well, short exposure to paclitaxel treatment resulted in the generation of multipolar spindle [Citation14,Citation15], and carboplatin and dinaciclib induced multipolar spindle formation and aneuploidy [Citation16,Citation17].
The extracellular tumor microenvironment is a critical regulator of immune escape, progression, and metastasis of cancer. Due to changing conditions in the microenvironment and therapeutic intervention, tumor cells are under constant selection pressure that leads to phenotypic and genotypic heterogeneity [Citation18], often accompanied by the emergence of drug resistance [Citation19]. The present study has been focused on the possible chemical induction of daughter number variations (DNVs) with resultant generation of multinucleate cells. The effects of three chemical treatments on DNVs were investigated, including treatment with low pH, which promoted invasiveness in solid tumors [Citation20]; the anticancer drug 5-FU, which could induce drug resistance [Citation21,Citation22]; and the anticancer herbal compound wogonin from Scutellaria baicalensis [Citation23,Citation24]. By means of time-lapse microscopy, exposure of cells to acidic pH, or treatment with wogonin or 5-FU was found to induce extensive increases in multi-daughter formation in the malignant HeLa and HepG2 cell lines, whereas the less malignant A549 cell line showed a small induction of multi-daughters only by acidic pH. The transformed but non-cancer RPE1 cell line did not exhibit significant multi-daughter production. Furthermore, multi-daughter mitosis in cancer cells was found to be followed often by fusions between some daughter cells to yield a variety of ploidy patterns that included tri-nucleate to penta-nucleate cells. These findings identified “daughter number variation” (DNV) as a two-stage, largely if not exclusively malignancy-dependent phenotype of cancer cells that would furnish the cells with a regular source of multinucleate cells, which have been implicated in the aneuploidy- and polyploidy-mediated genome instability and aggressiveness of cancers.
Materials and methods
Cell cultures
The human HeLa cervical adenocarcinoma, HepG2 hepatocellular carcinoma, and A549 lung adenocarcinoma cell lines, and hTERT-immortalized RPE1 retinal epithelial cells were obtained from the American Type Culture Collection (ATCC, Manassas, VA, USA) and cultivated in a growth medium consisting of Dulbecco’s Modified Eagle Medium (DMEM) supplemented with 10% fetal bovine serum (Gemini Bio-Products, Sacramento, CA) under a humidified atmosphere of 5% CO2 at 37 °C. Neutral growth medium was buffered by 15 mM 3-(N-morpholino)propanesulfonic acid.HCl (MOPS) at pH 7.4, acidic treatment medium by 15 mM 2-(N-morpholino)ethanesulfonic acid.HCl (MES) at pH 6.4, and alkaline treatment medium by 15 mM tris(hydroxymethyl)aminomethane.HCl (Tris) at pH 8.4. The drug treatment medium consisted of a neutral growth medium containing 50 µM wogonin or 20 µM 5-FU, and all the pH and drug treatments were performed for 24 hours except where it was indicated otherwise. Wogonin and 5-FU were purchased from ChemiFaces (Wuhan, China) and Sigma‐Aldrich (St. Louis, USA), and stock solutions of wogonin and 5-FU were made up of dimethyl sulfoxide at 250 mM and 100 mM, both respectively.
Analysis of cell morphology and nucleate patterns using live-cell imaging
For various treatments of cells, cells were seeded on 6-well plates at a density of 1 × 10⁵ per well, and their morphology and nucleate patterns were monitored by time-lapse phase contrast photographs at different positions of the well taken at 15-minute intervals for 24 hours at 100X magnification using the Nikon ECLIPSE Ti Live Cell Imaging Observatory. To address multi-nucleation, fluorescence microscope, and live-cell imaging were employed, the cells were seeded on 12-well plates at 1 × 10³ per well in neutral growth medium and stained with Hoechst 33,342 (20 mM, Thermofisher) for 30 minutes at 37° C. Afterward, the neutral growth medium was replaced by various treatment media, and the cells were monitored using the Nikon ECLIPSE Ti microscope. Images were recorded at 15-minute intervals and analyzed using Image J software. In some instances, the monitored period was also extended to five days.
Measurement of multi-daughters, cell areas, and division durations
Cells under various treatments were manually traced using the ImageJ software [Citation25]. Cell area and cell division time were estimated by monitoring the cell area during mitotic cell rounding, and by the time elapsed between entry into mitosis and completion of cytokinesis, respectively. Fluorescence staining and time-lapse microscopy were employed to differentiate between the productions of tri-, tetra- and penta-daughter divisions.
Cell cytotoxicity assay
HepG2, HeLa and A549 cells were grown to a monolayer density of 1 × 10³ per well in a neutral growth medium overnight. There upon the cells were changed to various treatment media at neutral, acidic and alkaline pH, neutral medium containing 50 µM wogonin and neutral medium containing 20 µM 5-FU, for 24 hours at 37°C in humidified 5% CO2 atmosphere. Following the treatment, floating cells were removed, and the attached cells were stained with crystal violet (8% in methanol); the dye absorbed by the live cells was extracted with sodium citrate (0.1 M) in 50% ethanol [Citation26], and quantitated by absorbance at 600 nm.
Statistical analysis
GraphPad Prism 5.0 software was employed for all statistical analysis, and the results were presented as the mean. Significance was determined using either the Student t-test (two-tailed, unpaired/unequal variances) or binomial distribution as indicated in the Figure legends. Values of p < 0.05 were regarded as statistically significant.
Results
DNV-associated multi-daughter divisions and daughter fusions
For the HepG2, HeLa, A549 and RPE1 cells, cell divisions were monitored at neutral pH using time-lapse phase contrast microscopy, with confirmation from fluorescence microscopy, for 24 hours in order to determine the number of daughter cells (bi-daughter, tri-daughter, tetra-daughter, and penta-daughter divisions) produced from a mother cell (, Supplementary Figure 1 and Videos 1–2). Under various treatment conditions, each cell division in HepG2 yielded up to five daughter cells, HeLa yielded up to four daughter cells, and A549 yielded up to three daughter cells, whereas RPE1 did not engage in multi-daughter production and gave rise only to two daughter cells () and Videos 3–12). These multi-daughters often followed by fusions between some of the primary daughter cells to form the final daughters with P1-P8 nucleate patterns. Thus, the time-lapse records revealed a two-stage process that can be called as Daughter Number Variation (DNV) where multi-daughter cell divisions of mono-nucleate, bi-nucleate, tri-nucleate and tetra-nucleate mother cells at Stage 1 produced single mono-nucleate cells, and clusters consisting of one bi-nucleate plus two mono-nucleate cells. Stage 1 was often followed by fusions at Stage 2 between some of the daughter cells from Stage 1 to form the final DNV P1-P8 nucleate patterns (). Among these patterns, P1 and P2 consisted of the unfused mono-nucleate cells and clusters consisting of one bi-nucleate plus two mono-nucleate cells, respectively; while each of the P3-P8 patterns contained at least one cell that was generated from cell fusions between the Stage 1 cells. Like, in P3 and P5, two of the cells were multinucleate with two nuclei, in P4 and P6 with three nuclei, in P7 with four nuclei and in P8 with five nuclei sharing the same cytoplasm (where fusion is indicated by a nucleus encircled by a white dashed line). Therefore, on account of the cell fusions at Stage 2, DNVs constituted a regular source of multinucleate cancer cells that contained up to five nuclei, or plausibly even more than five nuclei in some cancers. The production of cells with different numbers of nuclei is illustrated by Videos 13–29 and the snapshots in Supplementary Figure 2–18. Notably, intercellular threads were visible at times between two daughter cells formed in Stage 1, appearing to pull two different cells toward each other, e.g. in Video 17. Thus, these threads, arising between two daughter cells from Stage 1, might expedite a fusion event between them in Stage 2, which suggests that the fusion events in Stage 2 might be expedited by incomplete scission between these cells at the end of Stage 1.
Figure 1. Mitosis of HeLa cells under neutral pH condition. (a) HeLa cell nuclei were stained with Hoechst 33,342 dye and recorded by time-lapse imaging. (a) Mono-nucleate mother cell, (b) undergoing metaphase, (c) reaching anaphase, and (d) dividing into two daughters at 60 minutes. (e) Another mono-nucleate mother cell, (f) a triangular metaphase plate, (g) reaching anaphase, and (h) dividing into three daughters at 150 minutes. (b) Mother cells shown by phase contrast (left panels) or staining with Hoechst 33,342 (right panels). Colored arrows indicate mono-nucleate (yellow), bi-nucleate (white), tri-nucleate (red) and tetra-nucleate (green) cells. See Supplementary Figure S1 for snapshots of HeLa, HepG2 and A549 cells under different treatments. Also see videos 1 and 2 corresponding to a-d and e-h, respectively, in Part A
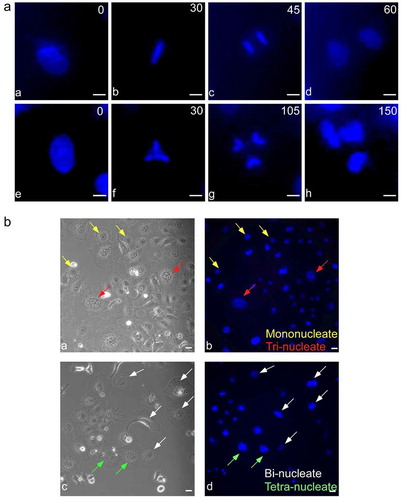
Figure 2. Multi-daughter production in different cell lines under varied treatment conditions. (a) HepG2, HeLa, A549 and RPE1 cells showing bi-daughter, tri-daughter, tetra-daughter and penta-daughter cell divisions. (b) Semi-quantitative representation of multi-daughter production under different treatment conditions. Bi-daughter divisions were commonly observed in all the cell lines; tri-daughter divisions were observed at neutral, acidic and alkaline pHs, and under wogonin and 5-FU treatments in HepG2, HeLa and A549 cells; tetra-daughter ones in HepG2 and HeLa cells; and penta-daughter ones only in HepG2 cells at neutral and acidic pHs and under wogonin treatment. Magnification ×100, with 10 µm scale bars. See Videos 3–12 for the ten panels in Part A
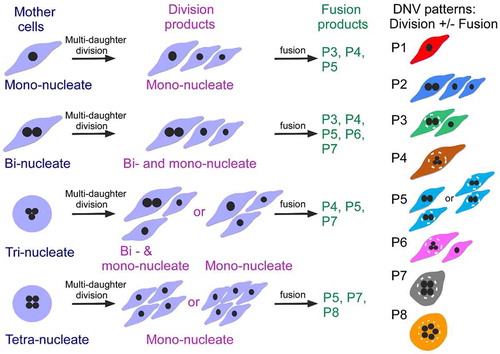
Figure 3. Daughter number variations (DNVs) in cancer cells. Schematic representation of two-staged DNV process showing Stage 1 (division) followed by Stage 2 (fusion). The mono-nucleate, bi-nucleate, tri-nucleate or tetra-nucleate mother cells (blue labels) give rise to different division products in Stage 1 (red labels), consisting of mono-nucleate daughters, or two mono-nucleates plus one bi-nucleate daughters. Some of these Stage 1 cell products undergo cellular fusions to form different nucleate pattern P3-P8 (green labels). The final nucleate patterns of DNV daughters therefore include the P1-P8 patterns. The P1 pattern consists of mono-nucleate daughters, and the P2 pattern consists of two mono-nucleate and one bi-nucleate daughters. The bi-nucleate cell in P3 stems from the fusion of two mono-nucleate Stage 1 DNV daughters. In P5, either one of the two bi-nucleate cells in the pattern is mitosis-born while the other arises from the fusion of two Stage 1 mono-nucleate DNV daughters, or both the bi-nucleate cells stem from the fusion of two Stage 1 mono-nucleate DNV daughters. The tri-nucleate cell in P4 arises by fusion of three Stage 1 mono-nucleate cells; P6 consists of one tri-nucleate cell derived from cell fusion and one mono-nucleate cell; and the tetra-nucleate cell in P7as well as the penta-nucleate cell in P8 arise mainly from the fusion of Stage 1 mono-nucleate DNV daughters. In all instances, fusion is indicated by enclosure within a dashed circle (white). See Supplementary –18 and Videos 13–29 for illustration of the formation of P1-P8 nucleate patterns
Cell fusions among multi-daughters and bi-daughters
Stage 2 cell fusions were plentiful where two sister cells (Supplementary Figure 4, 6, 8, 10 and Videos 15, 17, 19, 21) or three sister cells (Supplementary Figure 5, 9, 12, 14, 16, 17, 18 and Videos 16, 20, 25, 27, 28, 29) from the same mother cell fused with one another. Moreover, in some instances, non-sister cells derived from two different mother cells were also found to enter into fusion (Supplementary Figures 19–21 and Videos 30–32). The HepG2 and HeLa but not A549 cells also gave rise to fusions between the daughter cells from bi-daughter mitoses amounting to less than 0.4% of all bi-daughter mitoses; and 5-FU completely inhibited all such fusions (Supplementary Figure 22). In contrast to the 0.4% or less fusion occurrence among the daughter cells of bi-daughter mitoses, over 50% of the multi-daughter mitoses (yielding three or more daughters each) gave rise to some fusion event in DNV Stage 2 in HepG2, HeLa or A549 (Supplementary Table S1, and Supplementary Figure 23). Therefore, the daughter cells from the multi-daughter mitoses were more prone to cell fusion than the daughter cells from bi-daughter mitoses, possibly due to a higher rate of incomplete cytokinesis in the multi-daughter mitoses.
It was proposed earlier that the cell fusions occurring between glioblastoma daughter cells were the consequence of cytokinesis failure [Citation6]. This mechanism likely applied also to the sister-cell fusions in Stage 2 DNVs in the present study. However, the cell fusions between the non-sister daughter cells derived from two different mother cells would probably require some mechanism other than cytokinesis failure.
DNVs under different treatment conditions
When the DNVs in the HepG2, HeLa, A549 and RPE1 cells were monitored under various treatment conditions for 24 hours or five days, the changes in DNVs recorded in response to the treatments varied with both the cell line and the nature of the treatment. Relative to the control DNV frequencies observed during growth at neutral pH, treatment with acidic pH, wogonin and 5-FU induced significant increases in DNVs in HepG2 and HeLa cells in 24 hours, with a smaller induction in A549 by only acidic pH, and no DNV was shown by RPE1; only HepG2 gave rise to penta-daughters, and only HepG2 and HeLa but not A549 gave rise to tetra-daughters () and ). After treatment for five days, the DNVs induced in HepG2 and HeLa by acidic pH or wogonin exceeded 10% of total mitotic divisions. HeLa also gave rise to a couple of penta-daughters, and A549 also gave rise to a few tetra-daughters ().
Table 1. Counts of multi-daughter (> tri-daughter) divisions in HeLa, HepG2, A549 and RPE1 cells under different treatment conditions (percentages in parentheses) after 24 hours
Table 2. Counts of multi-daughter (> tri-daughter) divisions in HeLa, HepG2 and A549 cells under different treatment conditions (percentages in parentheses) after five days
The increases in DNV occurrences induced by acidic pH, wogonin or 5-FU that reached statistical significance after treatment for 24 hours included the following (): induction by acidic pH reached a p-value of 0.022 in A549, induction by 5-FU reached a p-value of 0.0003 in HepG2, and inductions by acidic pH in HepG2 and HeLa, inductions by wogonin in HepG2 and HeLa, and induction by 5-FU in HeLa all reached a p-value of less than 0.0001. As well, induction by wogonin was significantly greater in HepG2 compared to HeLa, and inductions by acidic pH, alkaline pH, wogonin and 5-FU were all significantly greater in both HepG2 and HeLa compared to A549.
Table 3. Statistical p-values pertaining to inequalities of percentages of DNVs among total mitotic divisions in different cell lines after different treatments
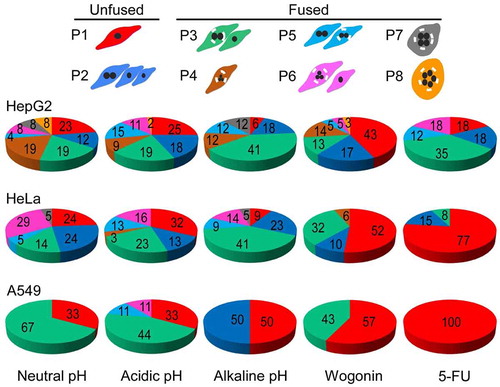
The effects of acidic, alkaline pH, wogonin and 5-FU treatments on the proportions of the relative proportions of the P1-P8 nucleate patterns depended on both the cell line and the nature of the treatment. Upon treatment with neutral, acidic and alkaline pH, more than 50% of the multi-daughters produced at Stage 1 underwent cell fusions, indicated by increase in the (P3+ P4+ P5+ P6+ P7+ P8)% relative to the P1% or the (P1+ P2)%. The presence of 5-FU inhibited the Stage 2 cell fusions as indicated by the increase in P1% in HeLa and A549, but did not inhibit them in HepG2. On the other hand, wogonin inhibited Stage 2 cell fusions in all three cancer cell lines (, Supplementary Table 1 and Supplementary Figure 23).
Figure 4. DNV patterns produced under different treatment conditions. HepG2, HeLa and A549 were treated with neutral, acidic or alkaline pH, or with either wogonin or 5-FU for 24 hours. The color-coded pie charts show the percentages of nucleate patterns P1-P8 under varied treatment conditions, respectively. See numerical percentages in Supplementary Table 2 and Supplementary Figure 23
Negative correlation between cell death and DNV frequencies
Notably, upon treatment with acidic pH, wogonin or 5-FU, the A549, HeLa and HepG2 cells exhibited 5–30% cell death, with the highest death rate recorded upon treatment with 5-FU. Furthermore, the death rates in the three types of cells upon treatment with acidic pH, wogonin or 5-FU were negatively correlated with their DNV frequencies (Supplementary Figures 24–25).
Properties of DNV mother cells
When the mother cells engaged in DNVs in HepG2 and HeLa were examined using the ECLIPSE Ti Live Cell Imaging System, bi-nucleate mother cells were found to exceed mono-nucleate ones at different pH and when treated with 5-FU, but this situation was reversed when the cell cultures were treated with wogonin ()). However, on account of the relatively rapid migration of the A549 cells, it was difficult to distinguish between mono-nucleate and bi-nucleate A549 cells. Bi-nucleation of mother cells in ) was either by birth or by fusion among two cells, which can be between two sister cells or non-sister cell; this fusion was influenced by treatment conditions, as shown in ). In HepG2, the majority of bi-nucleate mother cells arose at neutral pH and wogonin were by birth bi-nucleate (i.e. “born” bi-nucleate) and less than 35% arose from cell fusions under acidic, alkaline pH and in presence of wogonin. In HeLa, around 50% of the bi-nucleate mother cells arose from cell fusions under the acidic and alkaline pH conditions. Interestingly, none of the mother cells in either HepG2 or HeLa arose from fusions under 5-FU treatment.
Figure 5. Mother cell characteristics. (a) Percentages of mother cells containing different numbers of nuclei. (b) Fusion origin versus mitosis-born origin of binucleate mother (BM) cells found under the different treatment conditions as indicated on x-axis below Part D. (c) Area of mother cells giving rise to bi-daughters (i.e. normal division, green circle) or multi-daughters (i.e. yielding three or more daughters in Stage 1, red circle) under different treatment conditions. (d) Division times of mother cells giving rise to bi-daughters (green circle) or multi-daughters (red circle). Statistical analysis was performed using binomial distribution in Part B, and t test with GraphPad prism software in Parts C and D (* p < 0.05, ** p < 0.001 and *** p < 0.0001). All data sets were generated by three independent experiments, and the mean is represented by horizontal bar
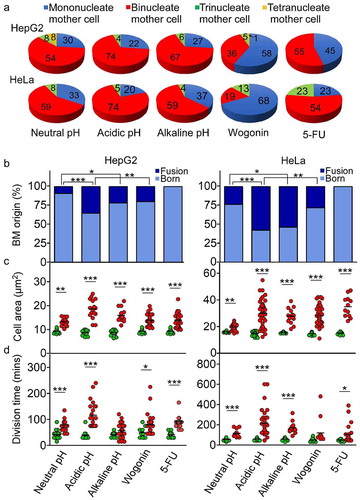
The cell areas of mother cells were recorded as soon as the cells began to round up in shape, which marked the start of mitosis. Live cell imaging was employed to confirm that the cells were mitosis-competent rather than apoptotic. In each instance, the time of division was defined in minutes that lasted from the rounding up of the mother cell to the flattening of at least one of the daughter cells. The areas of mother cells that gave rise to bi-daughters were fairly constant around 8 µm2 in HepG2 or 16 µm2 in HeLa at neutral pH, acidic pH, alkaline pH, or under wogonin or 5-FU treatment (green circles, )); whereas the areas of mother cells that yielded three or more daughters reached 25 µm2, 30 µm2 or more (red circles). This was consistent with the finding that cell size varied with nuclear DNA content [Citation27]. While the cell division times of the normal mitoses that produced two daughters were fairly constant averaging around 30–60 minutes in HepG2 or HeLa at different pHs and under wogonin or 5-FU treatment (green circles, )), the cell division times of DNVs that produced three or more daughters were more widely variable, averaging at ~30-230 minutes in HepG2, or ~30 to 600 minutes in HeLa (red circles). The prolonged duration of DNV mitosis could have arisen from factors such as activation of mitotic checkpoints, increased number of centrosome clustering [Citation28], or double-strand break repair through inter-homolog recombination [Citation29].
Discussion
Previously, multipolar mitosis was observed in the SGB4 glioblastoma cell line [Citation6]. Under mechanical compression, the HeLa cells [Citation7], or the A375, A549 and HeLa cells [Citation8], displayed both multipolar cell divisions and cell fusions. In the present study, DNVs in the HepG2, HeLa and A549 cancer cells yielded in Stage 1 mono-nucleate daughter cells, and clusters consisting of one bi-nucleate and two mono-nucleate daughter cells; the numbers of these daughter cells depended on the nucleate status of the mother cells (). In Stage 2, some of the Stage 1 cells produced underwent fusions between themselves to generate the P3-P8 patterns.
Increases in the small numbers of multi-daughter divisions in A549 could be induced by only acidic pH, but by acidic pH, wogonin or 5-FU in HepG2 or HeLa to reach 9–16% of total mitotic divisions after five days (). Since the hTERT-transformed but non-cancer RPE1 cells did not display DNV under any of the treatment conditions, the DNV events represented mostly if not exclusively a phenotype of the cancer cell. It was noteworthy that normal hepatocyte polyploidization begins after birth with extensive hepatocyte bi-nucleation and eventually generates hepatocytes of several ploidy classes to meet the need of detoxifying a wide range of toxicities. TGFbeta1 was found to induce these ploidy changes in cultured hepatocytes through delocalizaion of the cytokinesis regulator RhoA-GTPase from the mid-body of dividing cells under the molecular axis TGFbeta/Src/RhoA [Citation30]. In the presence of v-Src, however, cell-cycle changes were induced with accumulation of tetraploid cells through delocalization of cytokinesis regulators including Aurora B and Mklp1 as well as weakening of the tetraploidy checkpoint, leading to cytokinesis failure and formation of bi-nucleate daughter cells [Citation31]. In DNV, a related chain of events would be initiated by the constitutively activated Src to yield multipolar divisions with production of mono-nucleate and bi-nucleate daughter cells in Stage 1, followed by cell fusions to form daughter cell patterns with more complex multinucleate ploidies, in agreement with the suggestion that tetraploidy drives chromosomal instability [Citation32]. Because constitutively activated Src would also activate PKB through PI3 kinase and inactivate pro-apoptotic proteins including BAD, caspase 9 and FKHR1 to result in apoptosis-evasion [Citation33], the negative correlation observed between DNV and apoptosis among the HepG2, HeLa and A549 cells (Supplementary Figure 24 and 25) could be explicable by these two Src-centered pathways.
Although the precise mechanisms of few cell fusions have been elucidated aside from instances such as low pH-induced membrane fusion mediated by human metapneumovirus F protein [Citation34], it is well known that multinucleate cancer cells could aggravate the malignant properties of cancers such as aggressive growth and reproduction, metastasis, and drug resistance [Citation35–39]. Accordingly, the findings in this study of (i) formation of bi-nucleate daughter cells in Stage 1 of DNV, and generation of daughter cells bearing up to five nuclei in Stage 2; (ii) increasing severity of DNVs from nil in the transformed but non-cancer RPE1 to a low level in A549, and much higher levels in HeLa and HepG2; and (iii) plausible linkage between DNV and apoptosis-evasion through Src-centered pathways; (iv) inhibition of Stage 2 cell fusions in HepG2 by wogonin but not by 5-FU; and (v) formation of penta-nucleate daughter cells in HepG2 but not in HeLa altogether suggest that DNVs constituted a fundamental Src-based phenotype of malignancy that increased in intensity serially from RPE1 to A549, HeLa and epG2. Therefore, the elimination of DNVs could be usefully included in the objectives of chemotherapy in order to prevent cancer recurrence due to any residual production by DNVs of daughter cells with 4 N+ ploidies enhanced in drug-resistance due to their increased gene copies, and avoidance of apoptosis on account of their aneuploidy and genetic diversity. Where cytotoxic anticancer drugs are ineffective against DNV cell fusions in a malignant cancer, drug cocktails combining the cytotoxic drugs and fusion-reducing agents such as 5-FU and wogonin merit consideration. In this regard, the P1% would provide a convenient assay to assess the extent of inhibition of DNV cell fusions by various drugs and drug combinations.
Conclusion
The present study has shown that a two-staged daughter number variation (DNV) process that produced multiple daughter cells in Stage 1 and generated an array of multinucleate daughter cells in Stage 2. Since DNV occurrence was observed in the cancer cell lines HepG2, HeLa and A549, but not in the transformed non-cancer RPE1, it was mainly if not exclusively a phenotype of cancer. Furthermore, the higher DNV frequency in HepG2 relative to HeLa, HeLa relative to A549, and A549 relative to RPE1 pointed to a parallelism between DNV frequency and cancer cell malignancy. Therefore, further studies on DNVs are required with respect to both their intrinsic biological properties and their potential clinical significance.
Authors’ contributions
Conception and design: H. Xue, I.S. Tyagi,
Development of methodology: I.S. Tyagi, H. Xue
Acquisition of the data: I.S. Tyagi, M.A. Khan, J. Xie, P.Y. Li, S. Chen
Analysis and interpretation of data: I.S. Tyagi, S. Chen, X. Long, H. Xue
Writing, review, and/or revision of the manuscript: I.S. Tyagi, H. Xue
Study supervision: H. Xue
Supplemental Material
Download MS Word (5.1 MB)Disclosure statement
The authors declare that they have no competing interests.
Supplementary material
Supplemental data for this article can be accessed here.
Additional information
Funding
References
- Gisselsson D. Classification of chromosome segregation errors in cancer. Chromosoma. 2008;117(6):511–519.
- McClelland SE. Role of chromosomal instability in cancer progression. Endocr Relat Cancer. 2017;24(9):23–31.
- Hoevenaar WHM, Janssen A, Quirindongo AI, et al. Degree and site of chromosomal instability define its oncogenic potential. Nat Commun. 2020 Mar 20;11(1):1501.
- Beach R, Ricci-Tam C, Brennan C, et al. Aneuploidy causes non-genetic individuality. Cell. 2017;169:229–242.e21.
- Hansemann V. On asymmetric cell division in epithelial cancers and their biological significance. Arch Pathol Anat Physiol Klin Med. 1890;119(119): 299–236. DOI:10.1007/BF01882039.
- Telentschak S, Soliwoda M, Nohroudi K, et al. Cytokinesis failure and successful multipolar mitoses drive aneuploidy in glioblastoma cells. Oncol Rep. 2015 Apr;33(4):2001–2008.
- Tse HTK, Weaver WM, Di Carlo D. Increased asymmetric and multi-daughter cell division in mechanically confined microenvironments. PLoS One. 2012;7:6.
- Kittur H, Weaver W, Di Carlo D. Well-plate mechanical confinement platform for studies of mechanical mutagenesis. Biomed Microdevices. 2014 Jun 01;16(3):439–447.
- Cortez BA, Teixeira PR, Redick S, et al. Multipolar mitosis and aneuploidy after chrysotile treatment: a consequence of abscission failure and cytokinesis regression. Oncotarget. 2016;7(8):8979–8992.
- Zhang T, Lv L, Huang Y, et al. Chromosome nondisjunction during bipolar mitoses of binucleated intermediates promote aneuploidy formation along with multipolar mitoses rather than chromosome loss in micronuclei induced by asbestos. Oncotarget. 2017;8(7):11030–11041.
- BdA C, Quassollo G, Caceres A, et al. The fate of chrysotile-induced multipolar mitosis and aneuploid population in cultured lung cancer cells. PloS One. 2011;6(4):e18600–e18600.
- Chen S, Liu M, Huang H, et al. Heat stress-induced multiple multipolar divisions of human cancer cells. Cells. 2019;8(8):888.
- Dodson H, Wheatley SP, Morrison CG. Involvement of centrosome amplification in radiation-induced mitotic catastrophe. Cell Cycle. 2007;6(3):364–370.
- Bian M, Fu J, Yan Y, et al. Short exposure to paclitaxel induces multipolar spindle formation and aneuploidy through promotion of acentrosomal pole assembly. Sci China Life Sci. 2010;53(11):1322–1329.
- Zasadil LM, Andersen KA, Yeum D, et al. Cytotoxicity of paclitaxel in breast cancer is due to chromosome missegregation on multipolar spindles. Sci Transl Med. 2014;6(229):229ra43–229ra43.
- Rohnalter V, Roth K, Finkernagel F, et al. A multi-stage process including transient polyploidization and EMT precedes the emergence of chemoresistent ovarian carcinoma cells with a dedifferentiated and pro-inflammatory secretory phenotype. Oncotarget. 2015;6(37):40005–40025.
- Danilov AV, Hu S, Orr B, et al. Dinaciclib induces anaphase catastrophe in lung cancer cells via inhibition of cyclin-dependent kinases 1 and 2. Mol Cancer Ther. 2016;15(11):2758–2766.
- Meacham CE, Morrison SJ. Tumour heterogeneity and cancer cell plasticity. Nature. 2013;501(7467):328–337.
- Lim Z-F, Ma PC. Emerging insights of tumor heterogeneity and drug resistance mechanisms in lung cancer targeted therapy. J Hematol Oncol. 2019;12(1): 134–134.
- Martínez-Zaguilán R, Seftor EA, Seftor REB, et al. Acidic pH enhances the invasive behavior of human melanoma cells. Clin Exp Metastasis. 1996;14(2):176–186.
- Longley D, Harkin D, Johnston P. 5-Fluorouracil: mechanisms of action and clinical strategies. Nat Rev Cancer. 2003 May 01;3:331–338.
- Zhao J-G, Ren K-M, Tang J. Overcoming 5-Fu resistance in human non-small cell lung cancer cells by the combination of 5-Fu and cisplatin through the inhibition of glucose metabolism. Tumour Biol. 2014;35(12):12305–12315.
- Ho TYC, Xue H. Effects of four flavonoids from Scutellaria baicalensis on different cancer cell lines. World Sci Technol-Modernization Tradit Chin Med. 2016;18:1845–1854.
- Wu X, Zhang H, Salmani JMM, et al. Advances of wogonin, an extract from Scutellaria baicalensis, for the treatment of multiple tumors. Oncol Targets Ther. 2016;9:2935–2943.
- Schneider CA, Rasband WS, Eliceiri KW. NIH Image to ImageJ: 25 years of image analysis. Nat Methods. 2012 Jul 01;9(7):671–675.
- Akca H, Öze ON. Antitumor effects of TNF-β, 5-Fu and their combinations on cervical carcinoma cell lines. Turk J Med Sci. 2002;32:127–132.
- Gillooly JF, Hein A, Damiani R. Nuclear DNA content varies with cell size across human cell types. Csh Perspect Biol. 2015;7(7):a019091–a019091.
- Godinho SA, Pellman D. Causes and consequences of centrosome abnormalities in cancer. Philos Trans R Soc Lond B Biol Sci. 2014;369(1650):20130467.
- Kumar Y, Yang J, Hu T, et al. Massive interstitial copy-neutral loss-of-heterozygosity as evidence for cancer being a disease of the DNA-damage response. BMC Med Genomics. 2015;8(1):42.
- Puzzonia MDS, Cozzolino AM, Grassi G, et al. TGFbeta induces binucleation/polyploidization in hepatocytes through a Src-dependent cytokinesis failure. PloS One. 2016;11(11):e0167158–e0167158.
- Nakayama Y, Soeda S, Ikeuchi M, et al. Cytokinesis failure leading to chromosome instability in v-Src-induced oncogenesis. Int J Mol Sci. 2017;18(4):811.
- Paim LMG, FitzHarris G. Tetraploidy causes chromosomal instability in acentriolar mouse embryos. Nat Commun. 2019;10(1):4834.
- Wong BR, Besser D, Kim N, et al. TRANCE, a TNF family member, activates Akt/PKB through a signaling complex involving TRAF6 and c-Src. Mol Cell. 1999;4(6):1041–1049.
- Herfst S, Mas V, Ver LS, et al. Low-pH-induced membrane fusion mediated by human metapneumovirus F protein is a rare, strain-dependent phenomenon. J Virol. 2008;82(17):8891.
- Manchester KL. Theodor Boveri and the origin of malignant tumours. Trends Cell Biol. 1995;5(10):384–387.
- Storchova Z, Pellman D. From polyploidy to aneuploidy, genome instability and cancer. Nat Rev Mol Cell Biol. 2004;5(1):45–54.
- Weihua Z, Lin Q, Ramoth AJ, et al. Formation of solid tumors by a single multinucleated cancer cell. Cancer. 2011;117(17):4092–4099.
- Berndt B, Zanker KS, Dittmar T. Cell fusion is a potent inducer of aneuploidy and drug resistance in tumor cell/normal cell hybrids.Crit Rev Oncog. 2013;18(1–2):97–113.
- Sansregret L, Swanton C. The role of aneuploidy in cancer evolution. CSH Perspect Med. 2017;7(1):a028373.