
ABSTRACT
Hepatoblastoma (HB) is the most commonly seen pediatric liver malignancy. With frequent mutations in CTNNB1 gene that encodes β‐catenin, hepatoblastoma has been considered as a Wnt/β‐catenin‐activated malignant tumor. Altered glucose metabolism upon nutrient deprivation (glucose starvation) might also be a critical event in hepatoblastoma carcinogenesis. The present study provides a lncRNA NBR2/miR-22/TCF7 axis modulating proliferation, invasion, migration, and apoptosis of hepatoblastoma cells upon glucose starvation through Wnt and downstream TCF7 signaling pathways. The expression of NBR2 is significantly increased within hepatoblastoma tissue samples; moreover, under incubation with 0 mM glucose (glucose starvation), NBR2 expression is significantly upregulated. NBR2 silencing not only inhibited hepatoblastoma cell viability, invasion, and migration under normal culture condition but also promoted the cell apoptosis under glucose starvation. NBR2 silencing in hepatoblastoma cells also decreased TCF7 mRNA expression and TCF7 protein levels, as well as the protein levels of the cell cycle, glucose entrapment, and EMT markers. miR-22 is directly bound to both NBR2 and TCF7; lncRNA NBR2 counteracted miR-22-mediated repression on TCF7 via acting as a ceRNA. The effects of NBR2 silencing on TCF7 expression, hepatoblastoma cell phenotype, and cell cycle, glucose entrapment, and EMT markers were all significantly reversed by miR-22 inhibition. In conclusion, lncRNA NBR2 aggravates hepatoblastoma cell malignancy through competing with TCF7 for miR-22 binding, therefore counteracting miR-22-mediated repression on TCF7. LncRNA NBR2 might be a promising target to inhibit hepatoblastoma cell proliferation under glucose starvation.
Introduction
Hepatoblastoma (HB) is the most commonly seen pediatric liver malignancy. One of the recently recognized hallmarks of cancer is altered glucose metabolism [Citation1,Citation2]. In several cancer cells, glucose uptake and utilization are found to be significantly increased to maintain the growth and proliferation of cells [Citation3]. When the metabolic demand begins to exceed the supply of the local vascular system, nutrient deficiencies occur within a developing tumor [Citation4]. These microenvironment stresses could force the molecules to adapt, thereby promoting a survival rather than proliferative reaction, leading the clones to select for a more malignant phenotype [Citation5,Citation6]. With frequent mutations in CTNNB1 gene that encodes β‐catenin [Citation7–10], hepatoblastoma has been considered as a Wnt/β‐catenin‐activated malignant tumor. The activation of Wnt is implicated in the metabolic reprogramming of tumors [Citation11]; thus, altered glucose metabolism upon nutrient deprivation (glucose starvation) might also be a critical event in hepatoblastoma carcinogenesis.
LncRNAs (long non-coding RNAs) are a type of RNA, defined as being transcripts with lengths exceeding 200 nucleotides and have various functions within carcinogenesis, such as growth, migration, invasion, and/or metastasis of cancer cells [Citation12,Citation13]. There is growing evidence that lncRNA mutation or dysregulation could induce abnormal gene expression, thus promoting tumorigenesis and tumor development [Citation14–18]. Increasing numbers of studies reported that lncRNAs are crucial cis- or trans-regulators of gene expression. Also, lncRNAs could serve as scaffolds for protein or chromatin-modifying complexes recruitment to their target genes, therefore participating in the formation of ribonucleoprotein complexes in the nucleus [Citation19–21]. As for the cytoplasm, lncRNAs could serve as competitively endogenous RNAs (ceRNAs) for miRNAs, binding, and reducing the amount of free miRNAs, finally upregulating the expression of miRNA target mRNAs [Citation22–24].
In liver cancer, the multiple roles of lncRNAs have been widely recognized. Notably, several lncRNAs were found to play a role in cancer cell metabolic reprogramming. Wei et al. [Citation25] revealed a new correlation between lncRNA HOTAIR and glucose metabolism within HCC (hepatocellular carcinoma) cells; HOTAIR upregulated GLUT1 (glucose transporter isoform 1) and activated mTOR (mammalian target of rapamycin) signaling, thereby promoting glycolysis. LncRNA LINC01638 promoted HCC cell proliferation by increasing cancer cell glucose uptake [Citation26]. Also in HCC cells, lncRNA MALAT1 contributed to HCC development by regulating cancer glucose metabolism, promoting glycolysis, and suppressing gluconeogenesis through increased translation of the transcription factor TCF7L2 [Citation27]. Despite all these previous studies on the role of lncRNA on HCC metabolic reprogramming, lncRNA functions in hepatoblastoma metabolic reprogramming remain unclear.
To identify lncRNA that might affect hepatoblastoma cell proliferation and glucose metabolism, we downloaded and analyzed several datasets from Gene Expression Omnibus (GEO) and revealed that lncRNA NBR2 showed to be dramatically increased within hepatoblastoma tissue samples. LncRNA NBR2 is a glucose starvation-induced lncRNA interacting with AMPK and regulating the activity of AMPK in response to glucose starvation [Citation28,Citation29]. The expression of NBR2 is elicited by the treatment with Phenformin, and NBR2 deficiency induces the sensitivity of tumor cells to phenformin-caused cell death [Citation30]. Moreover, the NBR2-GLUT1 axis regulates cancer cell biguanides sensitivity without affecting AMPK activation [Citation31]. Thus, lncRNA NBR2 might affect cancer cell proliferation under glucose starvation. This speculation was further evidenced by Gene Set Enrichment Analysis (GSEA) and gene co-expression network analysis. GSEA analysis indicated that lncRNA NBR2 was significantly related to the Wnt/β-catenin pathway, and gene co-expression network analysis indicated that lncRNA NBR2 was co-expressed with the Wnt/β-catenin pathway downstream TCF7. Thus, lncRNA NBR2 was chosen for further experiments.
Herein, we employed online data and experimental assays to analyze lncRNA NBR2 expression. Next, NBR2 silencing was generated in hepatoblastoma cells, and the effects of NBR2 silencing on hepatoblastoma cell viability, invasion, and migration, and hepatoblastoma cell apoptosis in response to glucose starvation were examined. Considering the co-expression of lncRNA NBR2 and TCF7, the roles of lncRNA NBR2 in the protein contents of TCF7 and the markers of the cell cycle, glucose entrapment, and epithelial–mesenchymal transition (EMT) were examined. As for the molecular mechanism, miRNAs that might mediate the crosstalk between lncRNA NBR2 and TCF7 were screened for and miR-22 was chosen. The predicted miR-22 binding to lncRNA NBR2 and TCF7, respectively, was validated, and the dynamic effects of lncRNA NBR2 and miR-22 upon TCF7 and hepatoblastoma cell phenotype and related signaling pathways were examined.
Materials and methods
Clinical sample collection
A total of 15 paired adjacent non-cancerous tissues and hepatoblastoma tissues were collected from the patients who undergo routine surgery in Hunan Provincial People’s Hospital. All tissues were fixed in formalin or frozen in liquid nitrogen immediately and stored at −80°C until use. The present study was reviewed and approved by the Ethics Committee of Hunan Provincial People’s Hospital and each patient or guardian signed an informed consent document.
Cell source and cell culture
Hepatocellular carcinoma cell-line HepG2 was obtained from the American Type Culture Collection (HB-8065; ATCC, Manassas, VA, USA) and cultured in Eagle’s Minimum Essential Medium (Catalog No. 30–2003, ATCC) supplemented with 10% FBS (Invitrogen, Carlsbad, CA, USA). Hepatoblastoma cell-line Huh-6 was obtained from Cell Resource Center, Institute of Basic Medical Sciences (IBMS), CAMS & PUMC (3111 C0001 CCC000477; Beijing, China) and cultured in RPMI-1640 medium (Sigma-Aldrich, St. Louis, MI, USA) supplemented with 10% FBS (Invitrogen). Hepatoblastoma cell-line TCHu181 was obtained from the Chinese Academy of Science Cell Bank (Shanghai, China) and cultured in RPMI-1640 medium supplemented with 10% FBS. A human normal liver cell line, L02 was obtained from the China Center for Type Culture Collection (3142 C0001000000077; CCTCC, Wuhan, China) and cultured in Minimum Essential Medium (MEM Eagles with Earle’s Balanced Salts) supplemented with 10% FBS. All cells were cultured in a culture medium with 1% penicillin/streptomycin at 37°C in 5% CO2.
Fluorescence in situ hybridization (FISH)
A specific DIG-labeled NBR2-lnc probe was obtained from Servicebio Tech (Wuhan, China). After digested with proteinase K, the tissue sections were prehybridized with a hybridization solution and then incubated with 1 μM NBR2-lnc probes in hybridization buffer overnight at 37°C. After blocking with rabbit serum, sections were incubated with anti-DIG-HRP for 50 min at 37°C. Then, cells were incubated with FITC-TSA reagent for 5 min at room temperature in the dark. Cell nuclei were stained with DAPI for 8 min at room temperature in the dark. The tissue sections were imaged by fluorescence microscopy (Olympus).
Cell transfection
LncRNA NBR2 silencing was generated by transfecting small interfering RNA targeting lncRNA NBR2 (si-NBR2, compared to si-NC as a negative control). TCF7 overexpression was generated by transfecting TCF7-overexpressing plasmid (TCF7 OE, compared to vector as a negative control). miR-22 overexpression or inhibition was achieved by transfection miR-22 mimics (compared to mimics-NC as a negative control) or miR-22 inhibitor (compared to inhibitor-NC as a negative control). All plasmids were synthesized by Genetop (Changsha, China). All the transfection was conducted using Lipofectamine 3000 (Invitrogen, Carlsbad, CA, USA) following the protocols.
Polymerase chain reaction (PCR)-based analysis
Total RNA extraction, miRNA qTR-PCR, and mRNA expression detection were performed following the methods described previously [Citation32,Citation33] taking RNU6B (for miRNA expression) or β-actin (for mRNA expression) expression as endogenous control, respectively. The 2−ΔΔCT method was used to analyze the relative fold-change.
Cell viability by MTT assay
The cell viability of target cell lines was detected using MTT assay following a method described previously [Citation34]. The OD490 nm values were determined and the cell viability was calculated normalizing to that in the control group (treated with only DMEM and MTT).
Cell invasion by Transwell assay
The Transwell assay was performed following the methods described in a previous study [Citation35] by coating the upper side of the Transwell membrane with 50 mg/l Matrigel (1:8). Cells were then planted into each well of the upper chambers with 200 µl serum-free medium. Medium with 1% FBS was added to the bottom chamber. After a 24-h incubation at 37°C, the cells stayed on the upper side of the membrane were removed. Cells on the bottom side were fixed using formaldehyde for 30 min, stained with crystal violet for 20 min at room temperature, and then counted under a light microscope. Cells from a total of five randomly selected visual fields were counted.
Cell migration by wound healing
Target cells were seeded into 6-well plates at a density of 1 × 10⁵/ml and cultured until cells grew to fill the plates. A 200 µl pipet tip was used to scratch across the well (at intervals of 0.5–1.0 cm) 5 times, with the tip kept vertical. The cells were pre-treated with mitomycin C for 1 h to inhibit cell proliferation. Then, cells were cultured for at 37°C with 5% CO2 for 24 h and the migration distance was observed and determined.
Cell apoptosis by Flow cytometry
Cell apoptosis was examined by performing Flow cytometry assay following the methods described in a previous study [Citation35] using an Annexin V-FITC cell apoptosis assay kit (Beyotime, Shanghai, China). Propidium iodide (PI) staining was performed at room temperature for 20 min in the dark. A flow cytometer was used to assess the results.
Immunoblotting
The protein levels of TCF7, c-myc, cyclin D1, GLUT1, PKM2, HK2, MMP7, and Snail were determined using Immunoblotting. Total protein was extracted and quantified by the bicinchoninic acid (BCA) method. Later, protein samples were separated by SDS-PAGE and transferred to a polyvinylidene fluoride (PVDF) membrane. The membrane was incubated in 5% skim milk at room temperature for 60 min to block unspecific bindings followed by another incubation with proper primary antibodies against TCF7 (ab30961, Abcam, Cambridge, MA, USA), c-myc (10828-1-AP, Proteintech, Rosemont, IL, USA), cyclin D1 (60186-1-Ig, Proteintech), GLUT1 (21829-1-AP, Proteintech), PKM2 (ab137852, Abcam), HK2 (ab209847, Abcam), MMP7 (ab5706, Abcam), or Snail (csb-PA004123, CUSABIO, Wuhan, China) at 4°C overnight. After being washed by TBST for three times, the membrane was further incubated in horseradish peroxidase (HRP)-tagged secondary anti-body (1:5000) at room temperature for 60 min. At last, the membrane was treated by enhanced chemiluminescence (ECL) for visualization.
Dual-luciferase reporter assay
The association of miR-22, lncRNA NBR2, and TCF7 was validated by the dual-luciferase reporter assay. Wild-type or mutant-type NBR2 and TCF7 3ʹUTR luciferase reporter vectors, wt-NBR2/mut-NBR2 and wt-TCF7 3ʹUTR/mut-TCF7 3ʹUTR, were constructed by cloning wild or mutated fragment to the downstream of the Renilla psiCHECK2 vector (Promega, Madison, WI, USA). These reporter vectors were co-transfected in 293 T cells with miR-22 mimics/miR-22 inhibitor and the luciferase activity was then examined using the Dual-Luciferase Reporter Assay System (Promega).
Statistical analysis
Data were exhibited as the mean ± SD and processed using SPSS 17.0 statistical software (SPSS, Chicago, IL, USA). Differences between two or more groups were evaluated using a Student’s t-test or a one-way analysis of variance (ANOVA) followed Turkey’s test. P values of <0.05 were statistically significant.
Results
lncRNA NBR2 expression according to bioinformatics and experimental analyses
To search for lncRNAs deregulated in hepatoblastoma, we downloaded and analyzed GSE131329 discriminating the genetic profile of 53 hepatoblastoma tissues and 14 noncancerous liver tissue samples. The unpaired Students’ t-test was used to analyze the differences in gene expression. The Volcano plot in Figure S1A showed the distribution of differentially expressed genes between hepatoblastoma and noncancerous samples; red plots represented upregulated genes and green ones represented downregulated genes. The Volcano plot in Figure S1B showed the distribution of differentially expressed lncRNAs between hepatoblastoma and noncancerous samples; red plots represented upregulated lncRNAs and green ones represented downregulated lncRNAs. Next, R language function Dist() was used to calculate the distance between the variables, and the function hclust() was used to obtain the hierarchical clustering heatmap for differentially expressed genes (Figure S1C) and lncRNAs (Figure S1D). Among the top differentially expressed lncRNAs, NBR2 has been reported to form a NBR2-GLUT1 axis, regulating cancer cell sensitivity to biguanides [Citation30,Citation31]; thus, lncRNA NBR2 was selected for further experiments.
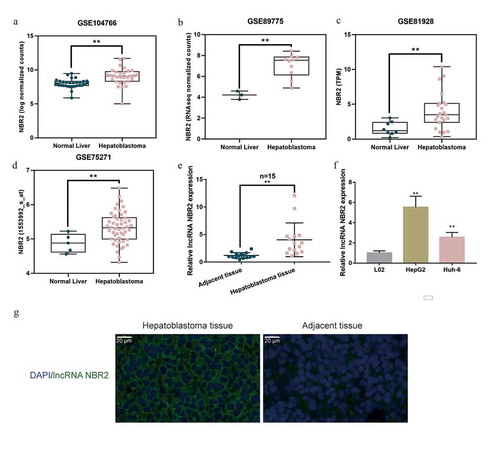
According to GSE104766, lncRNA NBR2 showed to be dramatically increased within hepatoblastoma tissue samples (n = 30) than that within adjacent normal control tissue samples (n = 30) ()). According to GSE89775, lncRNA NBR2 expression showed to be remarkably increased within hepatoblastoma tissue samples (n = 10) than that within non-cancerous liver tissue samples (n = 3) ()). According to GSE81928, lncRNA NBR2 expression showed to be markedly increased within hepatoblastoma tissue samples (n = 23) than that in non-cancerous liver tissue samples (n = 8) ()). According to GSE75271, lncRNA NBR2 expression showed to be considerably increased within hepatoblastoma tissue samples (n = 50) than that in non-cancerous liver tissue samples (n = 5) ()). In collected clinical tissue samples, lncRNA NBR2 expression showed to be dramatically increased within hepatoblastoma tissue samples (n = 15) than that in adjacent normal control tissue samples (n = 15) ()). Before investigating the specific effects of lncRNA NBR2 on hepatoblastoma cells, the study evaluated lncRNA NBR2 expression within L02, HepG2, Huh-6, and TCHu181 cells; as shown in ), lncRNA NBR2 was significantly upregulated within HepG2 and Huh-6 cells than that within non-cancerous liver cell L02. To further confirm the expression and subcellular localization of NBR2, we performed Fish analysis on hepatoblastoma and noncancerous tissue samples. As shown in ), the fluorescent intensity representing NBR2 was stronger in hepatoblastoma tissues compared with that in noncancerous samples; moreover, NBR2 was localized in the cytoplasm. Thus, we use HepG2 and Huh-6 cells for further cellular functional experiments.
Figure 1. Expression of lncRNA NBR2 according to bioinformatics and experimental analyses (a) The expression of lncRNA NBR2 in adjacent non-cancerous tissues (n = 30) and hepatoblastoma tissues (n = 30) was analyzed using Wilcox analysis according to GSE104766. (b) The expression of lncRNA NBR2 in normal liver tissues (n = 3) and hepatoblastoma tissues (n = 10) was analyzed using unpaired Students’ t-test according to GSE89775. (c) The expression of lncRNA NBR2 in normal liver tissues (n = 8) and hepatoblastoma tissues (n = 23) was analyzed using unpaired Students’ t-test according to GSE81928. (d) The expression of lncRNA NBR2 in normal liver tissues (n = 5) and hepatoblastoma tissues (n = 50) was analyzed using unpaired Students’ t-test according to GSE75271. (e) The expression of lncRNA NBR2 was determined in 15 pairs of adjacent non-cancerous tissues and hepatoblastoma tissues by real-time qPCR and analyzed using paired Students’ t-test(f) The expression of lncRNA NBR2 was determined in L02, HepG2, and Huh-6 cells by real-time PCR and analyzed using one-way ANOVA following Turkey’s test. *P < 0.05, **P < 0.01. (g) The Fish analysis was performed on hepatoblastoma and noncancerous tissue samples to investigate the subcellular localization of lncRNA NBR2
Effects of lncRNA NBR2 on hepatoblastoma cell phenotype
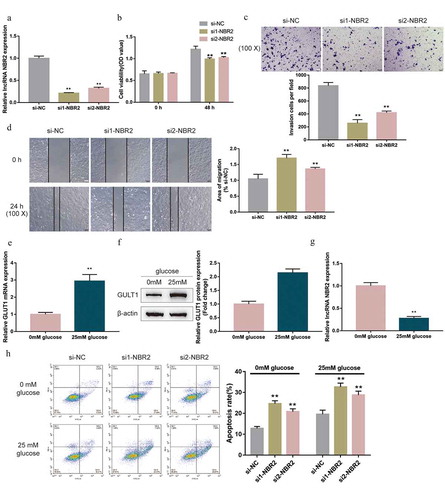
To examine the functions of lncRNA NBR2, the study generated NBR2 silencing in HepG2 cells by transfecting small interfering RNA targeting lncRNA NBR2 (si1-NBR2 and si2-NBR2), as confirmed by real-time qPCR ()). Next, HepG2 cells were transfected with si1-NBR2 or si2-NBR2 for silencing NBR2 and the cellular effects of NBR2 silencing were examined. In NBR2-silenced HepG2 cells, si1-NBR2- or si2-NBR2-induced NBR2 silencing inhibited cell viability ()), cell invasion ()), and cell migration ()). Considering the essential role of the Wnt signaling-associated tumor metabolic reprogramming in hepatoblastoma, the study also examined the effects of lncRNA NBR2 on hepatoblastoma metabolic reprogramming. We cultured HepG2 cells within a medium containing 0 mM or 25 mM glucose and determined the expression of GLUT1 mRNA and lncRNA NBR2; as shown in –g), compared with that in normal glucose medium, glucose starvation (0 mM glucose) significantly downregulated the protein level and mRNA expression of GLUT1 whereas upregulated the expression of lncRNA NBR2, suggesting the potential role of lncRNA NBR2 in cancer cell tolerance for nutrient deficiency. To examine the speculated role of NBR2, we transfected HepG2 cells with si1-NBR2 or si2-NBR2 and cultured them within a medium containing 0 mM or 25 mM glucose; under 0 mM or 25 mM glucose condition, NBR2 silencing dramatically enhanced HepG2 cell apoptosis ()). Si-NBR2 showed better effects. Therefore, it was chosen for further experiments. These data suggest that NBR2 silencing might attenuate the malignant behavior of hepatoblastoma cells, possibly through affecting cancer cell tolerance for nutrient deficiency.
Figure 2. Effects of lncRNA NBR2 on hepatoblastoma cell phenotype (a) LncRNA NBR2 silencing was achieved in HepG2 cells by transfecting small interfering RNA targeting lncRNA NBR2 (si1-NBR2 and si2-NBR2). Si-NC was transfected as a negative control. The transfection efficiency was verified using real-time qPCR. Next, HepG2 cells were transfected with si1-NBR2 or si2-NBR2 and examined for (b) cell viability by MTT assay; (c) cell invasion by Transwell assay; (d) cell migration by wound healing assay. (e-g) HepG2 cells were cultured in a medium containing 0 mM or 25 mM glucose, and examined for the expression of GLUT1 mRNA, protein and lncRNA NBR2 by real-time qPCR and Immunobloting. (h) HepG2 cells were transfected with si1-NBR2 or si2-NBR2, cultured in a medium containing 0 mM glucose, and examined for cell apoptosis by Flow cytometry assay. **P < 0.01
LncRNA NBR2 promotes TCF7 expression to activate the Wnt pathway
To investigate the mechanism of NBR2 functions, we analyzed GSE131329 that contains 53 cases of hepatoblastoma and 14 normal para-carcinoma liver tissues to identify genes that correlate with NBR2. Pearson’s correlation analysis was performed using the psych package of the R language, and 23307 genes were found to correlate with NBR2 expression. Then, we used the ClusterProfiler package to perform GSEA enrichment analysis on NBR2 related genes, and the enriched gene set used was hallmark gene sets. GSEA analysis revealed that NBR2-related genes were positively correlated with the Wnt/β-catenin pathway genes (p value adjusted <0.05) (Figure S2A). There are 16 core genes positively related with NBR2 in this pathway: NCSTN, NKD1, SKP2, DKK1, TP53, KAT2A, PTCH1, NCOR2, LEF1, AXIN2, HDAC2, DKK4, DVL2, TCF7, HDAC11, HEY1. Figure S2C showed the correlation of NBR2 with TCF7, DVL2, HDAC2, HDAC11, and LEF1, respectively, for example.
Next, we analyzed GSE81928 that contains 23 cases of hepatoblastoma, 6 normal para-carcinoma liver tissues, and 3 normal liver tissues, to further confirm the above bioinformatics analysis. Similarly, NBR2-related genes in GSE81928 also enriched in the Wnt/β-catenin pathway (Figure S2B), and, in this dataset, there are 23 genes positively related with NBR2: AXIN2, CCND2, CSNK1E, CTNNB1, CUL1, DVL2, FRAT1, GNAI1, HDAC11, HDAC2, HDAC5, HEY1, KAT2A, LEF1, MAML1, NCOR2, NCSTN, NKD1, PTCH1, RBPJ, SKP2, TCF7, WNT6. Figure S2D showed the correlation of NBR2 with TCF7, DVL2, HDAC2, HDAC11, and LEF1, respectively, for example.
These two GSE sets of NBR2 positively correlated genes intersected in 13 genes: NCSTN, NKD1, SKP2, KAT2A, PTCH1, NCOR2, LEF1, AXIN2, HDAC2, DVL2, TCF7, HDAC11, HEY1 ()). Among them, TCF7, DVL2, HDAC2, HDAC11, and LEF1 have been reported to promote the activation of the Wnt/β-catenin pathway ()). Thus, we examined the expression of these five genes in response to NBR2 knockdown. As shown in ), only TCF7 expression was significantly downregulated upon NBR2 knockdown. Then, we examined more datasets. TCF7 expression showed to be dramatically increased within hepatoblastoma tissue samples (n = 30) than that within adjacent non-cancerous tissue samples (n = 30) according to GSE104766 (Figure S2E), and dramatically increased within hepatoblastoma tissue samples (n = 10) than that within non-cancerous liver tissue samples (n = 3) according to GSE89775 (Figure S2F). In both GSE104766 and GSE89775, TCF7 was positively correlated with NBR2 (Figure S2E-F). Moreover, in liver cancer, silencing TCF family members might lead to the appearance of DEGs (differentially expressed genes), such as critical regulators of cell growth and differentiation, as well as amino acid, lipid, and glucose metabolism [Citation36]. Thus, we selected TCF7 for further experiments.
Figure 3. LncRNA NBR2 promotes TCF7 expression to activate the Wnt pathway (a) GSE131329 and GSE81928 were analyzed to identify genes that were positively correlated with NBR2; positively correlated genes were applied for GSEA analysis and enriched in the Wnt/β-catenin signaling. Two groups of positively correlated genes intersected in NCSTN, NKD1, SKP2, KAT2A, PTCH1, NCOR2, LEF1, AXIN2, HDAC2, DVL2, TCF7, HDAC11, HEY1; among them, TCF7, DVL2, HDAC2, HDAC11, and LEF1 have been reported to promote the activation of the Wnt/β-catenin pathway. (b) HepG2 cells were transfected with si-NC, si1-NBR2, or si2-NBR2 and examined for the expression of TCF7, DVL2, HDAC2, HDAC11, and LEF1 using qRT-PCR. (c) The expression of TCF7 mRNA was determined in 15 pairs of adjacent non-cancerous tissues and hepatoblastoma tissues by real-time qPCR. (d) The correlation between lncRNA NBR2 and TCF7 expression in tissue samples was analyzed using Pearson’s correlation analysis. (e) The protein levels of TCF7 were examined in hepatoblastoma and noncancerous tissue samples using Immunoblotting. (f) The mRNA expression of TCF7 was determined in L02, HepG2, and Huh-6 cells using real-time qPCR. (g) The protein levels of TCF7 were determined in L02, HepG2, and Huh-6 cells using Immunoblotting. (h-i) HepG2 cells were transfected with si-NBR2 and examined for the mRNA expression and protein levels of TCF7 by real-time qPCR and Immunoblotting, respectively. (j) HepG2 cells were co-transfected with si-NBR2 and TCF7-overexpression plasmid (TCF7 OE) and examined for the protein levels of TCF7, c-myc, cyclin D1, GLUT1, PKM2, HK2, MMP7, and Snail by Immunoblotting. *P < 0.05, **P < 0.01, ##P < 0.01
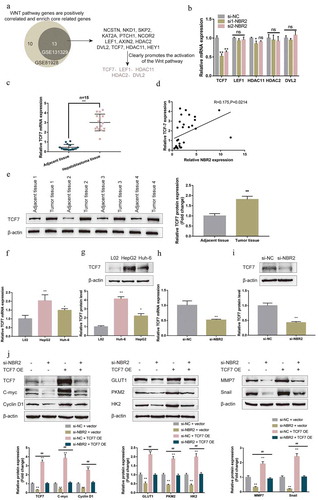
In collected clinical tissue samples, TCF7 mRNA expression also showed to be dramatically increased within hepatoblastoma tissue samples (n = 15) than that within adjacent non-cancerous tissue samples (n = 15) ()), and a positive correlation between lncRNA NBR2 and TCF7 expression was observed ()). The protein levels of TCF7 were examined in hepatoblastoma and noncancerous tissue samples; as shown in ), TCF7 protein levels were significantly increased in cancer samples compared with those in noncancerous samples. Thus, we speculate that NBR2 might act on hepatoblastoma cell malignant behaviors in a TCF7-related manner.
Consistently, the mRNA expression of TCF7 ()) and the protein levels of TCF7 ()) were significantly upregulated within HepG2 and Huh-6 cell lines compared to those within L02 cells. To validate the crosstalk between lncRNA NBR2 and TCF7, the study transfected HepG2 cells with si-NBR2 and examined the mRNA expression and protein levels of TCF7; as shown in , ), NBR2 silencing downregulated TCF7 mRNA expression and decreased TCF7 protein levels. Furthermore, HepG2 cells were co-transfected with si-NBR2 and TCF7-overexpression plasmid (TCF7 OE) and examined for the changes in TCF7 protein contents, cell cycle-associated c-myc and cyclin D1, glucose entrapment-related GLUT1, PKM2, and HK2, and EMT-related MMP7 and Snail. As shown in ), NBR2 silencing significantly inhibited, whereas the overexpression of TCF7 enhanced TCF7, c-myc, cyclin D1, GLUT1, PKM2, HK2, MMP7, and Snail protein contents; the effects of NBR2 silencing were significantly reversed by TCF7 overexpression. These data indicate that NBR2 might crosstalk with TCF7 to modulate hepatoblastoma cell proliferation, metabolism, and metastasis.
miR-22 directly binds to lncRNA NBR2 and TCF7
miRNAs have been reported to mediate the crosstalk between lncRNAs and miRNA targeted mRNAs [Citation37]. Thus, the study continued to screen for miRNAs that might modulate both lncRNA NBR2 and TCF7. We employed three online tools, miRwalk, miRcode, and Targetscan to predict miRNAs that might bind to TCF7, and found 2 miRNAs: miR-22-3p and miR-125a-5p; of them, miR-22-3p might also target lncRNA NBR2 ()). Moreover, the expression of miR-22 showed to be remarkably downregulated within hepatoblastoma tissue samples (n = 53) than that within normal liver tissue samples (n = 8) according to GSE75283 ()). Thus, miR-22 was chosen for further experiments.
Figure 4. miR-22 directly binds to lncRNA NBR2 and TCF7 (a) A schematic diagram showing the process of identifying miRNAs related to lncRNA NBR2 and TCF7. (b) The expression of miR-22 in normal liver tissues (n = 8) and hepatoblastoma tissues (n = 53) according to GSE75283. (c) The expression of miR-22 was determined in 15 pairs of adjacent non-cancerous tissues and hepatoblastoma tissues by real-time qPCR. (d) The correlation of miR-22 with lncRNA NBR2 and TCF7 expression, respectively, in tissue samples was analyzed using Pearson’s correlation analysis. (e) The expression of miR-22 was determined in L02, HepG2, and Huh-6 cells using real-time qPCR. (f) HepG2 cells were transfected with si-NBR2 and examined for the expression of miR-22 using real-time qPCR. (g) HepG2 cells were transfected with miR-22 mimics or miR-22 inhibitor to achieve miR-22 overexpression or inhibition. The transfection efficiency was determined by real-time qPCR. (h) HepG2 cells were transfected with miR-22 mimics or miR-22 inhibitor and examined for the protein levels of TCF7 by Immunoblotting. (i) The reporter plasmids were transfected in 293 T cells with miR-22 mimics or miR-22 inhibitor and examined for the luciferase activity. **P < 0.01, ##P < 0.01
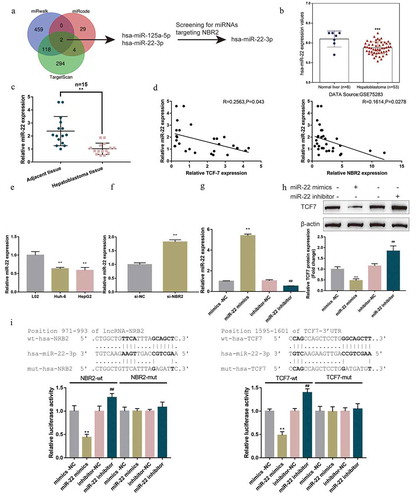
Consistent with tissue sample results, miR-22 expression showed to be remarkably downregulated within hepatoblastoma tissue samples (n = 15) than that within adjacent non-cancerous tissue samples (n = 15) ()). Within tissues, miR-22 exhibited a negative correlation with lncRNA NBR2 and TCF7 expression, respectively ()). In HepG2 and Huh-6 cells, miR-22 expression showed to be dramatically reduced than that within L02 ()). Next, we transfected HepG2 cells with si-NBR2, and determined miR-22 expression; ) showed that NBR2 silencing upregulated miR-22 expression. miR-22 overexpression or inhibition was achieved by transfecting HepG2 cells with miR-22 mimics/inhibitor, as confirmed by real-time qPCR ()). Within HepG2 cells, the overexpression of miR-22 downregulated, whereas the inhibition of miR-22 upregulated TCF7 protein contents ()). Thus, lncRNA NBR2 negatively regulates miR-22, and miR-22 negatively regulates the expression of TCF7.
To validate the predicted miR-22 binding to lncRNA NBR2 and TCF7, the study performed the dual-luciferase reporter assay. As described, we constructed two different types of NBR2 and TCF7 3ʹUTR luciferase reporter plasmids, wild-type and mutant-type. We co-transfected these reporter plasmids in 293 T cells with miR-22 mimics or miR-22 inhibitor and examined for the luciferase activity. As shown in ), the overexpression of miR-22 markedly repressed, while the inhibition of miR-22 promoted the luciferase activity of wt-NBR2 or wt-TCF7 3ʹUTR; however, following the mutation of the putative miR-22 binding site within mut-NBR2 or mut-TCF7 3ʹUTR, miR-22 overexpression or miR-22 inhibition failed to cause any changes in the luciferase activity. These data suggest that miR-22 targets lncRNA NBR2 and TCF7, respectively, to mediate the crosstalk between lncRNA NBR2 and TCF7.
Dynamic effects of lncRNA NBR2 and miR-22 upon hepatoblastoma cell phenotype
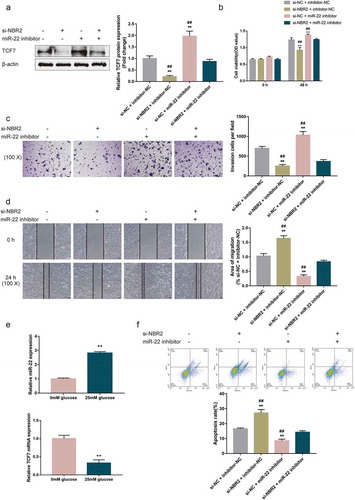
Subsequently, we validated the dynamic effects of lncRNA NBR2 and miR-22 upon hepatoblastoma cell phenotype to evaluate whether NBR2 exerts its effects through miR-22. We co-transfected HepG2 cells with si-NBR2 and miR-22 inhibitor, and determined related indexes. NBR2 silencing significantly decreased, whereas miR-22 inhibition increased TCF7 protein contents ()); the inhibition of miR-22 significantly attenuated the effects of NBR2 knockdown ()). As per the cell phenotype, NBR2 silencing significantly inhibited, whereas miR-22 inhibition enhanced cell viability ()), cell invasion ()), and cell migration ()); the effects of NBR2 silencing were significantly reversed by miR-22 inhibition (–d)). As per the underlying mechanism, glucose starvation (0 mM glucose) significantly downregulated the expression of miR-22 whereas upregulated TCF7 mRNA expression within the HepG2 cell line ()). In the HepG2 cell line cultured in 0 mM glucose medium, NBR2 silencing significantly promoted, whereas miR-22 inhibition inhibited cell apoptosis; miR-22 inhibition significantly reversed the effects of NBR2 knockdown upon cell apoptosis ()). These data suggest that lncRNA NBR2 acts on hepatoblastoma cell phenotype through miR-22.
Figure 5. Dynamic effects of lncRNA NBR2 and miR-22 on hepatoblastoma cell phenotype HepG2 cells were co-transfected with si-NBR2 and miR-22 inhibitor and examined for (a) the protein levels of TCF7 by Immunoblotting; (b) cell viability by MTT assay; (c) cell invasion by Transwell assay; (d) cell migration by wound healing assay. **P < 0.01, compared to the si-NC + inhibitor-NC group; ##P < 0.01, compared to the si-NBR2 + miR-22 inhibitor group. (e) HepG2 cells were cultured in a medium containing 0 mM or 25 mM glucose and examined for the expression of miR-22 and TCF7 mRNA by real-time qPCR. **P < 0.01. (f) HepG2 cells were co-transfected with si-NBR2 and miR-22 inhibitor, cultured in a medium containing 0 mM glucose, and examined for cell apoptosis by Flow cytometry assay. **P < 0.01, compared to the si-NC + inhibitor-NC group; ##P < 0.01, compared to the si-NBR2 + miR-22 inhibitor group
Dynamic effects of lncRNA NBR2 and miR-22 upon TCF7 expression and the Wnt signaling
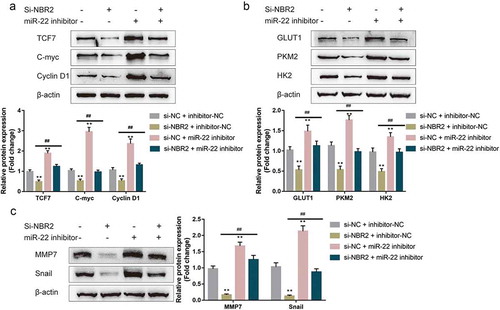
Finally, the study examined the dynamic effects of lncRNA NBR2 and miR-22 upon TCF7 expression and Wnt signaling. We co-transfected HepG2 cells with si-NBR2 and miR-22 inhibitor, and determined the protein contents of related markers. –c) showed that NBR2 silencing significantly decreased, whereas inhibition of miR-22 increased the protein contents of TCF7, cell cycle-related c-myc and cyclin D1, glucose entrapment-related GLUT1, PKM2, and HK2, and EMT-related MMP7 and Snail. The effects of NBR2 silencing on all the markers were significantly reversed by miR-22 inhibition (–c)). Thus, the lncRNA NBR2/miR-22 axis modulates TCF7 to affect hepatoblastoma cell proliferation, metabolism, and metastasis.
Figure 6. Dynamic effects of lncRNA NBR2 and miR-22 on TCF7 expression and the Wnt signaling HepG2 cells were co-transfected with si-NBR2 and miR-22 inhibitor and examined for (a) the protein levels of TCF7, c-myc, and cyclin D1; (b) the protein levels of GLUT1, PKM2, and HK2; (c) the protein levels of MMP7 and Snail by Immunoblotting. **P < 0.01, ##P < 0.01
Discussion
The glycolytic flux of HCC cells was significantly increased, which was fully demonstrated by the metabolomic analysis of HepG2/C3A cells [Citation38]. Glucose deprivation is able to induce hepatocarcinomatous HepG2 cell death. Nevertheless, further research has not yet come to hepatoblastoma cellular response to glucose starvation. Herein, the study provides a lncRNA NBR2/miR-22/TCF7 axis modulating proliferation, invasion, migration, and apoptosis of hepatoblastoma cells upon glucose starvation through Wnt and downstream TCF7 signaling pathways.
Metabolic changes are hallmarks of cancer. Glucose deprivation is a major tumor microenvironment that subsequently leads to cell apoptosis and inhibits cell migration and invasion [Citation39–42]. However, one of the important characteristics of tumor cells is the resistance to cell apoptosis caused by this energy pressure; with the metabolic reprogramming, cancer cells might get adapted to the nutrient limitation and develop other ways of compensating. Unlike normal cells, cancer cells exhibit a variety of metabolism characteristics, including increased glucose uptake, aerobic glycolysis, enhanced glutamine uptake, and glutaminolysis, changes in lipid metabolism, and so on [Citation43]. Accumulating recent evidence links lncRNAs to cancer metabolism. LncRNA NBR2 is one of the first lncRNAs found to directly modulate kinase function, although the exact biochemical mechanism by which NBR2 promotes AMPK kinase activity remains to be investigated [Citation28–30]. LncRNA NBR2 is induced by the LKB1/AMPK signaling pathway under metabolic stress (glucose starvation) [Citation28,Citation44]. Herein, the expression of NBR2 is significantly increased within hepatoblastoma tissue samples, according to online data and experimental analysis on clinical tissue samples. Moreover, under incubation with 0 mM glucose (glucose starvation), NBR2 expression is significantly upregulated, which is consistent with the previous study.
Although the expression of NBR2 is reported to be induced under glucose starvation, its role in the biology of cancer still remains unclear. Iyer et al. [Citation37] reported that NBR2 overexpression within tumor cells could lead to AMPK activation and proliferation inhibition, whereas NBR2 silencing reduced AMPK activation caused by glucose starvation, resulting in defects in autophagy or apoptosis and promoting cancer progression. However, Liu et al. [Citation30] suggested that NBR2 regulates the sensitivity of cancer cells to biguanides through GLUT1. Moreover, Zhang et al. [Citation31] reported that NBR2-GLUT1 axis regulates biguanides sensitivity without affecting AMPK activation; in NBR2 deficiency cancer cells, biguanides treatment led to less cancer cell survival. In the present study, NBR2 silencing not only inhibited hepatoblastoma cell viability, invasion, and migration under normal culture conditions but also promoted the cell apoptosis under glucose starvation (0 mM glucose culture medium). These data suggest that NBR2 silencing might inhibit the malignant behaviors of hepatoblastoma cells.
Frequent mutations in CTNNB1 gene are observed in hepatoblastoma [Citation7–10]; thus, hepatoblastoma has been considered as a malignancy driven by the Wnt/β‐catenin signaling, which shows to be related to tumor metabolic reprogramming [Citation11]. Abnormal Wnt signaling is widely implicated in liver cancer and other gastrointestinal tumors [Citation45,Citation46]. Within mammalian cells, a critical and most studied Wnt pathway is canonical Wnt signaling (or Wnt/β-catenin pathway) that causes an accumulation of β-catenin in the cytoplasm and its eventual translocation into the nucleus to act as a transcriptional coactivator of transcription factors that belong to the TCF family [Citation47]. Herein, the study revealed that lncRNA NBR2 is co-expressed with TCF7, one member of the TCF family that has been reported to promote the progression of perihilar cholangiocarcinoma [Citation48]. After silencing NBR2 in hepatoblastoma cells, not only TCF7 mRNA expression and TCF7 protein levels were decreased but also the protein levels of the cell cycle, glucose entrapment, and EMT markers were decreased. Therefore, NBR2 might exert its effects on hepatoblastoma cell phenotype through TCF signaling.
miRNA-mediated regulatory networks have been implicated in cancers and other diseases, in which they exert oncogenic or tumor suppressor functions [Citation49]. miRNAs function as rheostats, fine-tuning gene expression, and maintaining the function balance of different gene networks [Citation37]. Herein, the study identified miR-22 as the mediator of the crosstalk between lncRNA NBR2 and TCF7 by direct binding. NBR2 silencing downregulated, whereas the inhibition of miR-22 upregulated the protein contents of TCF7; the effects of NBR2 silencing on TCF7 protein level were significantly reversed by the inhibition of miR-22, suggesting that lncRNA NBR2 counteracts miR-22-mediated repression on TCF7 via acting as a ceRNA. Notably, glucose starvation significantly inhibited miR-22 expression, indicating that miR-22 could also contribute to hepatoblastoma cell response to glucose starvation.
As previously reported, miR-22 was decreased within liver carcinoma tissue samples and cells [Citation50]. By direct targeting the 3ʹUTR of Gal-9 and negatively regulating the expression of Gal-9, miR-22 influenced the apoptosis of lymphocytes and the proliferation of tumor cells, therefore exerting a tumor-suppressive effect [Citation50]. Interestingly, miR-22 was also found to affect the glycolysis of cancer cells. In gastric carcinoma cells with resistance to cisplatin, up-regulated ENO1 to enhance glycolysis whereas ENO1 silencing promoted cisplatin sensitivity; miR-22 directly targeted ENO1 to inhibit ENO1 expression [Citation51]. Herein, the effects of miR-22 inhibition on hepatoblastoma cells and TCF7 signaling pathways were opposite to those of NBR2 silencing, suggesting that inhibiting miR-22 could aggravate the malignant behaviors of hepatoblastoma cells. More importantly, the effects of NBR2 silencing on TCF7 expression, hepatoblastoma cell phenotype, and cell cycle, glucose entrapment, and EMT markers were all significantly reversed by miR-22 inhibition, indicating that NBR2/miR-22 axis modulates hepatoblastoma cell malignancy through TCF7 and related signaling pathways.
In conclusion, lncRNA NBR2 aggravates hepatoblastoma cell malignancy through competing with TCF7 for miR-22 binding, therefore counteracting miR-22-mediated repression on TCF7. LncRNA NBR2 might be a promising target to inhibit hepatoblastoma cell proliferation under glucose starvation.
Supplemental Material
Download Zip (3.5 MB)Disclosure statement
No potential conflict of interest was reported by the authors.
Supplementary material
Supplemental data for this article can be accessed here.
Additional information
Funding
References
- Hanahan D, Weinberg RA. The hallmarks of cancer. Cell. 2000;100(1):57–70.
- Hanahan D, Weinberg RA. Hallmarks of cancer: the next generation. Cell. 2011;144(5):646–674.
- Koppenol WH, Bounds PL, Dang CV. Otto Warburg’s contributions to current concepts of cancer metabolism. Nat Rev Cancer. 2011;11(5):325–337.
- Vaupel P, Kallinowski F, Okunieff P. Blood flow, oxygen and nutrient supply, and metabolic microenvironment of human tumors: a review. Cancer Res. 1989;49(23):6449–6465.
- Yun J, Rago C, Cheong I, et al. Glucose deprivation contributes to the development of KRAS pathway mutations in tumor cells. Science. 2009;325(5947):1555–1559.
- Roberts HR, Smartt HJ, Greenhough A, et al. Colon tumour cells increase PGE(2) by regulating COX-2 and 15-PGDH to promote survival during the microenvironmental stress of glucose deprivation. Carcinogenesis. 2011;32(11):1741–1747.
- Cairo S, Armengol C, De Reyniès A, et al. Hepatic stem-like phenotype and interplay of Wnt/beta-catenin and Myc signaling in aggressive childhood liver cancer. Cancer Cell. 2008;14(6):471–484.
- Koch A, Denkhaus D, Albrecht S, et al. Childhood hepatoblastomas frequently carry a mutated degradation targeting box of the beta-catenin gene. Cancer Res. 1999;59(2):269–273.
- Lopez-Terrada D, Gunaratne PH, Adesina AM, et al. Histologic subtypes of hepatoblastoma are characterized by differential canonical Wnt and Notch pathway activation in DLK+ precursors. Hum Pathol. 2009;40(6):783–794.
- Eichenmuller M, Trippel F, Kreuder M, et al. The genomic landscape of hepatoblastoma and their progenies with HCC-like features. J Hepatol. 2014;61(6):1312–1320.
- Gebhardt R, Hovhannisyan A. Organ patterning in the adult stage: the role of Wnt/beta-catenin signaling in liver zonation and beyond. Dev Dyn. 2010;239(1):45–55.
- Yoshimura H, Matsuda Y, Yamamoto M, et al. Expression and role of long non-coding RNA H19 in carcinogenesis. Front Biosci (Landmark Ed). 2018;23:614–625.
- Aird J, Baird A-M, Lim MCJ, et al. Carcinogenesis in prostate cancer: the role of long non-coding RNAs. Noncoding RNA Res. 2018;3(1):29–38.
- Gupta RA, Shah N, Wang KC, et al. Long non-coding RNA HOTAIR reprograms chromatin state to promote cancer metastasis. Nature. 2010;464(7291):1071–1076.
- Prensner JR, Iyer MK, Sahu A, et al. The long noncoding RNA SChLAP1 promotes aggressive prostate cancer and antagonizes the SWI/SNF complex. Nat Genet. 2013;45(11):1392–1398.
- Trimarchi T, Bilal E, Ntziachristos P, et al. Genome-wide mapping and characterization of Notch-regulated long noncoding RNAs in acute leukemia. Cell. 2014;158(3):593–606.
- Xing Z, Lin A, Li C, et al. lncRNA directs cooperative epigenetic regulation downstream of chemokine signals. Cell. 2014;159(5):1110–1125.
- Yang L, Lin C, Jin C, et al. lncRNA-dependent mechanisms of androgen-receptor-regulated gene activation programs. Nature. 2013;500(7464):598–602.
- Engreitz JM, Pandya-Jones A, McDonel P, et al. The Xist lncRNA exploits three-dimensional genome architecture to spread across the X chromosome. Science. 2013;341(6147):1237973.
- Huarte M, Guttman M, Feldser D, et al. A large intergenic noncoding RNA induced by p53 mediates global gene repression in the p53 response. Cell. 2010;142(3):409–419.
- Simon MD, Pinter SF, Fang R, et al. High-resolution Xist binding maps reveal two-step spreading during X-chromosome inactivation. Nature. 2013;504(7480):465–469.
- Abdollahzadeh R, Daraei A, Mansoori Y, et al. Competing endogenous RNA (ceRNA) cross talk and language in ceRNA regulatory networks: a new look at hallmarks of breast cancer. J Cell Physiol. 2019;234(7):10080–10100.
- Chan JJ, Tay Y. Noncoding RNA:RNA regulatory networks in cancer. Int J Mol Sci. 2018;19(5):1310.
- Qu J, Li M, Zhong W, et al. Competing endogenous RNA in cancer: a new pattern of gene expression regulation. Int J Clin Exp Med. 2015;8(10):17110–17116.
- Wei S, Fan Q, Yang L, et al. Promotion of glycolysis by HOTAIR through GLUT1 upregulation via mTOR signaling. Oncol Rep. 2017;38(3):1902– 1908.
- Chen X, Wang L, Wang H. LINC01638 lncRNA promotes cancer cell proliferation in hepatocellular carcinoma by increasing cancer cell glucose uptake. Oncol Lett. 2019;18(4):3811–3816.
- Malakar P, Stein I, Saragovi A, et al. Long noncoding RNA MALAT1 regulates cancer glucose metabolism by enhancing mTOR-mediated translation of TCF7L2. Cancer Res. 2019;79(10):2480–2493.
- Liu X, Xiao Z-D, Han L, et al. LncRNA NBR2 engages a metabolic checkpoint by regulating AMPK under energy stress. Nat Cell Biol. 2016;18(4):431–442.
- Chen Z, Liu H, Jin W, et al. Tissue microRNA-21 expression predicted recurrence and poor survival in patients with colorectal cancer - a meta-analysis. Onco Targets Ther. 2016;9:2615–2624.
- Liu X, Gan B. lncRNA NBR2 modulates cancer cell sensitivity to phenformin through GLUT1. Cell Cycle. 2016;15(24):3471–3481.
- Zhang X, Lin HK. NBR2-GLUT1 axis regulates cancer cell sensitivity to biguanides. Cell Cycle. 2017;16(3):249–250.
- Ge S, Xiong Y, Wu X, et al. Role of growth factor receptor-bound 2 in CCl4-induced hepatic fibrosis. Biomed Pharmacother. 2017;92:942–951.
- Ge S, Zhang L, Xie J, et al. MicroRNA-146b regulates hepatic stellate cell activation via targeting of KLF4. Ann Hepatol. 2016;15(6):918–928.
- Yang -J-J, Liu L-P, Tao H, et al. MeCP2 silencing of LncRNA H19 controls hepatic stellate cell proliferation by targeting IGF1R. Toxicology. 2016;359–360:39–46.
- Zhao T, Xu Y, Ren S, et al. The siRNA silencing of DcR3 expression induces Fas ligand-mediated apoptosis in HepG2 cells. Exp Ther Med. 2018;15(5):4370–4378.
- Norton L, Chen X, Fourcaudot M, et al. The mechanisms of genome-wide target gene regulation by TCF7L2 in liver cells. Nucleic Acids Res. 2014;42(22):13646–13661.
- Kartha RV, Subramanian S. Competing endogenous RNAs (ceRNAs): new entrants to the intricacies of gene regulation. Front Genet. 2014;5:8.
- Iyer VV, Yang H, Ierapetritou MG, et al. Effects of glucose and insulin on HepG2-C3A cell metabolism. Biotechnol Bioeng. 2010;107(2):347–356.
- Yang X, Sun D, Dong C, et al. Pinin associates with prognosis of hepatocellular carcinoma through promoting cell proliferation and suppressing glucose deprivation-induced apoptosis. Oncotarget. 2016;7(26):39694–39704.
- Huang D, Li T, Wang L, et al. Hepatocellular carcinoma redirects to ketolysis for progression under nutrition deprivation stress. Cell Res. 2016;26(10):1112–1130.
- Ferretti AC, Tonucci FM, Hidalgo F, et al. AMPK and PKA interaction in the regulation of survival of liver cancer cells subjected to glucose starvation. Oncotarget. 2016;7(14):17815–17828.
- Ferretti AC, Hidalgo F, Tonucci FM, et al. Metformin and glucose starvation decrease the migratory ability of hepatocellular carcinoma cells: targeting AMPK activation to control migration. Sci Rep. 2019;9(1):2815.
- Pavlova NN, Thompson CB. The emerging hallmarks of cancer metabolism. Cell Metab. 2016;23(1):27–47.
- Liu X, Xiao ZD, Gan B. An lncRNA switch for AMPK activation. Cell Cycle. 2016;15(15):1948–1949.
- Nejak-Bowen KN, Monga SP. Beta-catenin signaling, liver regeneration and hepatocellular cancer: sorting the good from the bad. Semin Cancer Biol. 2011;21(1):44–58.
- Schepers A, Clevers H. Wnt signaling, stem cells, and cancer of the gastrointestinal tract. Cold Spring Harb Perspect Biol. 2012;4(4):a007989.
- Clevers H, Nusse R. Wnt/beta-catenin signaling and disease. Cell. 2012;149(6):1192–1205.
- Liu Z, Sun R, Zhang X, et al. Transcription factor 7 promotes the progression of perihilar cholangiocarcinoma by inducing the transcription of c-Myc and FOS-like antigen 1. EBioMedicine. 2019;45:181–191.
- Croce CM. Causes and consequences of microRNA dysregulation in cancer. Nat Rev Genet. 2009;10(10):704–714.
- Yang Q, JIANG W, ZHUANG C, et al. microRNA-22 downregulation of galectin-9 influences lymphocyte apoptosis and tumor cell proliferation in liver cancer. Oncol Rep. 2015;34(4):1771–1778.
- Qian X, Xu W, Xu J, et al. Enolase 1 stimulates glycolysis to promote chemoresistance in gastric cancer. Oncotarget. 2017;8(29):47691–47708.