
ABSTRACT
PSMG3-AS1 is a characterized oncogenic lncRNA in breast cancer, while its role in other cancers remains unclear. This study was to investigate the role and underlying mechansim of PSMG3-AS1 in non-small cell lung cancer (NSCLC). In this study, we found that PSMG3-AS1 could interact with miR-613. The expression of PSMG3-AS1 was upregulated in NSCLC, while the expression of miR-613 was downregulated in NSCLC. However, PSMG3-AS1 and miR-613 were not significantly correlated with each other. In NSCLC cells, PSMG3-AS1 and miR-613 overexpression failed to regulate the expression of each other. Interestingly, PSMG3-AS1 overexpression led to upregulated SphK1, a downstream target of miR-613. In addition, PSMG3-AS1 overexpression reduced the inhibitory effects of miR-613 on NSCLC cell proliferation. Therefore, PSMG3-AS1 may promote the proliferation of NSCLC cells by sponging miR-613 to upregulate SphK1.
Introduction
Lung cancer is the most common type of malignancy and also the leading cause of cancer deaths [Citation1]. According to the latest GLOBOCAN statistics, lung cancer caused 1,761,007 deaths, which are the 18.4% of all cancer deaths [Citation2]. In the same year, 2,093,876 new cases of lung cancer were diagnosed, accounting for 11.6% of all cancer cases [Citation2]. Smoking is the major cause of lung cancer [Citation3,Citation4]. However, lung cancer also affects never-smoker [Citation5,Citation6]. In effect, more than 10% lung cancers occur in never-smokers, especially females [Citation5]. At present, the molecular pathogenesis of lung cancer remains elusive, and the unclear molecular mechanism of this disease challenges the development of novel treatment approaches [Citation7].
Even in smokers, smoking is not sufficient for the occurrence and development of lung cancer [Citation5,Citation6], indicating the involvement of other factors, such as molecular pathways [Citation7,Citation8]. Understanding the functionality of the molecular pathways provides novel insights to the development of targeted therapy, which aimed to regulate cancer-related gene expression to suppress cancer development [Citation9,Citation10]. Besides proteins, cancer development and progression also requires the involvement of non-coding RNAs (ncRNAs), such as long (> 200 nt) ncRNAs (lncRNAs), which are not involved in protein synthesis but regulate gene expression to promote or suppress cancer [Citation11,Citation12]. However, the function of most lncRNAs in cancer biology remains unclear. PSMG3-AS1 is a novel oncogenic lncRNA identified in breast cancer [Citation13], while its role in other cancers is unknown. Our bioinformatics analysis revealed the possible interaction between PSMG3-AS1 and miR-613, which plays tumor suppressive roles by targeting SphK1 [Citation14]. This study was therefore carried out to analyze the interactions among PSMG3-AS1, miR-613 and SphK1 in non-small cell lung cancer (NSCLC), which is a major subtype of lung cancer.
Materials and methods
Research subjects
This study was approved by Ningbo Medical Center Lihuili Eastern Hospital Ethics Committee. A total of 64 patients with NSCLC (gender: 40 males and 24 females; age: 45 to 69 years; mean age: 54.3 ± 5.8 years) were enrolled at this hospital between March 2017 and June 2019. Patients with a history of malignancies were not included. Patients complicated with other severe clinical disorders or the ones with initiated therapy were also excluded from this study. Patients were diagnosed by histopathological biopsy. During biopsy, paired NSCLC and adjacent (within 3 cm around tumors) non-tumor tissues were collected from each patient. All tissue samples were stored in liquid nitrogen before use. Based on AJCC staging system, the 64 patients included 14, 15, 19 and 16 cases at stage I, II, III and IV, respectively. All patients signed informed consent.
Cell culture
A549, MDA-T120 (human NSCLC cell line) and BEAS-2B (human normal lung epithelial cells) were used. All the cell lines were purchased from ATCC (USA). Cells were cultivated in a medium composed of 10% FBS and 90% RPMI-1640 medium. Cell culture conditions were: 37°C, 95% humidity and 5% CO2.
Cell transfection
With pcDNA 3.1 vector as backbone, expression vectors of PSMG3-AS1 and SphK1 were constructed. Mimic of miR-613 and negative control (NC) miRNA were purchased from Sigma-Aldrich. MDA-T120 cells were transfected with miRNA (40 nM) and/or 10 nM vector using Lipofectamine 2000 (Invitrogen, USA). Tow control groups, including NC (empty vector- or NC miRNA-transfected cells) and Control (C, untransfected cells) were included. Subsequent experiments were performed 48 h later.
Dual luciferase activity assay
With pGL3 vector (Promega Corporation) as backbone, luciferase vector of PSMG3-AS1 was constructed. To analyze the interaction between PSMG3-AS1 and miR-613, luciferase activity assay was performed by co-transfecting MDA-T120 cells with PSMG3-AS1 luciferase vector + miR-613 mimic (miR-613 group) or PSMG3-AS1 luciferase vector + NC miRNA (NC group). Luciferase activity was measured and compared at 48 h later.
RNA sample preparations
Isolation of total RNA from paired tissue samples and MDA-T120 cells was performed using RNAzol reagent (Sigma-Aldrich). MiRNA was harvested by precipitating and washing RNA samples with 85% ethanol. Genomic DNA was removed by digesting RNA samples with DNase I (Takara).
RT-qPCR
The digested RNA samples were subjected to reverse transcriptions using Tetro Reverse Transcriptase (Bioline) to prepare cDNA samples. With cDNA samples as template, qPCR reactions were performed using QuantiTect SYBR Green PCR Kit (QIAGEN) with GAPDH as internal control to analyze the expression levels of PSMG3-AS1 and SphK1. Levels of mature miR-613 expression were measured using All-in-OneTM miRNA qRT-PCR Detection Kit (GeneCopoeia) with U6 as internal control. PCR reactions were performed in triplicates and the method of 2−ΔΔCq was used for data normalization.
Western blot
Isolation of protein samples from MDA-T120 cells was performed using RIPA buffer (Invitrogen). BCA assay (Invitrogen) was performed to measure protein concentrations. Protein samples were denatured in boiling water for 10 min, followed by protein separation using 10% SDS-PAGE gel. PVDF membranes were used to transfer proteins and blocking was performed in 5% nonfat milk (PBS) for 2 h at room temperature. After that, SphK1 (ab61148, 1: 1400, Abcam) and GAPDH (ab9485, 1: 1400, Abcam) primary antibodies were used to incubate with the membranes for 14 h at 4°C. After that, membranes were incubated with lgG-HRP secondary antibody (ab6721, 1:1400, Abcam) for 2 h at room temperature. Signal production was performed using ECL (Sigma-Aldrich, USA). Data were processed using Image J v1.48 software.
Cell proliferation analysis
Following transfections, A549 and MDA-T120 cells were subjected to cell proliferation assay using CCK-8 kit (Sigma-Aldrich). Briefly, 5000 cells were transferred to each well of a 96-well cell culture plate and cells were cultivated at 37°C. OD values at 450 nm were measured every 24 h for a total of 96 h. At 4 h before the measurement of OD values, CCK-8 solution was added into each well to reach final concentration of 10%.
Cell apoptosis assay
A549 and MDA-T120 cells were digested with trypsin at 72 h post-transfection, followed by collection by centrifugation at 1,000 rpm for 5 min. Cells were cleaned twice and centrifuged at 1,000 rpm for 5 min. The collected cells were fixed with 1 ml ethanol at 4°C overnight. The follow experiment referred to the instruction of eBioscience Annexin V Apoptosis Detection Kit APC (Invitrogen™, USA), the treated cells were detected by flow cytometry (BD., USA).
Cell invasion assay
After 48 h of transfection, the cells were transferred to serum‐free medium for 24 h. Transwell chambers were situated into a 24-well plate. The bottom of the transwell chamber was coated with Matrigel (1: 8, Invitrogen™, USA). The cells were seeded into chamber at a density of 1 × 10⁵ cells·mL−1. Additionally, 200 μL cell suspension was included in the apical chamber covered with Matrigel. After the cells were normally cultured for about 24 h, the cells from apical chamber were fixed for 15 min with 4% paraformaldehyde, and stained with 0.5% crystal violet solution for 15 min. Finally, the invasive cells were measured under an inverted microscope in 5 randomly selected visual fields. All investigations involved at least 3 wells, each repeated in triplicate.
Colony formation assay
A549 and MDA-T120 cells were harvest at 48 h post-transfection. A single-cell suspension was obtained through trypsinization and filtration through a 40 m filter; the cells were then seeded into a 6-well plate containing 0.35% soft agar. After about 2 weeks, colonies were stained with crystal violet and observed by microscope. Each sample was analyzed in triplicate, and this experiment was performed three times.
Statistical analysis
Data of triplicates were expressed as mean ± SD. Paired t test was used to compare paired tissues. Unpaired t test was used to compare two independent groups. ANOVA Tukey’s test was used to compare multiple groups. Correlations were analyzed by linear regression. p < 0.05 was statistically significant.
Results
PSMG3‑AS1 interacted with miR-613
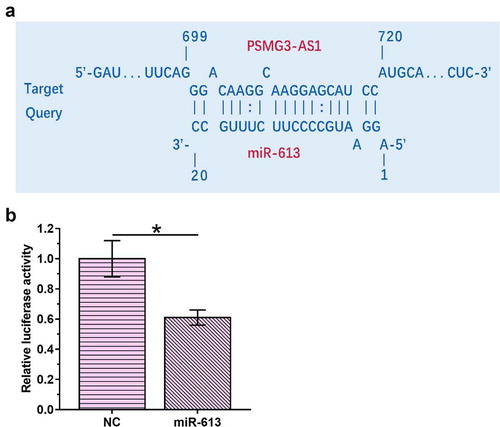
IntaRNA 2.0 (http://rna.informatik.uni-freiburg.de/IntaRNA/Input.jsp) was used to predict the base pairs can be formed by PSMG3-AS1 and miR-613. It was observed that PSMG3-AS1 and miR-613 could form multiple base pairs (). To analyze the interaction between PSMG3-AS1 and miR-613, luciferase activity assay was performed by co-transfecting MDA-T120 cells with PSMG3-AS1 luciferase vector + miR-613 mimic (miR-613 group) or PSMG3-AS1 luciferase vector + NC miRNA (NC group). Compared with NC group, relative luciferase activity was significantly lower in miR-613 group, indicating direct interaction between them ().
Figure 1. PSMG3-AS1 interacted with miR-613 IntaRNA 2.0 was used to predict the base pairs could be formed by PSMG3-AS1 and miR-613 (a). To analyze the interaction between PSMG3-AS1 and miR-613, luciferase activity assay was performed by co-transfecting MDA-T120 cells with PSMG3-AS1 luciferase vector + miR-613 mimic (miR-613 group) or PSMG3-AS1 luciferase vector + NC miRNA (NC group). This experiment was performed in triplicate and mean values were presented and compared.*,p < 0.05
PSMG3-AS1 and miR-613 expression was altered in NSCLC
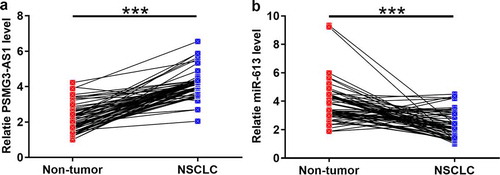
The expression of PSMG3-AS1 and miR-613 in paired NSCLC and non-tumor tissues was measured by RT-qPCR. Compared with NSCLC tissues, the expression of PSMG3-AS1 were significantly increased in non-tumor tissues (, p < 0.001). In contrast, the expression of miR-613 was significantly decreased in NSCLC tissues compared with non-tumor tissues (, p < 0.001).
Figure 2. The expression of PSMG3-AS1 and miR-613 was altered in NSCLC Expression levels of PSMG3-AS1 (a) and miR-613 (b) in paired NSCLC and non-tumor tissues were measured by RT-qPCR. PCR reactions were performed in triplicates and mean values were compared by performing paired t test. ***,p < 0.001
PSMG3-AS1 and miR-613 were not significantly correlated with each other
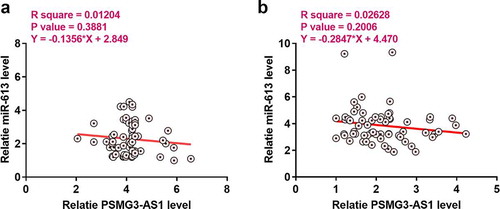
Linear regression was performed to analyze the correlations between the expression levels of PSMG3-AS1 and miR-613 across NSCLC () and non-tumor () tissues. It was observed that expression levels of PSMG3-AS1 and miR-613 were significantly negative correlation with each other in NSCLC.
Figure 3. PSMG3-AS1 and miR-613 were not significantly correlated with each other Linear regression was performed to analyze the correlations between the expression levels of PSMG3-AS1 and miR-613 across NSCLC (a) and non-tumor (b) tissues
PSMG3-AS1 and miR-613 overexpression failed to regulate the expression of each other
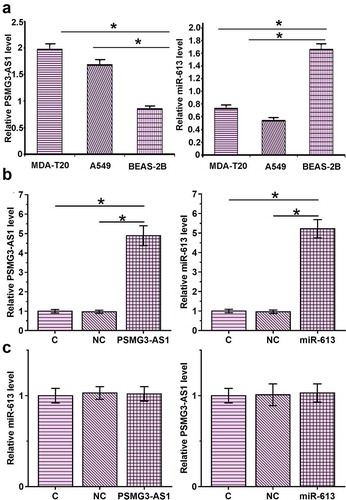
RT-qPCR were used to detect the base expression of PSMG3-AS1 and miR-613 in A549, MDA-T120 and BEAS-2B cells. Since the expression of PSMG3-AS1 and miR-613 in MDA-T120 cells was the highest among all the cell lines (), the MDA-T120 cells were chosen to investigate the relationship between PSMG3-AS1 and miR-613. MDA-T120 cells were transfected with PSMG3-AS1 expression vector or miR-613 mimic to analyze the interaction between PSMG3-AS1 and miR-613. Overexpression of PSMG3-AS1 and miR-613 was confirmed by RT-qPCR (, p < 0.05). Compared with C and NC group, PSMG3-AS1 and miR-613 overexpression failed to significantly affect the expression of each other ().
Figure 4. PSMG3-AS1 and miR-613 overexpression failed to regulate the expression of each other (a). RT-qPCR result of base expression of PSMG3-AS1 and miR-613 in A549, MDA-T120 and BEAS-2B cells. This experiment was performed in triplicate and mean values were presented and compared.*, p < 0.05. MDA-T120 cells were transfected with PSMG3-AS1 expression vector or miR-613 mimic to analyze the interactions between PSMG3-AS1 and miR-613. Overexpression of PSMG3-AS1 and miR-613 was confirmed by RT-qPCR (b). The effects of PSMG3-AS1 and miR-613 overexpression on expression of each other were also analyzed by RT-qPCR (c). Experiments were performed in triplicate and mean values were compared.*, p < 0.05
PSMG3-AS1 overexpression led to upregulated SphK1
Previous study reported that miR-613 promoted cell proliferation by targeting sphk1 in bladder cancer [Citation14]. This result indicated that PSMG3-AS1 may competitive sponge miR-613 to regulate the expression of sphk1. To investigate whether PSMG3-AS1 can serve as an internal sponge of miR-613, and the effects of PSMG3-AS1 and miR-613 overexpression on the expression of SphK1, RT-qPCR () and western blot () were employed. It was observed that miR-613 overexpression led to down regulating the expression of SphK1. PSMG3-AS1 overexpression played an opposite role and attenuated the role of miR-613 (p < 0.05).
Figure 5. PSMG3-AS1 overexpression led to upregulated SphK1 The effects of PSMG3-AS1 and miR-613 overexpression on the expression of SphK1 were analyzed by RT-qPCR (a) and western blot (b). Experiments were performed in triplicate and mean values were compared.*, p < 0.05

PSMG3-AS1 regulate the malignant behavior of NSCL cells through miR-613/SphK1 axis
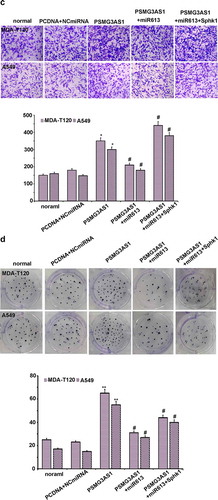
The effects of PSMG3-AS1, miR-613 and SphK1 on the proliferation of MDA-T120 and A549 cells were analyzed by CCK-8 assay. It was observed that miR-613 led to the decreased cell proliferation rate. PSMG3-AS1 and SphK1 overexpression played an opposite role, and PSMG3-AS1 overexpression also inhibited the role of miR-613 overexpression ( A, p < 0.05). On the other hand, flow cytometry assay was employed to investigate the effect of PSMG3-AS1-miR-613/SphK1 axis on apoptosis. Knockdown of PSMG3-AS1 increased the apoptosis, miR-613 and PSMG3-AS1 co-transfection enhanced this effect, but the effect was partially rescued by Sphk1 co-expression ( B, p < 0.05). The transwell assay and clone formation assay were also employed to detect the effect of PSMG3-AS1-miR-613/SphK1 axis on cell invasion and tumor formation. PSMG3AS1 overexpression enhanced the both effects, miR-613 and PSMG3-AS1 co-transfection attenuated these effects, and the effects were also partially re-enhanced by Sphk1 co-expression ( C&D, p < 0.05)
Figure 6. PSMG3-AS1 regulate the malignant behavior of NSCL cells through miR-613/SphK1 axis. (a)The effects of PSMG3-AS1, miR-613 and SphK1 on the proliferation of MDA-T120 and A549 cells were analyzed by performing CCK-8 assay. Experiments were performed in triplicate and mean values were compared.*p < 0.05, ** p < 0.05 vs NC; # p < 0.05, vs pcDNA3.1-PSMG3AS1. (b)Apoptosis rate for cells which were transfected with or without pcDNA3.1+ NCmiRNA+siNC, si-PSMG3-AS1, si-PSMG3AS1+ miR613 or si-PSMG3AS1+ miR613+ pCDNA3.1-SphK1, respectively. Data are presented as mean ± SD from three independent experiments. ** p < 0.01 vs NC. # p < 0.05; ## p < 0.01 vs si-PSMG3-AS1. (c)Cell invasion ability of cells transfected by PSMG3-AS1 with or without miR-613 mimic or pcDNA3.1-SphK1 transfection was detected by cell invasion assay. Data are presented as mean ± SD from three independent experiments. * p < 0.05, vs NC; # p < 0.05, vs pcDNA3.1-PSMG3-AS1. (d)Colony formation ability of cells transfected by PSMG3-AS1 with or without miR-613 mimic or pcDNA3.1-SphK1 transfection was detected by soft agar colony formation assay. Data are presented as mean ± SD from three independent experiments. * p < 0.05, ** p < 0.01 vs NC; # p < 0.05, vs pcDNA3.1- PSMG3-AS1
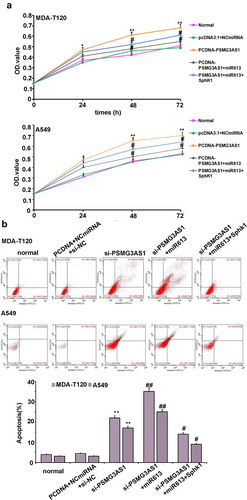
Figure 6b. continue
Discussion
The interactions among PSMG3-AS1, miR-613 and SphK1 in NSCLC were analyzed in NSCLC. We found that the expression PSMG3-AS1 and miR-613 was altered, and PSMG3-AS1 might sponge miR-613 to upregulate SphK1, thereby promoting cancer cell proliferation.
The function of PSMG3-AS1 has only been investigated in breast cancer [Citation13]. It has been reported that PSMG3-AS1 is overexpressed in breast cancer and may sponge miR-143-3p to promote the migration and proliferation of cancer cells [Citation13]. Based on our knowledge, the involvement of miR-143-3p in other types of malignancies remains unclear. Our study is the first to report the upregulation of PSMG3-AS1 in NSCLC. In addition, PSMG3-AS1 overexpression led to increased proliferation rate of cancer cells. Therefore, PSMG3-AS1 may play oncogenic roles in NSCLC by promoting tumor growth.
MiR-613 plays tumor suppressive roles in multiple types of cancers including NSCLC [Citation15]. In a recent study, Li et al. reported that miR-613 was downregulated in NSCLC and targeted CDK4 to induce cell cycle arrest, thereby suppressing cell proliferation [Citation15]. Consistently, our study also revealed the downregulation of miR-613 in NSCLC and its inhibitory effects on cancer cell proliferation. In another study, Yu et al. showed that miR-613 could target SphK1 to suppress the proliferation and migration of bladder cancer cells [Citation14]. In this study, we showed that miR-613 could also target SphK1 to inhibit the proliferation of NSCLC cells. Therefore, miR-613 may target multiple oncogenes to play tumor suppressive roles in NSCLC.
Interestingly, our study showed that miR-613 and PSMG3-AS1 could directly interact with each other, while they failed to regulate the expression of each other. In addition, the expression levels of miR-613 and PSMG3-AS1 were also negatively correlated across NSCLC patients. Besides being the target of miRNAs, lncRNAs can also serve as the spongy of miRNAs to suppress their functions [Citation16]. Our study showed that PSMG3-AS1 competitive sponged miR-613 to regulate SphK1 expression and NSCLC cell malignant phenotype.
In previous study, SphK1 was regarded as a prognostic and predictive value indicator protein in many solid tumors [Citation17]. The increased expression of SphK1 in patients with NSCLC always indicates tumor progression and poor survival outcome [Citation18]. SphK1 was a hub gene to regulate the chemotherapy drug induced apoptosis in many solid tumors including NSCLC [Citation19,Citation20]. It was close related to the tumor cells multidrug resistance (MDR), but its up-stream regulation mechanism was still ambiguous and lacked specificity in NSCLC [Citation21,Citation22]. Given the highly expression specificity of non-coding RNA, PSMG3-AS1/miR-613 axis may reveal a more specificity regulation pathway for SphK1 in this study. Taken together, the PSMG3-AS1/miR-613-SphK1 axis may provide a novel target for clinical diagnose and therapy.
In conclusion, PSMG3-AS1 is overexpression in NSCLC and miR-613 is downregulated in NSCLC. PSMG3-AS1 may sponge miR-613 to upregulate SphK1, thereby regulating cancer cell malignant phenotype.
Acknowledgments
We thank the financial support from Commission of Ningbo (2018A50)
Disclosure statement
No potential conflict of interest was reported by the authors.
Additional information
Funding
References
- Siegel RL, Miller KD, Jemal A. Cancer statistics, 2019. CA Cancer J Clin. 2019;69(1):7–34.
- Bray F, Ferlay J, Soerjomataram I, et al. Global cancer statistics 2018: GLOBOCAN estimates of incidence and mortality worldwide for 36 cancers in 185 countries. CA Cancer J Clin. 2018;68(6):394–424. .
- Reddy KP, Kong CY, Hyle EP, et al. Lung cancer mortality associated with smoking and smoking cessation among people living with HIV in the United States. JAMA Intern Med. 2017;177(11):1613–1621. .
- Islami F, Torre LA, Jemal A. Global trends of lung cancer mortality and smoking prevalence. Transl Lung Cancer Res. 2015;4(4):327–338.
- Couraud S, Zalcman G, Milleron B, et al. Lung cancer in never smokers–a review. Eur J Cancer. 2012;48(9):1299–1311. .
- Pallis AG, Syrigos KN. Lung cancer in never smokers: disease characteristics and risk factors. Crit Rev Oncol Hematol. 2013;88(3):494–503.
- Cheng L, Alexander RE, MacLennan GT, et al. Molecular pathology of lung cancer: key to personalized medicine. Mod Pathol. 2012;25(3):347–369.
- Cooper WA, Lam DCL, O’Toole SA, et al. Molecular biology of lung cancer. J Thorac Dis. 2013;5(Suppl 5):S479–S490. .
- Chan BA. Hughes B G M. Targeted therapy for non-small cell lung cancer: current standards and the promise of the future. Transl Lung Cancer Res. 2015;4(1):36–54.
- Janku F, Stewart DJ, Kurzrock R. Targeted therapy in non-small-cell lung cancer—is it becoming a reality? Nat Rev Clin Oncol. 2010;7(7):401–414.
- Gutschner T, Diederichs S. The hallmarks of cancer: a long non-coding RNA point of view. RNA Biol. 2012;9(6):703–719.
- Yang G, Lu X, Yuan L. LncRNA: a link between RNA and cancer. Biochim Biophys Acta. 2014;1839(11):1097–1109.
- Cui Y, Fan Y, Zhao G, et al. Novel lncRNA PSMG3-AS1 functions as a miR‑143‑3p sponge to increase the proliferation and migration of breast cancer cells. Oncol Rep. 2020;43(1):229–239. .
- Yu H, Duan P, Zhu H, et al. miR-613 inhibits bladder cancer proliferation and migration through targeting SphK1. Am J Transl Res. 2017;9(3):1213–1221.
- Li D, Li DQ, Liu D, et al. MiR-613 induces cell cycle arrest by targeting CDK4 in non-small cell lung cancer. Cell Oncol (Dordr). 2016;39(2):139–147. .
- Jalali S, Bhartiya D, Lalwani MK, et al. Systematic transcriptome wide analysis of lncRNA-miRNA interactions. PloS One. 2013;8(2):e53823. .
- Li J, Guan HY, Gong LY, et al. Clinical significance of sphingosine kinase-1 expression in human astrocytomas progression and overall patient survival. Clin Cancer Res. 2008;14(21):6996–7003. .
- Song L, Xiong H, Li J, et al. Sphingosine kinase-1 enhances resistance to apoptosis through activation of PI3K/Akt/NF-κB pathway in human non-small cell lung cancer. Clin Cancer Res. 2011;17(7):1839–1849. .
- Gachechiladze M, Tichý T, Kolek V, et al. Sphingosine kinase-1 predicts overall survival outcomes in non-small cell lung cancer patients treated with carboplatin and navelbine. Oncol Lett. 2019;18(2):1259–1266. .
- Ito H, Yoshida K, Murakami M, et al. Heterogeneous sphingosine-1-phosphate lyase gene expression and its regulatory mechanism in human lung cancer cell. lines. Biochim Biophys Acta. 2011;1811(3):119–128. doi:10.1016/j.bbalip.2010.12.005.
- Fan Z, Jiang H, Wang Z, et al. Atorvastatin partially inhibits the epithelial-mesenchymal transition in A549 cells induced by TGF-β1 by attenuating the upregulation of SphK1. Oncol Rep. 2016;36(2):1016–1022. .
- Pulkoski-Gross MJ, Obeid LM. Molecular mechanisms of regulation of sphingosine kinase1. Biochim Biophys Acta Mol Cell Biol Lipids. 2018;1863(11):1413–1422.