
ABSTRACT
Glioblastomas (GBM) are heterogeneous highly vascular brain tumors exploiting the unique microenvironment in the brain to resist treatment and anti-tumor responses. Anti-angiogenic agents, immunotherapy, and targeted therapy have been studied extensively in GBM patients over a number of decades with minimal success. Despite maximal efforts, prognosis remains dismal with an overall survival of approximately 15 months.
Bevacizumab, a humanized anti-vascular endothelial growth factor (VEGF) antibody, underwent accelerated approval by the U.S. Food and Drug Administration in 2009 for the treatment of recurrent GBM based on promising preclinical and early clinical studies. Unfortunately, subsequent clinical trials did not find overall survival benefit. Pursuing pleiotropic targets and leaning toward multitarget strategies may be a key to more effective therapeutic intervention in GBM, but preclinical evaluation requires careful consideration of model choices. In this study, we discuss bevacizumab resistance, dual targeting of pro-angiogenic modulators VEGF and YKL-40 in the context of brain tumor microenvironment, and how model choice impacts study conclusions and its translational significance.
Introduction
Glioblastomas (GBM) are highly lethal common brain tumors with a median overall survival (OS) of approximately 15 months despite multimodality standard treatment [Citation1]. Vascular and immune dysfunction, which are among the hallmarks of GBM [Citation2–4], has been targeted intensely in recent years with limited success [Citation3,Citation5]. Vessel recruitment in GBM may include (1) sprouting angiogenesis (new vessels sprout from existing vessels), (2) intussusception (dilation and bifurcation of preexisting vessels), (3) co-option (tumor cells grow and migrate around existing vasculature), (4) vascular mimicry (tumor cells integrate into the endothelial vessel wall), (5) differentiation of cancer stem-like cells into endothelial cells (sometimes described as a variant of vascular mimicry), and (6) recruitment of endothelial progenitor cells (vasculogenesis) [Citation2,Citation6,Citation7].
Bevacizumab is a recombinant humanized monoclonal antibody directed against vascular endothelial growth factor A (VEGF-A), a potent pro-angiogenic factor overexpressed and driving rampant vascularization in GBM [Citation6]. Suggested benefits of bevacizumab therapy include restoration of morphology and organization of tumor-related vasculature, improved tumor oxygenation, decreased tumor interstitial pressure, increase of tumor cell response to cytotoxic effects of chemotherapeutics, glioma cell apoptosis, depletion of glioma stem cell niches, and increased immune-mediated anti-tumor response [Citation6–8]. Bevacizumab has been tested in GBM, both in the primary and recurrent setting, but despite significant improvement of progression-free survival, it has failed to improve OS of these patients [Citation3,Citation9,Citation10].
Proposed resistance mechanisms to bevacizumab include increase in alternative angiogenic pathway activation, change in vessel recruitment (switch toward intussusception, co-option, and vascular mimicry), increased invasiveness, enrichment of tumor-initiating stem cells, metabolic reprogramming, pericyte proliferation around tumor vessels, chemokine secretion, and mobilization of myeloid cells [Citation2,Citation6,Citation7,Citation11–13] ().
Figure 1. Bevacizumab resistance mechanisms and YKL-40 signaling in cancer. Bevacizumab resistance mechanisms include (1) vessel co-option; (2) intussusception; (3) recruitment of BMDCs and CAFs; (4) vascular mimicry; (5) production of alternative angiogenic factors by hypoxic tumor cells; (6) pericyte coverage of blood vessels [Citation6,Citation7]; (7) enhanced invasion of cancer cells into normal brain parenchyma; and (8) mesenchymal transition of tumor cells associated with increased invasiveness, stemness, and metabolic reprogramming [Citation6,Citation7,Citation13]. YKL-40 production is regulated by tumor–astrocyte–microglia/macrophage crosstalk in the brain tumor microenvironment [Citation19,Citation49]. Suggested YKL-40 functions are depicted in orange boxes and include bevacizumab resistance mechanisms (4–8) [Citation2,Citation13]; transdifferentiation of GSCs into pericytes or smooth muscle cells [Citation2]; regulation of endothelial cell-mediated angiogenesis [Citation2,Citation18], apoptosis [Citation21], proliferation and immune modulation, which may be partly mediated by changes in cytokine and chemokine production [Citation58–61]. BMDC, bone marrow-derived cell; BTME, brain tumor microenvironment; CAF, cancer-associated fibroblast; EC, endothelial cell; GSC, glioma stem-like cell
![Figure 1. Bevacizumab resistance mechanisms and YKL-40 signaling in cancer. Bevacizumab resistance mechanisms include (1) vessel co-option; (2) intussusception; (3) recruitment of BMDCs and CAFs; (4) vascular mimicry; (5) production of alternative angiogenic factors by hypoxic tumor cells; (6) pericyte coverage of blood vessels [Citation6,Citation7]; (7) enhanced invasion of cancer cells into normal brain parenchyma; and (8) mesenchymal transition of tumor cells associated with increased invasiveness, stemness, and metabolic reprogramming [Citation6,Citation7,Citation13]. YKL-40 production is regulated by tumor–astrocyte–microglia/macrophage crosstalk in the brain tumor microenvironment [Citation19,Citation49]. Suggested YKL-40 functions are depicted in orange boxes and include bevacizumab resistance mechanisms (4–8) [Citation2,Citation13]; transdifferentiation of GSCs into pericytes or smooth muscle cells [Citation2]; regulation of endothelial cell-mediated angiogenesis [Citation2,Citation18], apoptosis [Citation21], proliferation and immune modulation, which may be partly mediated by changes in cytokine and chemokine production [Citation58–61]. BMDC, bone marrow-derived cell; BTME, brain tumor microenvironment; CAF, cancer-associated fibroblast; EC, endothelial cell; GSC, glioma stem-like cell](/cms/asset/fd579d4a-a974-473b-89cf-6132258ed682/kccy_a_1901037_f0001_c.jpg)
Based on transcriptional profiling, Verhaak and colleagues initially described four molecular GBM subtypes: classical, proneural, neural, and mesenchymal [Citation14], where the neural subtype was later proposed to reflect the presence of nonmalignant cells [Citation15,Citation16]. Upon VEGF-A inhibition, GBM cells undergo a mesenchymal transition, which is also believed to contribute to bevacizumab resistance [Citation6,Citation11,Citation17] ().
The conserved heparin-, chitin-, and collagen-binding glycoprotein YKL-40 (gene: CHI3L1) is a pro-angiogenic factor [Citation2,Citation18] known to induce a mesenchymal phenotype [Citation19] and as a characteristic of the mesenchymal GBM subtype [Citation14]. YKL-40 has been shown to increase upon VEGF-A inhibition [Citation11,Citation17,Citation20], was found upregulated in bevacizumab-resistant GBM cells [Citation13], and is involved in several mechanisms associated with bevacizumab resistance such as glioma cell invasion, angiogenesis [Citation18], vascular mimicry [Citation2], and vascular stability and permeability [Citation21]. In GBM xenograft mouse studies, inhibition of YKL-40 alone and combined with radiotherapy suppressed tumor growth [Citation21,Citation22] and increased survival [Citation21]. Similarly, high YKL-40 expression in GBM patient tumor tissue and elevated plasma YKL-40 levels are associated with short OS [Citation23,Citation24].
Effective dual- or multitarget strategies are urgently needed to overcome bevacizumab resistance. In pursuit of this goal, we interrogated the combined treatment of bevacizumab and mouse anti-human YKL-40 blocking antibody in an orthotopic mouse xenograft model.
Materials and methods
Patients and GBM tissue used for cell culture establishment and characterization
Brain tumor tissue was collected during brain tumor surgery at the Department of Neurosurgery, Copenhagen University Hospital, Denmark, as part of the Copenhagen Brain Tumor Consortium Glio Research Biobank. Samples were processed at the Danish Cancer Society Research Center, Denmark, or at the Department of Pathology, Rigshospitalet, Copenhagen University Hospital. The project was approved by the Danish Regional Committee for Health Research Ethics (H-3-2009-136), and all participants signed informed consents.
Cell cultures
Primary GBM cell cultures were derived through papain dissociation (Worthington Biochemical Corporation, Lakewood, New Jersey, USA, cat. no. LK003150) of fresh or frozen GBM tissue. GBM cells were maintained through subcutaneous xenografting in the flanks of immunocompromised NOD.Cg-Prkdcscid mice (Taconic Biosciences, Inc. Resselaer, New York, USA, cat. no. NOG-F). The protocol was approved by the Danish Regulations for Animal Welfare (Protocol Number 2012-15-2934-00636/2018-15-0201-01391). Following dissection, xenograft tumors were dissociated using papain dissociation according to the manufacturer’s protocol (Worthington Biochemical Corporation, Lakewood, New Jersey, USA, cat. no. LK003150). GBM cell lines were cultured in Neurobasal A media (Invitrogen, Carlsbad, California, USA, cat. no. 12349-015) supplemented with B27 supplement minus vitamin A (Invitrogen, Carlsbad, California, USA, cat. no. 12587-010), human epidermal growth factor (EGF) (20 ng/ml; Invitrogen, Carlsbad, California, USA, cat. no. PHG0313), and human basic fibroblast growth factor (bFGF) (20 ng/ml; Invitrogen, Carlsbad, California, USA, cat. no. PHG0263), glutamax (Invitrogen, Carlsbad, California, USA, cat. no. 35050-038), and penicillin/streptomycin (Invitrogen, Carlsbad, California, USA, cat. no. 15140-122) (COMP). To facilitate growth, cell cultures were supplemented with up to 1% fetal bovine serum (FBS) (Invitrogen, Carlsbad, California, USA, cat. no. 26140095) for a limited time period. Experiments were performed in COMP without FBS. Cells were cultured at 37°C in an atmosphere of 5% CO2. Prior to experiments, single-cell suspensions were prepared using TrypLE (Invitrogen, Carlsbad, California, USA, cat. no. 12563011). Trypan Blue Stain (Invitrogen, Carlsbad, California, USA, cat. no. T20393) was used to exclude dead cells when counting viable cells on the Countess II Automated Cell Counter (Thermo Fisher Scientific, Waltham, Massachusetts, USA) before experiments.
Conditioned media and GBM cell pellets
Cells were plated at 4 × 10⁵ viable cells/ml COMP in triplicates. After 72 h, cells and medium were collected and either centrifuged directly at 2000 rpm for 5 min at 4°C followed by collection of conditioned media or initially centrifuged at 1200 rpm for 5 min at 4°C for collection of GBM cell pellets. For treatment experiments, 2 × 10⁵ viable cells were plated in 300 μl COMP in triplicates. Human and mouse IgG (Sigma-Aldrich, St. Louis, Missouri, USA, cat. no. I4506-50 MG and Invitrogen, Rockford, Illinois, USA, cat. no. 10400C), anti-YKL-40 antibody (Strategic Biosolutions, Newark, Delaware, USA, MAB201.F9), and/or bevacizumab (Roche, Basel, Switzerland, or Pfizer, New York City, New York, USA) (300 μl) were added to a final concentration of either 10 or 100 μg/ml after 1 day of culture and medium collected after additional 72 h as stated above.
Cell viability and tumor growth
Cell viability (in vitro): Single cells were seeded at a density of 3500 cells in 100 μl COMP in 96-well plates. Cell viability was measured at days 0, 1, 4, 7, and 10 using Cell Titer-Glo luminescent cell viability assay (Promega, Madison, Wisconsin, USA, cat. no. G7571) according to the manufacturer’s instructions. Results were analyzed using Microsoft Excel and GraphPad Prism Software version 8 (GraphPad Software, San Diego, California, USA).
Tumor growth (in vivo): Four million viable single GBM cells were injected subcutaneously in the flanks of immunocompromised NOD.Cg-Prkdcscid mice (Taconic Biosciences, Inc. Resselaer, New York, USA, cat. no. NOG-F). Mice were sacrificed when showing clinical signs of sickness or the tumor reached 1000 mm3 (ellipse tumor) or 15 mm (round tumor). Growth was calculated from the day of injection to the day of sacrifice.
Animal studies
Animal studies were approved by the Danish Regulations for Animal Welfare (Protocol Number 2012-15-2934-00636/2018-15-0201-01391).
104 viable G06 GBM cells per mouse were stereotactically implanted into the right frontal cerebral lobe of forty 6- to 8-week-old BomTac:NMRI-Foxn1nu female mice (Taconic Biosciences, Inc. Resselaer, New York, USA, cat. no. NMRINU-F). Mice were randomized into four groups of 10 after surgery and received either human IgG 5 mg/kg (Sigma-Aldrich, St. Louis, Missouri, USA, cat. no. I4506-50 MG) + mouse IgG 5 mg/kg (Invitrogen, Rockford, Illinois, USA, cat. no. 10400 C), anti-YKL-40 antibody 5 mg/kg (Strategic Biosolutions, Newark, Delaware, USA, MAB201.F9), bevacizumab 5 mg/kg (Roche, Basel, Switzerland), or anti-YKL-40 antibody 5 mg/kg (Strategic Biosolutions, Newark, Delaware, USA, MAB201.F9) + bevacizumab 5 mg/kg (Roche, Basel, Switzerland). Treatment was given as 0.1 ml intraperitoneal (IP) injections twice weekly from day 4 post-implantation until death. Mice were monitored daily and sacrificed according to humane endpoints. Blood samples were collected upon euthanization and left to clot for 1–26 h at 4°C followed by centrifugation at 3000 rpm for 10 min at 4°C and subsequent collection of serum.
YKL-40 antibody
We used a mouse anti-human YKL-40 monoclonal antibody (IgG2bκ) for treatment experiments and immunohistochemistry. The antibody was raised against human purified YKL-40 and binds to the epitope GAWRGTTGHHS corresponding to amino acids (AAs) 210–220 of the human YKL-40 protein. The antibody has previously been used in animal studies [Citation25] and has no affinity to murine YKL-40 (JS Johansen, personal observation). The antibody was kindly donated by Professor Paul A. Price, University of California, San Diego.
Enzyme-linked immunosorbent assay (ELISA)
YKL-40 concentrations in conditioned media and mouse serum were determined using a commercial ELISA (Quidel, San Diego, California, USA) with a detection limit of 10 ng/ml, an intra-assay coefficient of variation (CV) of ≤5%, and inter-assay CV <6% [Citation26,Citation27]. Analysis was performed in accordance with the manufacturer’s instructions. Results were analyzed using Microsoft Excel and GraphPad Prism Software version 8 or 9 (GraphPad Software, San Diego, California, USA).
Western blot analysis
Western blot analysis was performed as previously described [Citation28]. Ponceau S Staining Solution (Sigma-Aldrich, St. Louis, Missouri, USA, cat. no. P7170) was used as a loading control, and blots were developed using the ChemiDoc Imaging System (Bio-Rad Laboratories, Inc., Hercules, California, USA).
Immunohistochemistry
Sections of GBM tumor tissue acquired at surgery (n = 10; used for cell line establishment) were stained for YKL-40 as previously described [Citation29] and compared to hematoxylin and eosin standard staining. YKL-40 immunoexpression was evaluated by an expert neuropathologist (ELL) and scored as above or below 30% YKL-40 positive cells.
Fluorescence-activated cell sorting (FACS)
For flow cytometry analysis of CD133 and CD15, freshly papain-dissociated cells were allowed to recover overnight. Next day cells were triturated and filtered through a 70 μm cell strainer (BD Biosciences, Franklin Lakes, New Jersey, USA, cat. no. 352350). Cells were blocked for 1 h on ice in 3% bovine serum albumin (BSA) (Bovine Albumin Fraction V, 7.5% solution; Thermo Fisher Scientific, Waltham, Massachusetts, cat. no. 15260037) diluted in Dulbecco’s phosphate-buffered saline (DPBS) (Invitrogen, Carlsbad, California, USA, cat. no. 14190144) and then incubated with CD133-PE (Miltenyl Biotec, Bergisch Gladbach, Germany, cat. no. 130-113-186), CD15-VioBlue (Miltenyl Biotec, Bergisch Gladbach, Germany, cat. no. 130-113-488), IgG2b-PE (Miltenyl Biotec, Bergisch Gladbach, Germany, cat. no. (130-092-215) or IgM-VioBlue (Miltenyl Biotec, Bergisch Gladbach, Germany, cat. no. 130-098-588) antibodies in 0.5% BSA diluted in DPBS for 30 min on ice with gentle shaking. Antibodies were then removed, and cells were incubated with 7-amino-actinomycin-D staining solution (Miltenyl Biotec, Bergisch Gladbach, Germany, cat. no. 130-111-568) to exclude dead cells. All samples were run on a BD FACSverse cytometer (BD Biosciences, Franklin Lakes, New Jersey, USA) and analyzed using the FlowJo software version 10 (BD Biosciences, Franklin Lakes, New Jersey, USA).
Gene expression analysis
Sample selection and RNA preparation: Total RNA from GBM cell cultures was isolated using the AllPrep DNA/RNA/Protein mini kit (80,004, Qiagen) according to the manufacturer’s instructions.
RNASeq Library Construction: Purified RNA was sent for 100 nt paired end strand specific “BGI-Seq LncRNA-seq(mRNA+lncRNA)” sequencing (obtained via rRNA depletion) at BGI China.
Quantification: The sequenced files (F< ASTQ) were quality checked with FastQC (https://www.bioinformatics.babraham.ac.uk/projects/fastqc/). Gencode v28 (Hg38) [Citation30] transcripts were quantified with Salmon v0.13.1 [Citation31] with bias correction (“–seqBias” and “–gcBias”) and using the “–validateMappings” option. The transcript quantification was imported into R and summarized to gene_id level via IsoformSwitchAnalyzeR [Citation32]. Only genes having at least 10 counts in minimum 6 libraries were kept for further analysis. This cutoff was applied after normalizing to CPM values by also converting the 10 counts into CPM values using the median library size (mimicking the edgeR::filterByExp() function). Normalized expression levels were obtained by using the varianceStabilizingTransformation() function from the DESeq2 R package [Citation33].
Differential expression: Differential expression analysis of the cell lines was done using edgeR v 3.24.0 [Citation34]. Specifically the data were filtered as described above, normalized with TMM normalization [Citation35] and the test for differential expression based on YKL-40 status was done using the Quasi-likelihood framework [Citation36] correcting for gender, MGMT and recurrence status. Cell lines were categorized as YKL-40High or YKL-40Low. YKL-40Low was defined as cell lines with minimal or no YKL-40 protein abundance and minimal or no YKL-40 secretion in conditioned medium.
Gene set enrichment analysis: First, a compendium of gene sets was concatenated, specifically MSigDB v5 [Citation37]was obtained from http://bioinf.wehi.edu.au/software/MSigDB/and the “H” (Hallmark), “C2” (Curated) and “C3” (Motif) and C6 (Oncogenic) collections were extracted. These gene sets were combined with gene sets from Gene Ontology (GO) [Citation38,Citation39]. The GO gene set were downloaded from EBI’s official mirror in January 2016 and to avoid the bulk of gene-duplication only gene sets at level 6 of the “biological process” hierarchical ontology structure were used. Ensemble IDs were translated to entrez ids using the “org.Hs.eg.db” v 3.7.0 Bioconductor package Citation[40]. The collection of gene sets was then reduced to only contain genes tested for differential expression and afterward filtered for gene sets with at least 10 remaining genes.
This collection of gene set was used to make a competitive gene set enrichment analysis via the CAMERA tool [Citation41]. Specifically, we used the -log10(p-value) from the edgeR differential analysis described above as the input statistics used in the cameraPR function implemented in the edgeR package. Gene sets with a false discovery rate-corrected p-value smaller than 0.05 were considered significant. Annotation of gene sets into groups was done by expert curation considering both the gene set descriptions and the genes in each gene set.
Angiogenesis profiling was done from the gene sets above selecting the genes having “ANGIOGEN” as part of its name. To distinguish between background expected expression, we generated 1000 random gene sets with similar length distribution profile. Expression of the angiogenesis and random gene sets was analyzed in each sample using single sample gene set enrichment analysis (ssGSEA) [Citation42]. This analysis is implemented in the GSVA R package in the gsva() function by using methods = ‘ssgsea’ and ssgsea.norm = FALSE. Gene sets having an absolute ssGSEA score larger than 95 percentile of the random gene sets were deemed above background noise and kept for further analysis. The heatmap of the ssGSEA scores was done using the pheatmap R package. Description of gene sets can be found at http://software.broadinstitute.org/gsea/msigdb/search.jsp.
To determine the GBM subtypes of the 10 cell lines, we performed an analysis of GBM subtype profiles (gene sets) [Citation14–16] via ssGSEA as described above and classified each cell line according to its highest ssGSEA score.
Similarity of cell lines and patient tumor samples: The similarity of the RNASeq samples from four paired cell lines and GBM patient samples was done using hierarchical clustering via the R functions dist() and hclust() using default parameters. To remove the expected systematic difference between patient samples and cell lines (due to cell type composition, environment, etc.), we used limma’s [Citation43] removeBatchEffect [Citation44] on the normalized expression data (obtained as described above). Specifically, we first estimated the average excess correlation between paired samples (consensus correlation) by using the duplicateCorrelation() with patient_id as a blocking factor. Next we removed the systematic difference between patient samples and cell lines using the removeBatchEffect() function using the sample type as a batch to remove, supplying patient_id as a blocking factor and supplying the estimated consensus correlation to the correlation argument.
Statistical analysis
Quantified data are presented as mean ± SEM, ±SD or ±95% CI. n designates the number of independent experiments (in vitro), number of animals (in vivo), or patient samples used for analysis. Kaplan–Meier methodology and the log-rank test were used for survival analysis. GraphPad Prism (v8 and v9), R (3.5.1 and 3.6.1), and SPSS (v22.0, IBM Corp., Armonk, NY) were used for statistical analysis.
Results and discussion
Choice of model
Choosing relevant model systems relies on a balance between portraying complexity and demanding clear outputs and is therefore highly dependent on the questions asked [Citation45]. Stable commercially available human GBM cell lines, such as U87MG, are often used in preclinical studies. These cell lines are cost-effective and easy to culture, but do not reflect genotype or heterogeneity of original tumors and develop xenograft tumors missing key GBM features [Citation45–47]. Patient-derived primary GBM cells are usually grown under serum-free conditions and are believed to retain tumor heterogeneity, molecular, and stem-cell like features of the original tumor [Citation45,Citation46,Citation48]. Disadvantages include low take rate of xenografts, heterogeneity between cultures, high cost, and labor demand [Citation45,Citation46]. Recently, cerebral organoids have also emerged in the field as a potential substitute for in vivo modes. Organoids enable growth of GBM tissue with key features of human tumors and a range of cell types in complex 3D models, but these models are highly time-consuming [Citation45] and cost-ineffective. Organotypic brain slice cultures facilitate evaluation of tumor–host interactions in human tissue with intact architecture, which may be valuable given differences in human and murine central nervous system microenvironment [Citation49]. Nevertheless, whole-animal models are still necessary for preclinical testing of treatment efficacy [Citation45].
Among animal models, xenotransplantation of human cells into immunocompromised animals and autochthonous models are the most commonly used. Transplantation of transformed/engineered cells or cancer cells is performed using allograft/isograft (same species) or xenograft (e.g. human to mouse) models and can be orthotopic (i.e. intracranially) or heterotopic (typically subcutaneous implantation). Heterotopic models are discouraged since they lack the brain tumor microenvironment and brain-infiltrative behavior [Citation45]. Using syngeneic hosts (autochthonous models or isografts) gives the possibility of modeling interactions with the immune system, whereas xenograft models require an immunocompromised host [Citation47]. On the other hand, allografts, isografts, and autochthonous models may lack specific characteristics of human tumors and their microenvironment [Citation47].
In patient-derived orthotopic xenograft (PDX) models, fresh patient tumor cells or tissue fragments are implanted without preceding cell culture. This procedure excludes in vitro selection, enabling the existence of clonally different cell subpopulations [Citation47,Citation50], but does not prevent selection and drift over time [Citation45]. Primary GBM cell lines offer the advantage of preliminary in vitro characterization [Citation45] and may therefore be preferred to serial in vivo passaging of PDX models.
In our study, we have generated and characterized a cohort of 10 primary cell cultures maintained through serial passaging in the flank of immunocompromised mice. Using such model line, we interrogated the benefit of combined bevacizumab treatment with a mouse anti-human YKL-40 monoclonal antibody.
Characterization of glioblastoma cell lines
We initially interrogated growth (in vitro and in vivo) of 10 GBM cell lines generated in our laboratory. Two cell cultures did not grow in vivo (subcutaneous xenografts). The remaining eight cell lines presented with in vitro doubling times of 3–5.7 d and large variation in vivo in growth and estimated stem cell content based on CD15 and CD133 (Supplementary file 1). The cell surface markers, CD133 and CD15, have been used routinely to assess and isolate GSCs (glioma stem-like cells) in GBM [Citation51,Citation52].
We further interrogated YKL-40 protein levels and its secretion in our cell line panel to predict susceptibility to YKL-40 inhibition. Six out of 10 cell lines showed varying degrees of YKL-40 protein abundance, remaining four cell lines displayed little or no YKL-40 signal (). This correlated well with YKL-40 secretion in culture medium (). Based on YKL-40 protein abundance and secretion by cell lines, we divided cell lines into YKL-40High and YKL-40Low (). We estimated stem cell content of eight cell lines based on the detection of CD133 and CD15 stem cell markers. Stem cell content did not seem to be correlated with YKL-40 protein abundance and secretion (Spearman correlation: YKL-40High vs. CD133+, p = 0.89; YKL-40High vs. CD15+, p = 0.89), although the two cell lines (G06; G26) with highest CD133 fraction were both YKL-40High cell lines (Supplementary file 1 and ). The YKL-40High cell line G06 grew in vitro and in vivo (subcutaneous and orthotopically), and we therefore chose this line for further experiments.
Figure 2. Characterization of GBM cell lines and dual inhibition of VEGF-A and YKL-40. YKL-40 protein abundance in 10 primary (G14, G17, G18, G26, G48) and low passage xenograft (G06, G07, G11, G16, G20) human GBM cell lines are depicted in a representative western blot (n = 3) in (a) and YKL-40 secretion in conditioned media in (b) is presented as mean and SEM (n = 2, 3 replicates per n). Cell lines were divided in YKL-40High (red) and YKL-40Low (table in b) based on YKL-40 protein abundance and secretion. (c) Representative graph of YKL-40 in conditioned media from G06 GBM cells treated with IgG, anti-YKL-40, bevacizumab, or anti-YKL-40 and bevacizumab presented as mean YKL-40 concentration and SD (n = 2, 3 replicates per n). (d) Mean serum YKL-40 in mice treated with IgG (n = 7), anti-YKL-40 (n = 9), bevacizumab (n = 9), or anti-YKL-40 and bevacizumab (n = 9). (e) Kaplan–Meier survival analysis of cumulative survival from tumor cell-injection until sacrifice of mice treated with IgG (n = 9), anti-YKL-40 (n = 9), bevacizumab (n = 9), or anti-YKL-40 and bevacizumab (n = 9). In (f), cell lines are divided into molecular subtypes [Citation14] based on RNA sequencing and analyzed for CHI3L1 and VEGFA RNA expression. (g, h) represent hierarchical clustering (g) of four cell lines and paired patient samples and hierarchical clustering corrected for systematic differences between cell lines and patient tumor tissue (h). Cell lines in red are considered YKL-40High. Statistical tests: (c) two-way ANOVA and Tukey’s multiple comparisons test; (d) Kruskal–Wallis test and Dunn’s multiple comparisons test; (e) log-rank test. Statistical significance levels: * p < 0.05; ns, non-significant
![Figure 2. Characterization of GBM cell lines and dual inhibition of VEGF-A and YKL-40. YKL-40 protein abundance in 10 primary (G14, G17, G18, G26, G48) and low passage xenograft (G06, G07, G11, G16, G20) human GBM cell lines are depicted in a representative western blot (n = 3) in (a) and YKL-40 secretion in conditioned media in (b) is presented as mean and SEM (n = 2, 3 replicates per n). Cell lines were divided in YKL-40High (red) and YKL-40Low (table in b) based on YKL-40 protein abundance and secretion. (c) Representative graph of YKL-40 in conditioned media from G06 GBM cells treated with IgG, anti-YKL-40, bevacizumab, or anti-YKL-40 and bevacizumab presented as mean YKL-40 concentration and SD (n = 2, 3 replicates per n). (d) Mean serum YKL-40 in mice treated with IgG (n = 7), anti-YKL-40 (n = 9), bevacizumab (n = 9), or anti-YKL-40 and bevacizumab (n = 9). (e) Kaplan–Meier survival analysis of cumulative survival from tumor cell-injection until sacrifice of mice treated with IgG (n = 9), anti-YKL-40 (n = 9), bevacizumab (n = 9), or anti-YKL-40 and bevacizumab (n = 9). In (f), cell lines are divided into molecular subtypes [Citation14] based on RNA sequencing and analyzed for CHI3L1 and VEGFA RNA expression. (g, h) represent hierarchical clustering (g) of four cell lines and paired patient samples and hierarchical clustering corrected for systematic differences between cell lines and patient tumor tissue (h). Cell lines in red are considered YKL-40High. Statistical tests: (c) two-way ANOVA and Tukey’s multiple comparisons test; (d) Kruskal–Wallis test and Dunn’s multiple comparisons test; (e) log-rank test. Statistical significance levels: * p < 0.05; ns, non-significant](/cms/asset/94bb9cbe-a285-4eee-8522-effa5bd50025/kccy_a_1901037_f0002_c.jpg)
Dual YKL-40 and VEGF inhibition
To evaluate the combined effect of bevacizumab and mouse anti-human YKL-40 blocking antibody on human YKL-40 secretion by GBM cells and their survival, we first treated G06 GBM cells in vitro with bevacizumab and anti-human YKL-40 antibody alone or in combination and measured YKL-40 levels in conditioned media from GBM cells. In vitro, bevacizumab increased YKL-40 secretion from G06 GBM cells, but addition of anti-YKL-40 antibody abrogated the effect of anti-VEGF treatment on YKL-40 secretion (). The YKL-40High G17 cell line showed similar response to bevacizumab and anti-YKL-40 antibody combination in regard to YKL-40 secretion, particularly at high dosage (Supplementary file 2a). Next, we analyzed the impact of the same treatment regime in vivo using a G06 xenograft orthotopic mouse model. Discordant with our in vitro findings, the treatment of animals with anti-YKL-40 blocking antibody in combination with bevacizumab increased YKL-40 levels in mouse serum compared to IgG control and bevacizumab treatment (). Possible explanations could be that (1) long-term sequestration of YKL-40 yields a compensatory increase in YKL-40 production; (2) secretion of YKL-40 through the blood-brain barrier is facilitated by YKL-40 inhibition and constricted by VEGF inhibition given that VEGF and YKL-40 have opposite effects on vascular stability and integrity [Citation21,Citation53]; and (3) the increased YKL-40 secretion is driven by changes in tumor microenvironment, which has previously been found to influence YKL-40 expression in U87 glioma cells [Citation54]. Interestingly, we did not find a correlation between YKL-40 immunoreactivity (above or below 30% YKL-40 immunoreactivity) in patient samples and YKL-40 dichotomization of corresponding GBM cell lines (data not shown). This could be due to the fact that in vitro, GBM cells are excised from their natural microenvironment and cultured in media heavily supplemented by growth factors such as bFGF, both of which influence YKL-40 expression [Citation54]. In addition, YKL-40 was generally up-regulated in pseudopalisading tumor cells surrounding necrosis in patient tumor samples (Supplementary file 2b), which is consistent with previously reported hypoxic induction of YKL-4054. This pattern was independent of YKL-40 immunoreactivity score. YKL-40 immunoexpression was also seen in endothelial cells in microvascular proliferation (Supplementary file 2c) and evident macrophages (Supplementary file 2d), although not consistently.
Neither treatment with anti-YKL-40 antibody nor combined treatment with bevacizumab impacted mouse survival in vivo compared to control or bevacizumab treatment, respectively (). Intriguingly, several preclinical studies have found inhibition of YKL-40 to decrease tumor growth and angiogenesis and increase survival in GBM models [Citation18,Citation21]. A possible explanation for such different outcome may be the choice of YKL-40 blocking antibody. The antibody used in our study recognizes AAs 210–220 of the human YKL-40 protein. A chitin-binding motif between 325 and 339 AA residues at the C-terminus of YKL-40 is crucial for Akt pathway activation [Citation55], thus there may be important binding motifs, which are still functional. However, two other studies have used this particular antibody and found it to reduce tube formation [Citation25], inhibit tumor growth in a subcutaneous GBM tumor model (Junker et al. 2007, Abstract 4099, AACR meeting 2007), and induce intratumoral hemorrhage and increase tumor size in a subcutaneous melanoma model [Citation25]. Considering the hemorrhages described in melanoma, we used a smaller dose of anti-YKL-40, than used by Junker et al. (Junker et al. 2007, Abstract 4099, AACR meeting 2007). This may have been insufficient to block YKL-40 function. These discordant results could also be caused by tissue-specific YKL-40 interactions. One of the two studies used a melanoma model [Citation25] and the other one analyzed heterotopic (subcutaneous) GBM tumors using the U87 commercial cell line, whereas we implanted low-passage patient-derived xenograft GBM cells orthotopically in the brain, ensuring a more relevant tumor microenvironment.
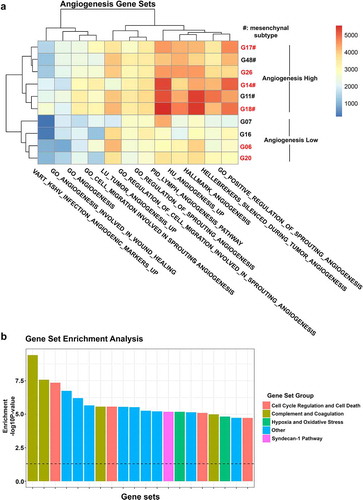
The choice of molecular GBM subtype may also influence treatment response. Thus, to explore whether the molecular subtype of our model of choice impacted the outcome of in vivo study, we performed RNA sequencing analysis with the aim to determine molecular subtype as well as angiogenic profile of our cell lines. GBM cell lines generated herein represented classical, mesenchymal, neural, and proneural molecular subtypes according to the signatures originally proposed by Verhaak [Citation14] (). Using recent classification schemes [Citation15,Citation16], cell lines were grouped as classical or mesenchymal (Wang 2017) and MES1 or NPC1 (Neftel 2019), respectively (Supplementary file 3). Paired patient samples were available for four cell lines and confirmed molecular subtypes using two out of three classification systems (Supplementary file 4). Three out of four cell lines clustered with paired patient samples in hierarchical clustering corrected for systematic differences between cell lines and patient material (e.g. differences in cell type composition, microenvironment, and growth conditions) (, h) and shared molecular signature defined by Neftel and colleagues [Citation16] (Supplementary file 4). As expected, most (three out of five) mesenchymal cell lines were YKL-40High (), but all (two out of two) classical cell lines and one (one out of two) neural cell line were also defined as YKL-40High, questioning specificity of YKL-40 as a mesenchymal marker. The G06 cell line used for experiments belonged to the classical subtype. Exploring expression of gene sets related to angiogenesis, all mesenchymal tumors displayed an elevated angiogenic profile (). This was not the case for classical and proneural cell lines (), and therefore questions the relevance of testing anti-angiogenic treatment in these cell lines.
Figure 3. Gene expression analysis of 10 GBM cell lines. (a) Heatmap depicting single sample gene set enrichment of angiogenesis-related gene sets in 10 GBM cell lines. (b) Gene set enrichment analysis showing the 20 most overrepresented gene sets between YKL-40High and YKL-40Low cell lines divided into the groups: Cell Cycle Regulation and Cell Death; Complement and Coagulation; Hypoxia and Oxidative Stress; Other; and Syndecan-1 pathway. A full list of differentially enriched gene sets can be found in Supplementary file 5. Cell lines in red are considered YKL-40High
A recent study found a tendency toward mesenchymal transition with increasing bevacizumab monotherapy treatment duration [Citation13]. Such change was not observed when bevacizumab was combined with traditional chemotherapy [Citation13,Citation56]. Interestingly, Urup and colleagues reported that GBM tumors responding to bevacizumab combined with chemotherapy shift toward a more proneural and less mesenchymal phenotype at the time of progression [Citation56]. Relevance of YKL-40 inhibition may therefore be dependent on bevacizumab treatment regime and initial bevacizumab response. In addition, concomitant inhibition of YKL-40 and VEGF may impact subtype transition, favoring a sequential treatment regimen.
Importance of the brain tumor microenvironment and the immune system
Tissue-specific pathways and complex factors in the brain tumor microenvironment including composition of cell types, cytokines, mediators, cell-cell contact, tumor-stromal interaction, extracellular matrix composition, and immune cells influence GBM growth [Citation4,Citation19].
Gene set enrichment analysis showed that gene sets involved in the complement pathway were consistently overrepresented in YKL-40High cell lines ( and Supplementary file 5). Although scarcely investigated in GBM, unbalanced activation of the complement system in the tumor microenvironment may contribute to immune evasion, invasion, GSC maintenance, GSC interactions, and angiogenesis based on molecular pathways modulated by the complement system [Citation57]. Recently, YKL-40 has also been implicated in the regulation of Th2/Th1 balance, T cell activation and proliferation [Citation58,Citation59], recruitment of inflammatory cells [Citation59,Citation60], and “M2-like” reprogramming of macrophages [Citation59] in mouse lung cancer, melanoma, and/or breast cancer (). Heiland and colleagues (2019) found CHI3L1 (YKL-40), CD274 (PD-L1), and complement components to be upregulated in tumor-associated reactive astrocytes [Citation49]. Astrocyte and microglia activation and immune suppression were at least partly mediated by tumor–astrocyte–microglia crosstalk [Citation49] (). CHI3L1 expression was also found to be highly variable in GBM tumor cells but stable in tumor-associated astrocytes [Citation19]. Since we used an antibody only targeting human YKL-40 in the present study, YKL-40 secreted from murine astrocytes and macrophages/microglia was not inhibited and could affect tumor growth.
Conclusions
Dual targeting of VEGF and YKL-40 did not alter survival in tumor-bearing mice. Previous preclinical studies focused on bevacizumab resistance and YKL-40 function in GBM are primarily based on established cell lines or few primary GBM cell cultures [Citation13,Citation18,Citation22], which leaves this topic a subject to further studies and their clinical impact remains elusive. Considering the pleiotropic role YKL-40 plays in cancer cells, tumor microenvironment, and immune system (), it seems unlikely to achieve the true clinical benefit of YKL-40 inhibition using a purely anti-human antibody in an immunocompromised mouse model. Nevertheless, our results emphasize the importance of thorough consideration for the model choice and study design. Acknowledging the impact of brain tumor microenvironment, heterogeneity, and limitations of experimental models may be the key to overcome decades of failed attempts to translate preclinical findings.
Future directions could be to use combinations of multiple models, such as organotypic brain slice cultures, larger panels of well-characterized primary GBM cell lines, extensive validation of blocking antibodies, and treatments with interspecies cross-reactivity and syngeneic mouse models using CRISPR or similar technologies to engineer consistent models.
Supplemental Material
Download Zip (8 MB)Acknowledgments
Many thanks to the biomedical laboratory scientist Ulla Kjærulff-Hansen, Department of Medicine, Herlev and Gentofte Hospital, for her assistance with determination YKL-40; to Kirstine Juul Elbæk and Monica Blomstrøm, Brain Tumor Biology group, Danish Cancer Society Research Center, for expert technical assistance with cell culture and xenografting and to Nicolai Møllegaard, Brain Tumor Biology group, Danish Cancer Society Research Center, for technical assistance. We also thank Signe Regner Michaelsen, Department of Radiation Biology, Rigshospitalet, Christian Brøchner, and Professor Kjeld Møllgård, Department of Cellular and Molecular Medicine, University of Copenhagen, for valuable scientific discussions. was created with Biorender.com.
Disclosure statement
No potential conflict of interest was reported by the authors.
Data availability statement
The data sets for this manuscript are not publicly available due to participant confidentiality. Requests to access the data sets should be directed to Camilla Bjørnbak Holst, [email protected].
Supplementary material
Supplemental data for this article can be accessed here.
Additional information
Funding
References
- Stupp R, Hegi ME, Mason WP, et al. Effects of radiotherapy with concomitant and adjuvant temozolomide versus radiotherapy alone on survival in glioblastoma in a randomised phase III study: 5-year analysis of the EORTC-NCIC trial. Lancet Oncol. 2009;10:459–466.
- Shao R, Taylor SL, Oh DS, et al. Vascular heterogeneity and targeting: the role of YKL-40 in glioblastoma vascularization. Oncotarget. 2015;6:40507–40518.
- Wick W, Platten M, Wick A, et al. Current status and future directions of anti-angiogenic therapy for gliomas. Neuro Oncol. 2016;18(3):315–328.
- Quail DF, Joyce JA. The microenvironmental landscape of brain tumors. Cancer Cell. 2017;31(3):326–341.
- Fecci PE, Sampson JH. The current state of immunotherapy for gliomas: an eye toward the future. J Neurosurg. 2019;131(3):657–666.
- Wang N, Jain RK, Batchelor TT. New directions in anti-angiogenic therapy for glioblastoma. Neurotherapeutics. 2017;14(2):321–332.
- Tamura R, Tanaka T, Miyake K, et al. Bevacizumab for malignant gliomas: current indications, mechanisms of action and resistance, and markers of response. Brain Tumor Pathol. 2017;34(2):62–77.
- Thompson EM, Frenkel EP, Neuwelt EA. The paradoxical effect of bevacizumab in the therapy of malignant gliomas. Neurology. 2011;76(1):87–93.
- Gilbert MR, Dignam JJ, Armstrong TS, et al. A randomized trial of bevacizumab for newly diagnosed glioblastoma. N Engl J Med. 2014;370(8):699–708. .
- Chinot OL, Wick W, Mason W, et al. Bevacizumab plus radiotherapy-temozolomide for newly diagnosed glioblastoma. N Engl J Med. 2014;370:709–722.
- Piao Y, Liang J, Holmes L, et al. Acquired resistance to anti-VEGF therapy in glioblastoma is associated with a mesenchymal transition. Clin Cancer Res off J Am Assoc Cancer Res. 2013;19:4392–4403.
- Michaelsen SR, Staberg M, Pedersen H, et al. VEGF-C sustains VEGFR2 activation under bevacizumab therapy and promotes glioblastoma maintenance. Neuro Oncol. 2018;20:1462–1474.
- Chandra A, Jahangiri A, Chen W, et al. Clonal ZEB1-driven mesenchymal transition promotes targetable oncologic anti-angiogenic therapy resistance. Cancer Res. 2020;80(7):1498–1511.
- Verhaak RG, Hoadley KA, Purdom E, et al. Integrated genomic analysis identifies clinically relevant subtypes of glioblastoma characterized by abnormalities in PDGFRA, IDH1, EGFR, and NF1. Cancer Cell. 2010;17:98–110.
- Wang Q, Hu B, Hu X, et al. Tumor Evolution of Glioma-Intrinsic Gene Expression Subtypes Associates with Immunological Changes in the Microenvironment. Cancer Cell. 2017;32(42–56.e6). DOI:10.1016/j.ccell.2017.06.003.
- Neftel C, Laffy J, Filbin MG, et al. An integrative model of cellular states, plasticity, and genetics for glioblastoma. Cell. 2019;178:835–49.e21.
- Lu KV, Chang JP, Parachoniak CA, et al. VEGF inhibits tumor cell invasion and mesenchymal transition through a MET/VEGFR2 complex. Cancer Cell. 2012;22:21–35.
- Faibish M, Francescone R, Bentley B, et al. A YKL-40-neutralizing antibody blocks tumor angiogenesis and progression: a potential therapeutic agent in cancers. Mol Cancer Ther. 2011;10:742–751.
- Wurm J, Behringer SP, Ravi VM, et al. Astrogliosis releases pro-oncogenic Chitinase 3-Like 1 causing MAPK signaling in glioblastoma. Cancers (Basel) 2019 11 10.3390/cancers11101437
- Saidi A, Javerzat S, Bellahcene A, et al. Experimental anti-angiogenesis causes upregulation of genes associated with poor survival in glioblastoma. Int J Cancer. 2008;122:2187–2198.
- Shao R, Francescone R, Ngernyuang N, et al. Anti-YKL-40 antibody and ionizing irradiation synergistically inhibit tumor vascularization and malignancy in glioblastoma. Carcinogenesis. 2014;35:373–382.
- Francescone RA, Scully S, Faibish M, et al. Role of YKL-40 in the angiogenesis, radioresistance, and progression of glioblastoma. J Biol Chem. 2011;286:15332–15343.
- Qin G, Li X, Chen Z, et al. Prognostic value of YKL-40 in patients with glioblastoma: a systematic review and meta-analysis. Mol Neurobiol. 2017;54(5):3264–3270.
- Boisen MK, Holst CB, Consalvo N, et al. Plasma YKL-40 as a biomarker for bevacizumab efficacy in patients with newly diagnosed glioblastoma in the phase 3 randomized AVAglio trial. Oncotarget. 2018;9(6):6752–6762.
- Salamon J, Hoffmann T, Elies E, et al. Antibody directed against human YKL-40 increases tumor volume in a human melanoma xenograft model in scid mice. PloS One. 2014;9(4):e95822.
- Bojesen SE, Johansen JS, Nordestgaard BG. Plasma YKL-40 levels in healthy subjects from the general population. Clin Chim Acta. 2011;412(9–10):709–712.
- Kjaergaard AD, Nordestgaard BG, Johansen JS, et al. Observational and genetic plasma YKL-40 and cancer in 96,099 individuals from the general population. Int J Cancer. 2015;137(11):2696–2704.
- Rasmussen RD, Gajjar MK, Tuckova L, et al. BRCA1-regulated RRM2 expression protects glioblastoma cells from endogenous replication stress and promotes tumorigenicity. Nat Commun. 2016;7(1):13398.
- Holst CB, Brochner CB, Vitting-Seerup K, et al. Astrogliogenesis in human fetal brain: complex spatiotemporal immunoreactivity patterns of GFAP, S100, AQP 4 and YKL-40. J Anat. 2019;235(3):590–615.
- Liao Y, Smyth GK, Shi W. The R package Rsubread is easier, faster, cheaper and better for alignment and quantification of RNA sequencing reads. Nucleic Acids Res. 2019;47(8):e47.
- Patro R, Duggal G, Love MI, et al. Salmon provides fast and bias-aware quantification of transcript expression. Nat Methods. 2017;14(4):417–419.
- Vitting-Seerup K, Sandelin A. The Landscape of Isoform Switches in Human Cancers. Mol Cancer Res. 2017;15(9):1206–1220.
- Love MI, Huber W, Anders S. Moderated estimation of fold change and dispersion for RNA-seq data with DESeq2. Genome Biol. 2014;15(12):550.
- Robinson MD, McCarthy DJ, Smyth GK. edgeR: a Bioconductor package for differential expression analysis of digital gene expression data. Bioinformatics. 2010;26(1):139–140.
- Robinson MD, Oshlack A. A scaling normalization method for differential expression analysis of RNA-seq data. Genome Biol. 2010;11(3):R25.
- Lun AT, Chen Y, Smyth GK. It’s DE-licious: a recipe for differential expression analyses of RNA-seq experiments using quasi-likelihood methods in edgeR. Methods Mol Biol. 2016;1418:391–416.
- Liberzon A, Subramanian A, Pinchback R, et al. Molecular signatures database (MSigDB) 3.0. Bioinformatics. 2011;27(12):1739–1740.
- Ashburner M, Ball CA, Blake JA, et al. Gene ontology: tool for the unification of biology. The gene ontology consortium. Nat Genet. 2000;25(1):25–29.
- The Gene Ontology Consortium. Expansion of the gene ontology knowledgebase and resources. Nucleic Acids Res. 2017;45. D331-D8
- Gentleman RC, Carey VJ, Bates DM, et al. Bioconductor: open software development for computational biology and bioinformatics. Genome Biol. 2004;5(10):R80.
- Wu D, Smyth GK. Camera: a competitive gene set test accounting for inter-gene correlation. Nucleic Acids Res. 2012;40(17):e133.
- Barbie DA, Tamayo P, Boehm JS, et al. Systematic RNA interference reveals that oncogenic KRAS-driven cancers require TBK1. Nature. 2009;462:108–112.
- Ritchie ME, Phipson B, Wu D, et al. limma powers differential expression analyses for RNA-sequencing and microarray studies. Nucleic Acids Res. 2015;43(7):e47–e.
- Smyth GK, Michaud J, Scott HS. Use of within-array replicate spots for assessing differential expression in microarray experiments. Bioinformatics. 2005;21(9):2067–2075.
- Robertson FL, Marques-Torrejon MA, Morrison GM, et al. Experimental models and tools to tackle glioblastoma. Dis Model Mech. 2019;12(9):dmm040386.
- Da Hora CC, Schweiger MW, Wurdinger T, et al. Patient-derived glioma models: from patients to dish to animals. Cells. 2019;8(10):1177.
- Huszthy PC, Daphu I, Niclou SP, et al. In vivo models of primary brain tumors: pitfalls and perspectives. Neuro Oncol. 2012;14(8):979–993.
- Stockhausen MT, Broholm H, Villingshoj M, et al. Maintenance of EGFR and EGFRvIII expressions in an in vivo and in vitro model of human glioblastoma multiforme. Exp Cell Res. 2011;317(11):1513–1526.
- Henrik Heiland D, Ravi VM, Behringer SP, et al. Tumor-associated reactive astrocytes aid the evolution of immunosuppressive environment in glioblastoma. Nat Commun. 2019;10(1):2541.
- Miyai M, Tomita H, Soeda A, et al. Current trends in mouse models of glioblastoma. J Neurooncol. 2017;135(3):423–432.
- Mj S, Woolard K, Dh N, et al. SSEA-1 is an enrichment marker for tumor-initiating cells in human glioblastoma. Cell Stem Cell. 2009;4(5):440–452.
- Bao S, Wu Q, McLendon RE, et al. Glioma stem cells promote radioresistance by preferential activation of the DNA damage response. Nature. 2006;444(7120):756–760.
- Greenberg JI, Shields DJ, Barillas SG, et al. A role for VEGF as a negative regulator of pericyte function and vessel maturation. Nature. 2008;456(7223):809–813.
- Junker N, Johansen JS, Hansen LT, et al. Regulation of YKL-40 expression during genotoxic or microenvironmental stress in human glioblastoma cells. Cancer Sci. 2005;96(3):183–190.
- Chen CC, Llado V, Eurich K, et al. Carbohydrate-binding motif in chitinase 3-like 1 (CHI3L1/YKL-40) specifically activates Akt signaling pathway in colonic epithelial cells. Clin Immunol. 2011;140(3):268–275.
- Urup T, Staunstrup LM, Michaelsen SR, et al. Transcriptional changes induced by bevacizumab combination therapy in responding and non-responding recurrent glioblastoma patients. BMC Cancer. 2017;17(1):278.
- Bouwens Van Der Vlis TAM, Kros JM, Mustafa DAM, et al. The complement system in glioblastoma multiforme. Acta Neuropathol Commun. 2018;6(1):91.
- Kim DH, Park HJ, Lim S, et al. Regulation of chitinase-3-like-1 in T cell elicits Th1 and cytotoxic responses to inhibit lung metastasis. Nat Commun. 2018;9(1):503.
- Cohen N, Shani O, Raz Y, et al. Fibroblasts drive an immunosuppressive and growth-promoting microenvironment in breast cancer via secretion of Chitinase 3-like 1. Oncogene. 2017;36(31):4457–4468.
- Elias JA. Chi3l1 regulation of checkpoint regulating, costimulatory and coinhibitory molecules in primary and metastatic lung cancer. Annual Report - US Army Medical Research and Material Command 2018.
- Ma B, Akosman B, Kamle S, et al. Chitinase 3-like-1 stimulates PD-L1 and other immune checkpoint inhibitors. bioRxiv. 2021. DOI:10.1101/2021.01.15.426788