
ABSTRACT
Colorectal cancer (CRC) is one of the most common cancer, and the early detection of CRC is essential to improve the survival rate of patients. To identify diagnostic markers for colorectal cancer (CRC) by screening differentially expressed proteins (DEPs) in CRC. The DEPs were initially obtained from 12 CRC samples and 12 healthy control samples, and verification analysis was performed in another 34 CRC samples and 34 normal controls. Kyoto Encyclopedia of Genes and Genomes (KEGG) pathway enrichment with DEPs was analyzed by the R package clusterProfiler (Version 3.2.11), and the DEP-associated protein-protein interaction (PPI) network was created from the STRING database. Additionally, Support Vector Machine (SVM) model prediction and survival analyses were conducted on the key DEPs. Preliminary screening and functional analysis showed that the DEPs mainly overrepresented in pathways such as cytokine-cytokine receptor interaction, chemokine signaling pathway, Rap1, Ras, and MAPK signaling pathways. The key DEPs, including AgRP, ANG-2, Dtk, EOT3, FGF-4, FGF-9, HCC-4, IL-16, IL-8, MIF, MSPa, TECK, TPO, TRAIL R3, and VEGF-D, were used to construct a custom chip. The drug-gene interaction network suggested that TPO was a key drug target. ROC curve showed the SVM diagnostic model with the DEPs IL-8, MSPa, MIF, FGF-9, ANG-2, and AgRP had better diagnostic performance with an AUC of 0.933. Survival analysis showed the expression of FGF9, TPO, TRAIL R3, Dtk, TECK and FGF4 were associated with prognosis. This study revealed the important serum proteins in the pathogenesis of CRC, which might serve as useful and noninvasive predictors for the diagnosis of CRC.
Introduction
Colorectal cancer (CRC), one of the common gastrointestinal cancers, is the fourth most frequent cause of cancer mortality with more than 1.2 million annual new cases globally [Citation1–3]. Although there have been great advancements in surgical and adjuvant therapies, the prognosis of CRC still remains poor [Citation4,Citation5]. And due to the lack of symptoms in the early stages of CRC, more than half of CRC cases are diagnosed at an advanced stage or present with distant metastasis [Citation6,Citation7]. Furthermore, because CRC develops slowly from removable precancerous lesions, early detection of CRC is essential to improve the survival rate of patients. Hence, there is an urgent need for credible and noninvasive biomarkers for the early detection of CRC.
High throughput techniques have played critical roles in exploring effective and nonaggressive biomarkers for cancer detection [Citation8]. Proteomic analysis, which is efficient, powerful, and cost-effective, is especially commonly used in clinical research [Citation9]. Currently, several tumor biomarkers, such as CA125, carcinoembryonic antigen (CEA) and CA199 are regarded as the conventional predictors for CRC [Citation10,Citation11]. However, their reliability remains controversial because they are insufficiently sensitivity. In this study, we screened key differentially expressed proteins (DEPs) between CRC serum samples and normal controls based on Kyoto Encyclopedia of Genes and Genomes (KEGG) pathway and Gene ontology (GO) functional analyses, analysis of the Protein-Protein Interaction (PPI) network, and prediction of drug-gene interactions. Subsequently, 15 key DEPs were chosen to construct a custom chip, and the candidate DEPs associated with the diagnosis and prognosis of CRC patients were determined using Support Vector Machine (SVM) model prediction and survival analysis.
Materials and methods
Ethical statement
The study was approved by the Ethics Committee of China-Japan Union Hospital. The informed consents were obtained from all participants.
Samples collection
In total, 24 serum samples, including 12 CRC samples (age: 61.4 ± 12.0; 6 men and 6 women) and 12 healthy control samples (age: 60.9 ± 12.8; 6 men and 6 women) were included in this study, and none of the patients had received surgery or chemotherapy. All patients were pathologically diagnosed with CRC. All samples were processed immediately, and the processing steps were as follows: after extracting the blood, it was immediately put into the centrifuge tube and placed vertically on the rack of the centrifuge tube. Then the blood was placed in the centrifuge for 1 hour and centrifuged at 3000P/m for 10 minutes. The protein was obtained directly from serum as follows: the serum samples were centrifuged at 10,000 RPM and 4 °C for 5 min, and the supernatant was taken to obtain serum protein. 120 proteins were collected, and then divided into two chips (C6 and C7, which were two corresponding membranes used for covering 120 proteins), with 60 proteins per chip. The proteins were then sorted by the indexes of cumulative strength, average cumulative strength, and average net cumulative strength through detecting by the chemiluminescence imaging system (Tanon, Shanghai, China).
Data preprocessing
The raw datasets with the three indexes were preprocessed to adjust for the background using the limma package (Version 3.26.9; http://bioconductor.org/packages/release/bioc/html/limma.html) [Citation12]. After the data was normalized with the quantile method, the log (X + 1, 2) transformation (X presents the expressed value) was applied to the data.
Identification of DEPs and hierarchical clustering
The limma package was used to screen for DEPs between the CRC and normal control samples. The threshold for DEP screening was set at P < 0.05 and |log2FC| > 0.263. Hierarchical cluster analysis of the group samples was conducted with the pheatmap package (Version 1.0.8; https://cran.r-project.org/web/packages/pheatmap).
Functional enrichment analysis of DEPs
Functional enrichment analysis was performed for all the DEPs obtained from the three indexes to investigate their involved functions. KEGG pathway [Citation13] and GO [Citation14] functional analyses of these DEPs were performed using the R package of clusterProfiler (Version 3.2.11, http://www.bioconductor.org/packages/release/bioc/html/clusterProfiler.html). P < 0.05 was selected as the threshold value.
The construction of the Protein-Protein interaction (PPI) network
The STRING database (version: 10.0, http://www.string-db.org/) [Citation15] was used to identify interactions between proteins. A required confidence (combined score) > 0.4 was set as the threshold for interaction, and the network was constructed with the Cytoscape [Citation16] software.
Prediction of drug-gene interactions
In order to investigate whether the genes encoding DEPs could be targeted in CRC treatment or be used for drug development, we mined the existing information in the drug-gene interaction database (DGIdb2.0; http://www.dgidb.org/). With the preset filters of “FDA Approved”, drug-gene interaction pairs were predicted. Cytoscape (version: 3.2.0, http://www.cytoscape.org/) was used to construct the network.
Verification analysis
To further determine the clinical value of the key DEPs, we screened another 68 serum samples including 34 CRC samples (age; 61.5 ± 9.3; 21 men and 13 women) and 34 normal controls (age; 61.0 ± 11.2; 21 men and 13 women) with a custom commercial chip. The chip was added with chemiluminescence solution and tested directly by was detected by laser scanner and analyzed by Maxpix, and the samples was in duplicate. The limma package was used to screen for DEPs between the CRC and normal samples, and the threshold for DEP screening was set at P < 0.05 and |log2FC| > 0.585. Specifically, 15 proteins: AgRP, ANG-2, Dtk, EOT3, FGF-4, FGF-9, HCC-4, IL-16, IL-8, MIF, MSPa, TECK, TPO, TRAIL R3 and VEGF-D were used to construct the custom chip. Bioinformatic analysis with the chip used the same data preprocessing, identification of DEPs and hierarchical clustering as described above.
SVM model prediction
The expression levels of the significant DEPs in the two cohorts (24 samples in initial analysis and the 68 samples in verification analysis) were used as the eigenvalues for the e1071 SVM package [Citation17]. Datasets (n = 92) were randomly divided into training set (n = 65) and independent testing set (n = 27) according to the probability ratio of 7:3. The ROC curve was then used to evaluate the classification and prediction efficiency of the data. The default parameters for the SVM model were: Kernel function: sigmoid kernel; Cross: 10-fold cross validation.
Survival analysis
Clinical information and mRNA-seq data for CRC were downloaded from the UCSC database (http://xena.ucsc.edu/), which contains the TCGA data. A total of 435 samples with survival information were obtained. The expression levels of the candidate genes corresponding to the DEPs were screened with the TCGA data, and then divided into high expression and low expression groups based on the optimal cutoff obtained by surv_cutpoint function. Survival analysis was determined using the K-M survival curve with a log-rank test, and P < 0.05 was used as the threshold.
Results
Data preprocessing
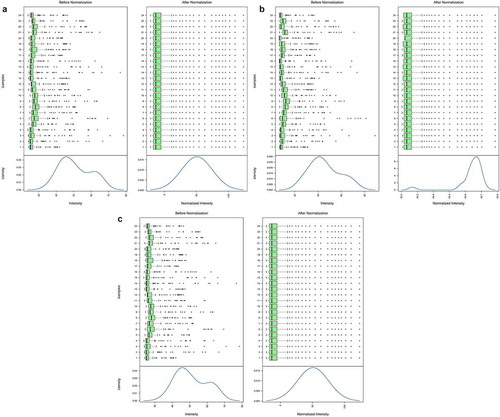
After the data was normalized with the quantile method, the internal structure of the data changed dramatically. The cumulative strength, average cumulative strength, and average net cumulative strength before and after data preprocessing are shown in .
Figure 1. Results before and after data preprocessing for cumulative strength (a), average cumulative strength (b) and average net cumulative strength (c). The upper part of each picture is a boxplot and the lower part is the data density distribution curve. The intensity represents the protein expression value; Density represents the percentage of the total number
DEG screening and hierarchical clustering
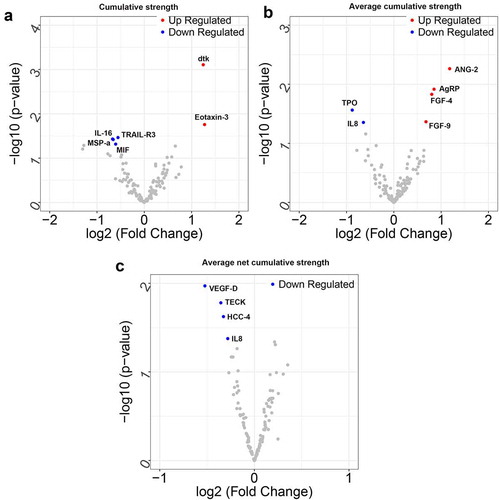
Following data preprocessing, 6 DEPs (2 up-regulated and 4 down-regulated) were screened based on the cumulative intensity index (). Similarly, 6 DEPs (4 up-regulated and 2 down-regulated), and 4 DEPs (all down-regulated) were identified based on the mean cumulative strength and net cumulative strength, respectively. A volcano plot of the DEPs is shown in .
Table 1. The DEPs under the cumulative intensity index, the mean cumulative strength and mean net cumulative strength
Figure 2. The volcano plot of differentially expressed proteins (DEPs) based on the cumulative strength (a), average cumulative strength (b) and average net cumulative strength (c). The blue dots represent down-regulated DEPs, and the red dots represent up-regulated DEPs. The x-coordinate is log2FC, and the y-coordinate is log10 (P value)
Functional enrichment analysis of the DEPs
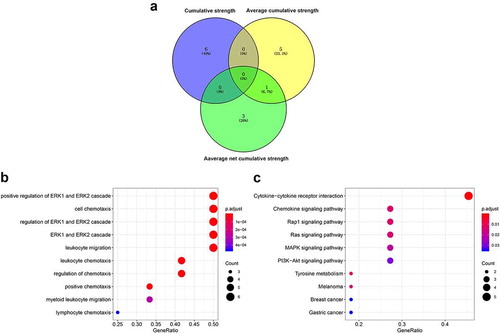
All the DEPs obtained from the three indexes were chosen for subsequent analysis. As illustrated in ), there were 15 DEPs. Only IL-8 was differentially expressed by both the average cumulative strength and average net cumulative strength. GO analysis results showed that the positive regulation of the ERK1 and ERK2 cascades, cell chemotaxis, and leukocyte migration were significantly enriched with DEPs (). Furthermore, KEGG pathway analysis suggested cytokines-cytokine receptor interaction, and the chemokine signaling, Rap1, Ras, and MAPK signaling pathways were the main pathways enriched in DEPs ().
Figure 3. Functional enrichment of the differentially expressed proteins (DEPs). (a) Venn diagram of the DEPs; (b) Bubble diagram of Gene ontology (GO) terms enriched with DEPs. (c) Bubble diagram of pathways enriched in DEPs. The horizontal axis is the GeneRatio: the higher the ratio, the greater the fraction of proteins which are DEPs. The size of the dot is the number of DEPs. As the color changes from blue to red, the smaller the p value and the higher the corresponding significance
PPI network construction and drug-gene interactions
To further predict the potential interactions of these DEPs, the PPI network was constructed based on the STRING database. As shown in ), the network consisted of 12 nodes and 12 gene interaction pairs, of which, IL-8, CCL16, and TYRO3 had the highest degree of connectivity.
Figure 4. Protein-Protein Interaction (PPI) and drug-gene interaction networks. (a) Down-regulated DEPs are green and up-regulated DEPs are red. A blue edge shows that the protein was identified by a difference in average net cumulative strength, an orange edge shows that the protein was identified by a difference in mean cumulative strength, and a purple edge shows that the protein was identified by a difference in cumulative strength. The thickness of the line corresponds to the score of the interaction relationship with thicker lines corresponding to higher interaction scores. (b) The red oval is the key gene, the yellow rectangle is the drug, and the arrow points to the inhibitory effect
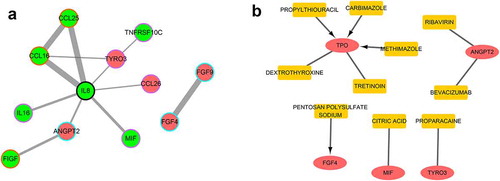
Based on the DGIdb, there were 10 drug-gene interaction pairs, including 5 genes and 10 drugs (). Of note, four drug-gene interactions had inhibitory effects.
Verification analysis of key DEPs with a custom chip
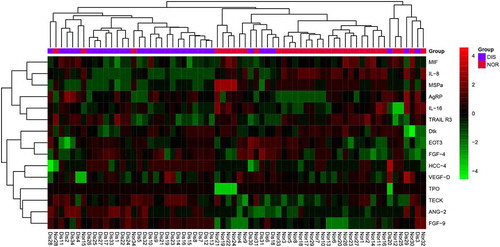
To further validate our findings, a custom chip was constructed with 15 DEPs and used to screen 34 CRC and 34 normal control samples. As illustrated in , the heatmap suggested that the CRC samples and the normal controls could be distinguished based on the DEPs. Of the DEPs on the custom chip, the up-regulated DEPs: IL-8, MSPa and MIF, as well as the down-regulated DEPs: FGF-9, ANG-2 and AgRP were the key DEPs with statistical difference. Moreover, these key DEPs would be used as potential diagnostic markers or drug targets in SVM model prediction.
Figure 5. Bidirectional clustering heatmap. The color in the top column represents the grouping. Red is the healthy group and purple is the disease group. In the heat map, green represents low expression and red represents high expression
SVM model prediction and survival analysis
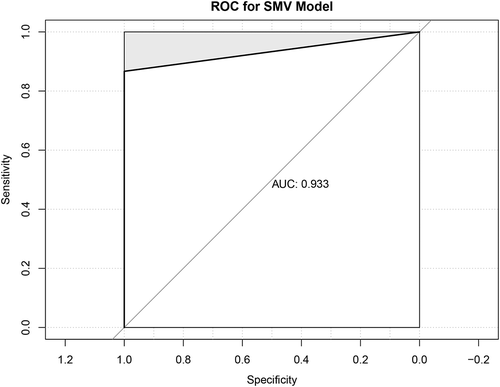
As illustrated in , the ROC curve of the SVM model indicated that the 6 key DEPs could effectively distinguish the CRC samples from the normal controls, with the AUC of 0.933.
Figure 6. Receiver operating characteristic (ROC) curve for SVM model. The horizontal axis represents specificity, the vertical axis sensitivity, and the point is the cutoff threshold
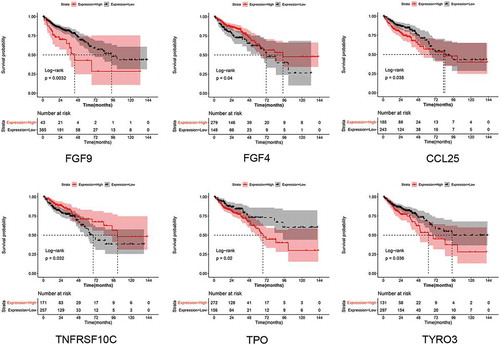
Furthermore, survival analysis was performed for all DEPs in our study to investigate their prognostic value. Among the 15 DEPs, six DEPs were found to be associated with prognosis, including FGF-9, TPO, TNFRSF10C (also named TRAIL R3), TYRO3 (also named Dtk), CCL25 (also named TECK) and FGF-4 (). It could be seen that patients with high expression of FGF-4 and TNFRSF10C had favorable prognosis than that of low expression. While patients with high expression of FGF-9, CCL25, TPO and TYRO3 had worse outcomes than that of low expression. The results suggested that these DEPs might be predictor for CRC prognosis. Of which, FGF-9 was a key DEPs in SVM diagnostic model, suggesting both diagnostic and prognostic value of FGF-9 in CRC.
Figure 7. Results for survival analysis. Survival curves shows the prognostic value of FGF9, TPO, TNFRSF10C, TYRO3, CCL25 and FGF4. Red represents the high-risk group and black the low-risk group
Discussion
Over the last decade, an increasing number of studies have been reported which investigate potential factors involved in the diagnosis and prognosis of CRC [Citation18–20], but none is completely reliable. A protein profile can provide useful information on the pathology and molecular mechanism of a disease or disorder. In the present study, we investigated a series of DEPs by calculating the indexes of cumulative strength, average cumulative strength, and average net cumulative strength, and pathways associated with CRC development. A custom chip with the 6 key DEPs, IL-8, MSPa, MIF, FGF-9, ANG-2 and AgRP could effectively distinguished the CRC samples from normal controls. Survival analysis showed that high expression of FGF-9 was associated with worse prognosis than that of low expression. In addition, survival analysis also showed TPO, TRAIL R3, Dtk, TECK and FGF-4 were also showed prognostic value in CRC.
Tumorigenesis is a complex process that involves the interaction of various genes, proteins and signaling pathways. In the case of CRC, an increasing number of signaling pathways have been reported to play important roles in the progression of the disease [Citation21,Citation22]. Therefore, an analysis of the pathways related to CRC could provide a mechanistic basis for the progression of the disease. In the present study, we found that the DEPs were mainly found in cytokines-cytokine receptor interaction, and the chemokine signaling, Rap1, Ras and MAPK signaling pathways. Qi et al [Citation21] also found that the differentially expressed genes in GSE113513 (obtained from GEO database) mainly found in the chemokine signaling pathway and cytokine-cytokine receptor interaction. A previous study suggested that the CXC family of chemokines could serve as prognostic or predictive biomarkers and possible drug targets for CRC [Citation23]. Our data also revealed candidate proteins associated with the chemokine signaling pathway, which might provide a basis for research into the role of the DEPs in the formation of CRC. The RAS family has been reported to be among the most commonly mutated genes in all human malignancies including CRC. Coelho et al [Citation24] suggested that oncogenic RAS signaling could promotes tumor immunoresistance by stabilizing PD-L1 mRNA. In CRC, the Ras signaling pathway is activated through different genes [Citation25,Citation26].
Additionally, we constructed the PPI and drug-gene interaction networks. Of the PPI network nodes, IL-8 was as the key protein with the highest degree of connectivity. It has been reported that polymorphisms in IL-8 are related to the risk of colorectal adenoma [Citation27], and that IL-8 regulates cancer stem cell like properties in colon cells through induction of O-GlcNAc modification [Citation28]. Our study revealed the interaction between IL-8 and other proteins such as CCL16, CCL25, TYRO3, CCL26, MIF, ANGPT2, and IL-16, which has not previously been reported. TPO was the key drug target for the drug-gene interactions. TPO expression has previously been found to be significantly different in CRC and healthy controls [Citation29]. However, research on whether it could be a drug target is still limited, and our study provides novel potential therapeutic targets for CRC treatment.
Through the prognostic analysis of the DEPs, we found that FGF-4 could be a predictor of prognosis for patients with CRC. Currently, FGF-4 is widely studied in hepatocellular carcinoma, breast cancer, oral squamous cell carcinoma and esophageal squamous cell carcinoma. Huang [Citation30] found that FGF-4 expression in combination with clinical stage could be used as a relatively accurate predictor of the 5-year probability of death and recurrence in ESCC patients. However, the role of FGF-4 in CRC development is still unclear. Moreover, in our study, the DEPs IL-8, MSPa, MIF, FGF-9, ANG-2 and AgRP could be used as potential diagnostic markers with an AUC of 0.933 based on the SVM model prediction. Of these proteins, the diagnostic values of MSPa, FGF-9 and AgRP in CRC have not previously been reported. Taken together, our data revealed a set of proteins (DEPs IL-8, MSPa, MIF, FGF-9, ANG-2 and AgRP) used in the panel in serum for distinguishing the CRC patients from normal controls. However, external validation with clinical samples is still required to confirm the diagnostic value of the identified proteins.
In recent year, great efforts had been made to identify biomarkers for the diagnosis of CRC. Circulating tumor DNA (ctDNA) shares primary tumor-specific genetic changes because that it is mainly released by apoptotic or necrotic tumor cells into circulation or actively secreted by circulating tumor cells [Citation31]. Therefore, analysis of ctDNA is considered to have great potential to improve CRC diagnosis. However, there remains certain difficulties. Firstly, ctDNA accounts for only a minority of total circulating DNA which contains abundant cell-free DNA secreted from healthy cells. Secondly, the low concentration and high fragmentation rate of ctDNA in circulation present a great challenge to analysis [Citation32,Citation33]. Machine learning-based diagnosis had shown well classification performance in different diseases [Citation34]. SVM diagnostic model with tumor marker had been reviewed to had potential clinical application value in the diagnosis of cancer, including CRC [Citation35]. Study had reported that the genes screened by SVM model had the ability to accurately distinguish metastatic and non-metastatic CRC samples [Citation36]. Therefore, we speculated that our SVM diagnostic model with the six key DEPs had potential clinical application value in CRC diagnosis.In conclusion, we conducted a bioinformatics analysis of the DEPs between CRC serum and normal control samples. The DEPs: AgRP, ANG-2, Dtk, EOT3, FGF-4, FGF-9, HCC-4, IL-16, IL-8, MIF, MSPa, TECK, TPO, TRAIL R3 and VEGF-D, as well as cytokines-cytokine receptor interaction, and the chemokine signaling, Rap1, Ras, and MAPK signaling pathways, which are enriched in them, may be involved in CRC development. Moreover, the DEPs: IL-8, MSPa, MIF, FGF-9, ANG-2 and AgRP could be potential diagnostic markers. Further survival analysis showed FGF9, TPO, TNFRSF10C, TYRO3, CCL25 and FGF4 could be biomarkers to predict the prognosis of CRC patients. Taken together, these findings have the important clinical significance because they could improve our understanding of the pathogenesis and molecular mechanisms of CRC; moreover, they provide effective tools for the prognosis and diagnosis of CRC. However, further clinical study is still needed to confirm the function of the identified proteins.
Highlights
A series of DEPs was found in CRC.
Pathways associated with DEPs were enriched in CRC.
A series of DEPs related to CRC diagnosis was identified.
Acknowledgments
None.
Disclosure statement
The authors declare that there is no conflict of interest.
References
- Brenner H, Kloor M, Pox CP. Colorectal cancer. Lancet. 2014;383(9927):1490–1502.
- Siegel RL, Miller KD, Fedewa SA, et al. Colorectal cancer statistics, 2017. Ca A Cancer J Clinicians. 2017;67:104–117.
- Siegel R, Naishadham D, Jemal A. Cancer statistics, 2012. Ca Cancer J Clin. 2012;62:10–29.
- Fang YJ, Wu XJ, Zhao Q, et al. Hospital-based colorectal cancer survival trend of different tumor locations from 1960s to 2000s. PloS One. 2013;8:e73528.
- Nakajima J, Iida T, Okumura S, et al. Recent improvement of survival prognosis after pulmonary metastasectomy and advanced chemotherapy for patients with colorectal cancer. Eur J Cardio-thorac Surg. 2017;51:869–873.
- Gonzalez PM, Cruz CM. Colorectal cancer biomarkers: where are we now? Biomed Res Int. 2015;2015:149014.
- Zhang L, Xie F, Tang C, et al. miR-340 suppresses tumor growth and enhances chemosensitivity of colorectal cancer by targeting RLIP76. Eur Rev Med Pharmacol Sci. 2017;21:2875–2886.
- Wulfkuhle J, Liotta L, Petricoin E. Proteomic applications for the early detection of cancer. Nat Rev Cancer. 2003;3(4):267–275.
- Safari-Alighiarloo N, Taghizadeh M, Rezaei-Tavirani M, et al. Protein-protein interaction networks (PPI) and complex diseases. Gastroenterol Hepatol Bed Bench. 2014;7(1):17–31.
- Hara M, Sato M, Takahashi H, et al. Does serum carcinoembryonic antigen elevation in patients with postoperative stage II colorectal cancer indicate recurrence? Comparison with stage III. J Surg Oncol. 2010;102(2):154–157.
- Byström P, Berglund Å, Nygren P, et al. Evaluation of predictive markers for patients with advanced colorectal cancer. Acta Oncol. 2012;51(7):849–859. .
- Smyth G.K. (2005) limma: Linear Models for Microarray Data. In: Gentleman R., Carey V.J., Huber W., Irizarry R.A., Dudoit S. (eds) Bioinformatics and Computational Biology Solutions Using R and Bioconductor. Statistics for Biology and Health. Springer, New York, NY.
- Kanehisa M, Goto S. KEGG: kyoto encyclopaedia of genes and genomes. Nucleic Acids Res. 2000;28:27–30(4).
- Ashburner M, Ball CA, Blake JA, et al. Gene ontology: tool for the unification of biology. Nat Genet. 2000;25(1):25–29. .
- Szklarczyk D, Franceschini A, Kuhn M, et al. The STRING database in 2011: functional interaction networks of proteins, globally integrated and scored. Nucleic Acids Res. 2011;39(Database issue):D561-8. https://pubmed.ncbi.nlm.nih.gov/21045058/.
- Shannon P, Markiel A, Ozier O, et al. Cytoscape: a software environment for integrated models of biomolecular interaction networks. Genome Res. 2003;13:2498–2504.
- Wang Q, Liu X. Screening of feature genes in distinguishing different types of breast cancer using support vector machine. Onco Targets Ther. 2015;8:2311–2317.
- Zou G, Wang R, Wang M. Clinical response and prognostic significance of serum miR-497 expression in colorectal cancer. Cancer Biomarkers. 2019;25(1):11–18.
- Wu X, Wang Y, Wang L, et al. Id-1 expression in colorectal adenocarcinoma tissues and its clinical significance. Rev Assoc Med Bras. 2019;65:404–409.
- Bae S, Park W, Jeong W, et al. Prognostic impact of telomeric repeat-containing RNA expression on long-term oncologic outcomes in colorectal cancer. Medicine (Baltimore). 2019;98(14):e14932.
- Qi Y, Qi H, Liu Z, et al. Bioinformatics analysis of key genes and pathways in colorectal cancer. J Comput Biol. 2019;26:364–375.
- Yu C, Hong H, Zhang S, et al. Identification of key genes and pathways involved in microsatellite instability in colorectal cancer. Mol Med Rep. 2019;19:2065–2076.
- Cabrero-de LHS, Martínez-Balibrea E. CXC family of chemokines as prognostic or predictive biomarkers and possible drug targets in colorectal cancer. World J Gastroenterol. 2018;24:4738–4749.
- Coelho M, De Carné Trécesson S, Zecchin D, et al. Oncogenic RAS signaling promotes tumor immunoresistance by stabilizing PD-L1 mRNA. Immunity. 2017;47(1083–99.e6). DOI:10.1016/j.immuni.2017.11.016.
- Carné TS, Souazé F, Basseville A, et al. BCL-X directly modulates RAS signalling to favour cancer cell stemness. Nat Commun. 2017;8:1123.
- Zhang X, Liu G, Ding L, et al. HOXA3 promotes tumor growth of human colon cancer through activating EGFR/Ras/Raf/MEK/ERK signaling pathway. J Cell Biochem. 2018;119:2864–2874.
- Huang B, Tsilidis K, Smith M, et al. Polymorphisms in genes related to inflammation and obesity and colorectal adenoma risk. Mol Carcinog. 2018;57(10):1278–1288. .
- Shimizu M, Tanaka N. IL-8-induced O-GlcNAc modification via GLUT3 and GFAT regulates cancer stem cell-like properties in colon and lung cancer cells. Oncogene. 2019;38(9):1520–1533.
- Wang H, Wang Y, Pan J, et al. Evaluation of specific fecal protein biochips for the diagnosis of colorectal cancer. World J Gastroenterol. 2014;20:1332–1339.
- Huang J, Song Q, Wang H, et al. Poor prognostic impact of FGF4 amplification in patients with esophageal squamous cell carcinoma. Hum Pathol. 2018;80:210–218.
- Fabišíková K, Behulová RL, Repiska V. Molecular biomarkers in the diagnostic of patients with colorectal cancer. Neuro Endocrinol Lett. 2019;40:215–221.
- Haupts A, Roth W, Hartmann N. [Liquid biopsy in colorectal cancer: an overview of ctDNA analysis in tumour diagnostics]. Pathologe. 2019;40:244–251.
- Osumi H, Shinozaki E, Yamaguchi K, et al. Clinical utility of circulating tumor DNA for colorectal cancer. Cancer Sci. 2019;110:1148–1155.
- Alizadehsani R, Abdar M, Roshanzamir M, et al. Machine learning-based coronary artery disease diagnosis: a comprehensive review. Comput Biol Med. 2019;111:103346.
- Wang H, Huang G. Application of support vector machine in cancer diagnosis. Med Oncol. 2011;28(Suppl 1):S613–8.
- Zhi J, Sun J, Wang Z, et al. Support vector machine classifier for prediction of the metastasis of colorectal cancer. Int J Mol Med. 2018;41:1419–1426.