
ABSTRACT
The tumor suppressor protein p53 is a DNA-binding transcription factor (TF) that, once activated, coordinates the expression of thousands of target genes. Increased p53 binding to gene promoters occurs shortly after p53 activation. Intriguingly, gene transcription exhibits differential kinetics with some genes being induced early (early genes) and others being induced late (late genes). To understand pre-binding factors contributing to the temporal gene regulation by p53, we performed time-course RNA sequencing experiments in human colon cancer cell line HCT116 treated with fluorouracil to identify early and late genes. Published p53 ChIP fragments co-localized with the early or late genes were used to uncover p53 binding sites (BS). We demonstrate that the BS associated with early genes are clustered around gene starts with decreased nucleosome occupancy. DNA analysis shows that these BS are likely exposed on nucleosomal surface if wrapped into nucleosomes, thereby facilitating stable interactions with and fast induction by p53. By contrast, p53 BS associated with late genes are distributed uniformly across the genes with increased nucleosome occupancy. Predicted rotational settings of these BS show limited accessibility. We therefore propose a hypothetical model in which the BS are fully, partially or not accessible to p53 in the nucleosomal context. The partial accessibility of the BS allows subunits of a p53 tetramer to bind, but the resulting p53-DNA complex may not be stable enough to recruit cofactors, which leads to delayed induction. Our work highlights the importance of DNA conformations of p53 BS in gene expression dynamics.
Introduction
In response to DNA damage, the p53 protein is a tumor suppressor stabilized, activated and quickly accumulated in cells. Upon activation, p53 coordinates the expression of thousands of genes, which fulfills important biological functions such as cell cycle arrest, apoptosis and senescence [Citation1]. Different gene expression patterns have been observed in which cell cycle arrest (CCA) genes are induced early whereas apoptotic (Apo) genes are induced relatively late [Citation2]. Intriguingly, this kinetics of induction is not correlated with the kinetics of p53 binding to the regulatory region of its target genes. For example, although increased p53 binding to p21, MDM2 and PIG3 promoters occurs within 2 hours after p53 activation, significant increases in PIG3 transcription do not occur until 15 hours after p53 binding, much later than p21 and MDM2 [Citation3]. It was suggested that additional factors may be needed for the transcription of target genes with delayed induction [Citation3].
Prior research on how p53 selectively activates target genes has proposed several mechanisms. First, the differential affinities of p53 for DNA is considered to be critical for the expression of CCA and Apo genes [Citation4–7]. This is because (a) low-level p53 expression is associated with cell cycle arrest, whereas high-level p53 expression is associated with apoptosis [Citation8], and (b) p53 binding sites (BS) associated with CCA genes (CCA-sites) have relatively higher affinities than the sites associated with Apo genes (Apo-sites) [Citation4]. Second, p53 with specific post-translational modifications, certain cofactors or transcriptional initiation components are required for the expression of several target genes [Citation9–15]. Third, p53 dynamic patterns represent an important factor in determining cellular functions including CCA and senescence [Citation16]. Finally, post-transcriptional events such as mRNA half-lives of p53 target genes appear critical for the differential expression dynamics of target genes [Citation17]. While most studies are focused on the p53 protein itself, its cofactors and post-binding events such as transcriptional machinery, little work has been done on pre-binding factors such as the conformation of p53 BS in the chromatin context.
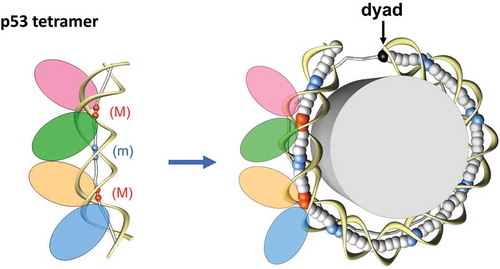
p53 is sequence-specific DNA-binding protein [Citation18]. A typical p53 BS is composed of two palindromic, decameric half sites of the general form RRRCWWGYYY (R = A,G; Y = C,T; W = A,T), separated by 0–14 base pairs (bp) [Citation19,Citation20]. Biochemical and structural studies have shown that p53 DNA-binding domain (p53DBD) binds each decameric half site as a dimer and the two dimers from the two half sites constitute the tetramer (or dimer of dimer) [Citation21–24]. This p53 DNA-binding model is consistent with the observation that p53 functions as a tetramer [Citation25]. The model has been corroborated by crystal structures of a p53 core tetramer bound to DNA [Citation26,Citation27], in which protein-protein and protein-DNA interactions provide a molecular basis for the high cooperativity and kinetic stability of p53DBD binding to DNA. Although no significant DNA bend was observed in the crystal structures, previous studies in solution have illustrated that four subunits of p53DBD can induce substantial DNA bending [Citation28,Citation29], and a structural model was proposed to put four p53DBD on the outer side of the DNA loop, which has implications in the p53 interactions with nucleosomal DNA [Citation30] (). This model was later confirmed by experiments that show p53 can interact with nucleosomal DNA [Citation31–36] and this interaction depends on the rotational setting of p53 BS in the nucleosome [Citation33].
Figure 1. Schematic models for p53-DNA complex (left) and p53-nucleosome complex (right). Left: The p53-DNA complex (30) is shown schematically with four ellipses representing the p53 tetramer bound to a 20-bp DNA fragment (spacer S = 0). The p53 tetramer is laterally positioned on the external side of DNA loop. The DNA axis is represented by sticks and balls. The red balls stand for the centers of the CNNG core motif bent into the major groove (m), and the blue ones for the junction between two half-sites bent into the minor groove (m). Right: The histone octamer is shown as a cylinder and DNA is represented by ribbons (sugar-phosphate backbone) and balls (centers of base pairs). The blue balls indicate the dimeric steps where DNA is bent into the minor groove. For the “posterior” half of nucleosome, the DNA axis is represented by gray sticks. Note that conformation of the DNA fragment bound by p53 tetramer (Left) closely resembles conformation of a 20 bp-long fragment of nucleosomal DNA (Right), in which the center of the fragment is bent into the minor groove (blue balls). The figure is modified from ref. 57
To predict the rotational positioning of nucleosomes, we have developed a computational method based on the sequence-dependent bending anisotropy [Citation37–39]. Specifically, WW (where W is adenine or thymine) dinucleotides preferentially occur at nucleosomal DNA sites that bend into minor grooves and SS (where S is guanine or cytosine) dinucleotides are often found at sites that bend into major grooves [Citation40]. This method has successfully predicted nucleosome locations that were mapped at single base pair resolution, including the ‘601ʹ nucleosome [Citation37,Citation39]. We further applied the method to evaluating the accessibility of CCA- and Apo-sites in nucleosomes and found that CCA-sites tend to be exposed on the nucleosomal surface whereas Apo-sites are likely to be buried inside [Citation41].
Here, we hypothesize that the DNA conformations of p53 BS in a nucleosome play an important role in expression dynamics of genes with fast induction (early genes) and delayed induction (late genes). In this study, we first identified early and late genes using time-course RNA sequencing (RNA-seq) in HCT116 cells treated with the chemotherapeutic drug fluorouracil (5-FU) that damages DNA and activates p53. Then we analyzed p53 BS in published ChIP fragments co-localized with early or late genes and found that the two sets of p53 BS differ in their locations relative to transcription start sites (TSS) of the genes, nucleosome occupancy and predicted rotational settings in nucleosomes. Based on these data, we propose a hypothetical model to account for the observed discrepancy between the kinetics of p53 binding to promoters and the kinetics of induction of p53 target genes.
Material and methods
Cell culture
HCT116 p53 +/+ cells (from GRCF Biorepository & Cell Center of John Hopkins University) were grown in recommended McCoy’s 5a modified media (Life Technologies) with 10% FBS and 1X antibiotic mix. Cells were grown in the media at 37°C with 5% CO2 in 35 mm plates until 70–80% confluence. At 6, 12 or 24 hours prior to RNA extraction, the media was changed and 2 ml of fresh media, along with 5-FU (with final concentration of 375 µM) or 2uL dimethyl sulfoxide (DMSO) were added to the cells (Supplementary Figure S1). The DMSO-treated samples were used as controls because DMSO is the solvent of 5-FU. Non-treatment controls were also set up. For each treatment and each time point, two biological replicates were performed.
RNA extraction and sequencing
RNA was extracted following the instruction of the QIAGEN RNeasy Mini Kit and the QIAshredder (QIAGEN) was used during the RNeasy Kit’s lysis and homogenization stage. The RNA concentration was determined using NanoDrop (Thermo Scientific). The samples were kept in the −80⁰C until they were sent to University of Rochester Genomics Research Center (URGRC) for sequencing. At URGRC, at least 10 uL of the samples with more than 15 ng RNA were used for quality assessment, library construction and sequencing by HiSeq 4000 system following the manufacturer’s instructions. The resulting raw reads were cleaned using Trimmomatic with a cutoff 25 bp for the read size [Citation42].
Quality assessment and genome mapping
FASTQ files from URGRC with adapters removed and reads with small size (< 25 bp) filtered out were further cleaned by FASTX-toolkit with a quality score cutoff of 28. Then, Cutadapt was used to filter out all reads greater than 50bp [Citation43]. The quality of the datasets was assessed by FastQC. Cleaned reads in the FASTQ files were aligned to the human genome assembly hg19 using TopHat with the default setting [Citation44]. The resulting BAM files were sorted by SAM-tools for visualization in the UCSC Genome Browser [Citation45].
Differential gene expression analysis
Two well-known RNA-seq data analysis packages, CuffDiff2 [Citation46] and DESeq2 [Citation47], were used to detect differentially expressed (DE) genes. The two software packages were chosen because they differ in several aspects. First, CuffDiff2 determines differential expression using t-test based on a beta negative binomial model, whereas DESeq2 uses exact tests based on a negative binomial model [Citation48]. Second, CuffDiff2 and DESeq2 have low Spearman correlation values in obtained gene rankings for both mouse and human RNA-seq data [Citation48]. The differences in CuffDiff2 and DESeq2 results prompt us to use both packages to analyze the data, and the DE genes detected by both packages are selected for further analysis.
For CuffDiff2 (version 2.2.1), after the BAM file was produced for each sample, the package was used for differential expression analysis following the pipeline in previous studies [Citation46,Citation49]. Briefly, Cufflinks [Citation49–51] was first run for each sample to produce an individual GTF file and Cuffmerge was used to merge the GTF files into one GTF. Cuffquant was then run for each BAM file and the merged GTF file, which produced a CFX file. Finally, CuffDiff2 was run using each CFX file, with the replicates for each treatment combined under one label, as well as the required merged GTF file was also added for CuffDiff2. The -g option (reference annotation) for Cufflinks and Cuffmerge was used, and the reference genome (hg19) downloaded from iGenomes was formatted as suggested by Cufflinks. Additionally, the -b option (fragmentation biases correction) was used with the provided hg19 genome file, as well as the -u option (multi-read correction), which improves the accuracy weights reads located in different parts of the genome. These options were available for Cufflinks2, Cuffquant2, and CuffDiff2. The labeling and renaming options were used; otherwise, all options were left at default. Once finished, the files produced by CuffDiff2 and the Cuffmerge2 GTF file were downloaded and the results were read into CummRbund. The differentially expressed genes were selected using the getSig and getGenes commands with an alpha value of 0.05. The data associated with the differentially expressed genes were then called using the diffData command, the resulting data frame was divided into files for comparisons of control vs. 5-FU and 5-FU vs. DMSO. The DE genes were selected so that the q-value was less than 0.05. The gene names (gene codes) were associated with the gene_id and saved to the gene differential expression files.
For DESeq2 (version 2_1.24.0), read counts for each gene were calculated using htseq-count [Citation52] using the bam files produced by TopHat and sorted by Samtools [Citation53] by position. Following the tutorial of the Bioconductor package DESeq2, a sample table was produced (Supplementary Table S1). All of the genes with total counts for all samples less than 10 were excluded. The differential expression analyses were performed for control versus 5-FU samples, as well as for DMSO versus 5-FU samples. The resulting genes with the adjusted p-value (padj) less than 0.05 were selected.
For the quality assessment of the gene expression data determined by CuffDiff2 (FPKM values) and DESeq2 (normalized count values), the FPKM values or the counts with a gene total of less than 10 were removed and transformed by log10(value+1). To check the outliers of expression values, scatterplots were created for the values determined by CuffDiff2 (Supplementary Figure S2) and DESeq2 (Supplementary Figure S3) using the R packages ggplot2 and GGally. The line of best fit was added using the geom_smooth function with the “lm” method (Supplementary Figure S2 and S3).
To better compare the expression values determined by CuffDiff2 and DESeq2, we used the count values of CuffDiff2 to compare with the count values of HTSeq (DESeq2). The count values of all genes in each sample were log transformed and used to make the density plots using the geom_density function in the ggplot2 package. The similarity between the density plot of CuffDiff2 (Supplementary Figure 4A) and HTSeq/DESeq2 (Supplementary Figure 4B) reveals that expression values determined by the two software packages are comparable.
Nucleosome occupancy analysis
Two paired-end MNase-seq data from HCT116 cells [Citation54,Citation55] were downloaded from European Nucleotide Archive (ENA) (GSM2916043, GSM2916044, and GSM2391842). The fastq data were aligned to the human genome hg19 with Bowtie2 using the sensitive option. The resulting SAM files were converted into BAM files and sorted using Samtools. The sorted BAM files were filtered for 100–200 bp fragments and 145–150 bp fragments using the FilterBam command in fgbio. The resulting BAM files of all samples were merged using the merge command in Samtools. Normalization of nucleosome occupancy across the genome was performed as described [Citation56]. Briefly, for each nucleotide position in the genome, the total number of nucleosomal DNA sequences covering this position was divided by the average number of nucleosomal sequences per base pair across the genome. The resulting value was assigned to this position as the normalized nucleosome occupancy value. The normalized value at each position was smoothed with a 60-bp window.
P53 binding site identification and analysis
p53 BS in ChIP fragments were found by PWM-20 [Citation57], a position weight matrix approach we developed based on experimentally validated p53 response elements (REs). With PWM-20, each BS was assigned a score. If multiple BS were identified in a ChIP fragment, the BS with the highest score was selected. DNA sequences of 550 bp in length flanking the selected p53 BS were retrieved from the human genome hg19. The W/S scheme [Citation38,Citation39] was used to predict the nucleosome rotational positioning on the fragments. The resulting W/S scores were averaged on each position and “symmetrized” across the center of the p53 BS (i.e. position 0).
Genomic data visualization
A set of “high confidence” p53 ChIP sites (named as “Bao_data”) based on 16 published cistromes in cancer cell lines [Citation58] were co-localized with DE genes identified by RNA-seq experiments. The Bao_data were downloaded as a BED file, which were then converted from hg18 to hg19 using LiftOver [Citation59]. Three ChIP-seq datasets obtained in HCT116 cells with 5-FU treatments [Citation60–62] were separately downloaded. In particular, ChIP-seq data from Wei et al. [Citation60] were downloaded from the hg17 genome on the UCSC as a BED file that was subsequently converted from hg17 to hg19 using LiftOver. Moreover, FASTQ files for both Sanchez et al. [Citation62] (GSE58528) and Botcheva et al. [Citation61] (GSE58714) were downloaded from ENA. These data were aligned to hg19 using Bowtie2 with the sensitive setting. The resulting SAM files were turned into BAM files using Samtools.
Both the ChIP-seq and RNA-seq data are in the BAM format. The BAM files were read into R via Rsamtools and the coverage computed by GenomicAlignments [Citation63] and the coverage exported as a BigWig file via rtracklayer [Citation64]. The BigWig files were then uploaded to CyVerse. The track, hub and genome files were made following the directions as detailed by UCSC genome browser. The hub was uploaded to the Track Hubs interface in the UCSC Genome Browser. In addition, the “add custom track” interface was used to add the BED files for the Bao et al. [Citation58] and Wei et al. [Citation60] data to the UCSC Genome Browser. The height of each viewing track for our RNA-seq dataset was kept equal so the difference in height between different samples could be seen.
CummeRbund was used to produce a matrix of the FPKM values for the genes co-detected by DESeq2 and CuffDiff2. The matrix was then log transformed and scaled. The scaled values were then taken and ordered from hr6 to hr24 from the highest value to the lowest value. The resulting matrix was used to produce a heatmap by pheatmap with columns annotated by color for treatment hours and treatment type and rows annotated by color for genes at the hr6, hr12 and hr24 time points.
Results and discussion
Determination of early and late genes
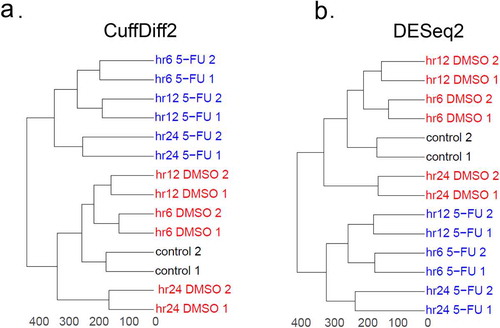
To identify early or late genes, we probed gene expression levels using RNA-seq in HCT116 cells treated with 5-FU for 6 hours (hr6), 12 hours (hr12), and 24 hours (hr24), along with cells treated with DMSO at the same time points as control conditions because DMSO is the solvent of 5-FU. Since p53 acts as an activator not a repressor [Citation65], only up-regulated DE genes identified by both DESeq2 and CuffDiff2 were selected for analysis (see Methods). We found that, as expected, 5-FU-treated samples were different from DMSO-treated samples using both CuffDiff2 ()) and DESeq2 ()). The similarity in the topology of both dendrograms suggests that the changes in gene expression between 5-FU- and DMSO-treated samples are successfully captured by both methods ()).
Figure 2. Comparison of RNA-seq samples analyzed by CuffDiff2 and DESeq2. Dendrograms were created for RNA-seq samples analyzed by CuffDiff2 (a) and DESeq2 (b). Gene expression levels represented by FPKM values for CuffDiff2 and read counts for DESeq2 were used for analysis. Two biological replicates were generated for the samples with no treatment (i.e. control, shown in black), as well as for samples treated with DMSO (red) or 5-FU (blue) at different time points (i.e. hr6, hr12 and hr24). The FPKM matrix and the count matrix for both CuffDiff2 and DESeq2 were scaled and then the Euclidean distances were calculated using the dist function in R. Hierarchical clustering analysis was made by the hclust function with the ward.D2 option. Based on the clustering results, the dendrograms were made using the ggdendro and ggplot2
DE genes were analyzed at three steps. First, at each time point, DE genes were determined for 5-FU versus DMSO samples, as well as for 5-FU versus non-treatment control by CuffDiff2 or DESeq2 (Supplementary Figures S5 and S6). The overlap between these two comparisons renders DE genes specific to 5-FU treatment (i.e. 5-FU-specific genes). As a result, CuffDiff2 identified 511, 766 and 1,496 5-FU-specific genes at the hr6, hr12 and hr24 time points, respectively (Supplementary Table S2-S4). By contrast, DESeq2 found 831, 1,558, and 2,234 5-FU-specific genes at the same three time points (Supplementary Table S5-S7).
Second, at each time point, 5-FU-specific genes identified by CuffDiff2 were compared with those identified by DESeq2 (Supplementary Figure S7). As a result, 391, 649 and 1,212 were found by both methods at the hr6, hr12 and hr24 time points, respectively (Supplementary Tables S8-S10). Note that in these collections, genes in the hr6 set may also appear in the hr12 sets or hr24 sets.
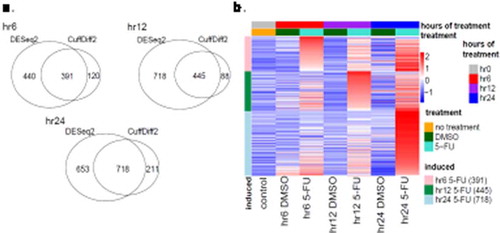
Third, to identify genes specific to a time point, the genes in the hr6 set were removed from the hr12 and hr24 sets. Similarly, the genes in the hr12 set were removed from the hr24 set (Supplementary Figure S8). As a result, 391, 445, and 718 were identified specifically at hr6, hr12 and hr24 time points respectively (Supplementary Tables S8, S11 and S12, )). For the sake of simplicity, the three gene sets are called hr6-, 12 hr- and hr24-specific genes, respectively. Temporal expression levels of these genes were shown in a color-coded heatmap ()), clearly demonstrating distinctive gene expression patterns between the three time points.
Figure 3. Temporal gene expression at specific time points. (a) Venn diagrams demonstrating time-specific DE genes detected by DESeq2 or CuffDiff2 (see Methods) at the hr6, hr12 and hr24 timepoints. The hr12 genes refer to the genes induced only at the hr12 time-point and do not appear at the hr6 time-point, whereas the hr24 genes include the genes only induced at the hr24 time-point and do not appear in the hr6 or hr12 time-point. The numbers of genes that are co-detected by DESeq2 and CuffDiff2 are shown in the intersection of the Venn diagrams. (b) Heatmap of DE genes co-detected by DESeq2 and CuffDiff2 at the hr6 (red), hr12 (purple) and hr24 (blue) time-points. The expression levels of these genes in the control (i.e. hr0 or no treatment), DMSO – and 5-FU-treated samples are color-coded
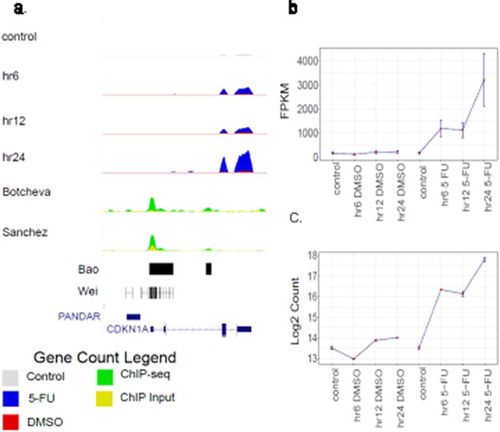
Visual inspection was performed on representative DE genes at the hr6-, hr12- and hr24-specific genes. For example, the CDKN1A/p21 gene is significantly induced by 5-FU at hr6 compared to the controls (DMSO-treated sample and non-treatment sample), illustrated in a UCSC genome browser view ()) and in the plots of expression levels ()). These results confirm that the CDKN1A/p21 gene belongs to the hr6 set. Similarly, the SFN gene is significantly induced at the hr12 time point (Supplementary Figure S9) and the APAF1 gene is significantly induced at the hr24 time point (Supplementary Figure S10).
Figure 4. Time-course expression of the CDKN1A/p21 gene in HCT116 cells. (a) A UCSC Genome Browser view that highlights the time-course gene expression in HCT116 cells. The session shows the CDKN1A/p21 locus. Four tracks displayed at the top show RNA-seq datasets at four time-points (control/hr0, hr6, hr12 and hr24). The tracks represent the average expression level of two biological replicates. The control/hr0 track is shown in gray, whereas for the hr6, hr12 and hr24 tracks, the DMSO (in red) and 5-FU (in blue) data are superimposed. Four tracks at the bottom shows published ChIP-seq datasets (58, 60–62), with the tracks named by the first author of the papers. Two ChIP-seq datasets (Sanchez_data and Botchev_data) show both ChIP data (green) and input data (yellow). The other two ChIP-seq datasets (Wei_data and Bao_data) only show peak locations. Other features plotted include CDKN1A genes (dark blue) and the promoter of CDKN1A antisense DNA damage activated RNA (PANDAR). CDKN1A/p21 gene expression levels were measured in FPKM values (b) by CuffDiff2 and log2 count values (c) by DESeq2 under DMSO and 5-FU treatment. In each treatment type, expression levels were measured at hr0/control, hr6, hr12 and hr24 time-points. The error bars show the standard deviation of the expression values in two biological replicates
Detailed analysis reveals that hr24-specific genes express significantly different from hr6-specific and hr12-specific genes for the following reasons. First, the number of hr24-specific genes (i.e. 718 genes) is much higher than hr6-specific (i.e. 391) and hr12-specific (i.e. 445) genes (Supplementary Figure S8). Second, the expression levels of hr24-specific genes are much higher than those of hr6- and hr12-specific genes (, Supplementary Figure S9, S10). Third, hierarchical clustering analyses fail to group hr24-specific genes with hr6- and hr12-specific genes (Supplementary Figure S11).
Thus, our results clearly demonstrate two distinct sets of genes in response to p53 activation by 5-FU: one is a small set containing 391 genes that are induced early (e.g. 6 hours after 5-FU treatment), and the other is a large set containing 718 genes that are induced late (e.g. 24 hours after 5-FU treatment). For the sake of simplicity, the hr6-specific genes are referred as “early genes”, whereas the hr24-specific genes are referred as “late genes”.
Identification of p53 BS associated with early and late genes
To identify the early or late genes associated with p53 ChIP fragments, we co-localized the genes with three ChIP-seq data obtained from HCT116 cells treated with 5-FU [Citation60–62]. We found that 112 ChIP fragments occur between 5 kb upstream of TSS and 5 kb downstream of transcription termination sites (TTS) of 391 early genes, accounting for 28.6% of the early genes (Supplementary Table S16). By contrast, 133 ChIP fragments occur in the same region of 718 late genes, accounting for 18.5% of the late genes (Supplementary Table S17). The average fraction ~23% (of 28.6% and 18.5%) is in agreement with a recent time-course ChIP study in which ~25% of DE genes grouped in five clusters are co-localized with ChIP fragments [Citation17].
These ChIP fragments were used to identify p53 BS (~20 bp in length) with a computational method developed by us (57) based on a position weight matrix (PWM) formalism ()). This method scores DNA fragments based on their similarity to the consensus p53 BS RRRCWWGYYY-(s)-RRRCWWGYYY, where R is A or G, Y is T or C, W is A or T, and s is spacer with 0–14 bp in length. That is, the BS similar to the consensus sequence, the higher the PWM score. A cutoff of 70% suggested in our previous study [Citation57] was used. If multiple p53 BS with the score 70% or higher are identified in the same ChIP fragment, the BS with the highest score is selected. As a result, we found ~80% of the ChIP fragments contain at least one p53 BS, representing 89 and 113 BS in the early and late gene sets, respectively (Supplementary Table S13), which is consistent with previous studies [Citation17,Citation41].
Figure 5. Analysis of p53 BS associated with early (hr6) or late (hr24) genes. (a) Overall research plan for the p53 BS identified in ChIP fragments. The ChIP fragments were taken from our previous study (ref. 58) and only those located within 5kb from the TSS of early or late genes were used for analysis. The PWM-based tool we developed before (ref. 57) was used to predict p53 BS in the ChIP fragments. If multiple p53 BS were found in a ChIP fragment, the BS with the highest PWM score was selected. (b) Locations of p53 BS relative to ChIP fragment centers associated with early (red) or late (blue) genes. (c) Locations of p53 BS relative to the TSS of early (red) or late (blue) genes
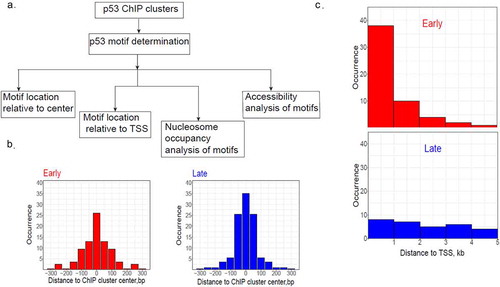
As expected, identified p53 BS tend to occur close to the centers of p53 ChIP fragments for both early and late genes ()), consistent with our earlier findings (56). We also found that most BS associated with early or late genes have no spacer (i.e. spacer length is 0) between two half-sites (Supplementary Figure S12), which is in agreement with known p53 REs [Citation20,Citation41]. Moreover, no difference is observed in PWM-20 scores between the p53 BS associated with early or late genes (Supplementary Figure S13). This result is important because it shows no significant difference in binding affinities of p53 BS associated with early or late genes. Thus, DNA binding affinities may not play a major role in regulating temporal gene expression by p53.
Interestingly, a striking difference is seen in genomic locations of the two sets of p53 BS. That is, most BS associated with early genes are located close to TSS (i.e. within 1 kb from the TSS) of the genes, but this tendency is not observed in their counterparts in late genes ()). Since chromatin around TSS is characterized with nucleosome depletion [Citation66], we hypothesize that the p53 BS associated with early genes have distinctive chromatin environments compared with those associated with late genes.
Distinctive nucleosome occupancy around p53 BS associated with early and late genes
To test this hypothesis, we used two paired-end MNase-seq datasets from HCT116 cells [Citation54,Citation55] and calculated normalized nucleosome occupancy around the BS (see Methods). Nucleosomal DNA fragments with the lengths between 145 bp and 150 bp were used for analysis, which are close to the lengths of DNA fragments (145–147 bp) co-crystalized with histones [Citation67–69]. Since the cells were not treated with 5-FU, the MNase-seq datasets provide information about chromatin organization around p53 BS before p53 is activated. This nucleosome organization and DNA conformations of p53 BS in the nucleosomal DNA belong to pre-binding factors that may have an impact on kinetics of transcription of target genes after p53 activation (see below).
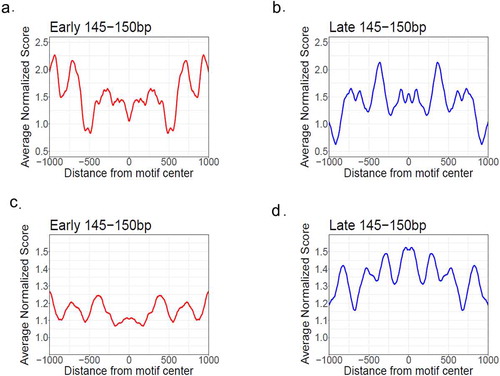
We have the following observations. First, both sets of p53 BS are not located in the nucleosome-free regions because the normalized nucleosome occupancy over the BS is above the genome average 1.0, consistent with earliest studies showing p53 is able to interact with nucleosomal DNA [Citation31–36]. Second, the BS with early genes have a clear and distinctive pattern in nucleosome occupancy from their counterparts with late genes (). That is, nucleosome occupancy profiles exhibit a trough around BS associated with early genes (position 0 in ), in contrast to a peak around BS associated with late genes () and (d)). This difference is preserved in longer nucleosomal DNA fragments, e.g. between 100 bp and 200 bp (Supplementary Figure S14). These results indicate that p53 BS associated with early genes tend to occur in nucleosome-depleted regions. The relatively low nucleosome occupancy around the early-gene BS is consistent with their proximity to TSS ()) where nucleosomes are usually depleted [Citation66].
Figure 6. Nucleosome occupancy profiles around p53 BS associated with early (red) and late (blue) genes. Nucleosome occupancy was calculated from paired-end MNase-seq data from Wang et al. (A-B, ref. 54) and Bacon et al. (C-D, ref. 55). Only the nucleosomal DNA fragments with the lengths between 145 and 150 bp were used for analysis. The nucleosome occupancy values were normalized with respect to the average value of the genome and smoothed with a 60-bp window. The averaged nucleosome occupancy values were symmetrized with respect to the centers of p53 BS
Opposite nucleosome rotational settings for p53 BS associated with early and late genes
To investigate if the two sets of p53 BS differ in the accessibility in nucleosomal DNA, we adopted a structural rule established earlier [Citation41] that discriminates between accessible and inaccessible p53 sites in a nucleosome. Briefly, a p53 site is “exposed” to the surface and accessible to p53 if the center of the site is out of phase (i.e. located 10 n + 5 bp, where n = 0, 1, 2, … from the dyad) with the nucleosome dyad (Supplementary Figure S15A). By contrast, a p53 site is inaccessible if the center of the site is in phase (i.e. located 10 n bp from the dyad) with the nucleosome dyad (Supplementary Figure S15B). The accessibility of p53 sites in nucleosomal DNA has been predicted by the W/S scheme [Citation41] that successfully captures the rotational positioning of nucleosomes [Citation39].
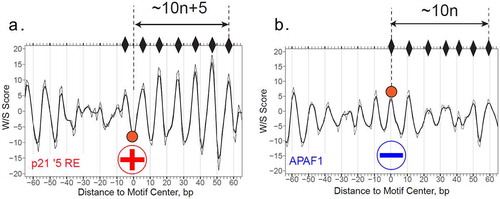
We first checked the W/S profile of the p53 REs in p21 gene (5ʹ RE) [Citation20,Citation31] ()) and APAF1 gene [Citation20] ()), which are the representative early and late gene, respectively. A prominent difference between the two profiles is that peaks are in different phases with the site center (position 0). In particular, for p21, the distances between the site center and neighboring W/S score peaks are 10 n + 5 bp, which is a clear out-of-phase pattern. This suggests that the p21 5′ RE is likely to be “exposed” on the nucleosomal surface. The same accessible W/S pattern is also observed for other p53 BS in the p21 promoter (data not shown). By contrast, the distances between the center of the APAF1 RE and neighboring W/S score peaks are ∼10 n bp (Supplementary Figure S15B), indicating that the RE center is in phase with the dyad positions. It suggests that the APAF1 RE is likely to be inaccessible when wrapped into a nucleosome.
Figure 7. Structure-aided prediction of p53 BS accessibility in nucleosomal DNA. (a and b) W/S score profiles for DNA sequences containing two p53 REs, p21 5′ RE (a) and APAF1 RE (b). The W/S scores are calculated as described in the “Materials and Methods” section. The centers of the REs (position 0) are denoted by filled circles. The peaks of the profiles corresponding to the favorable positions of nucleosome dyads are indicated by diamonds. The distances between the RE centers and the dyad positions are presented (in base pairs). The raw data are shown in thin lines and the three-point running averages are in thick lines. The circled “+” signs and “−” signs indicate that the p21 5′ RE is accessible for p53 binding, while the APAF1 RE is inaccessible to p53 (when p53 RE is embedded in a nucleosome)
Previous studies have shown that the p21 gene undergoes fast kinetics of induction, whereas the PIG3 gene experiences delayed kinetics of induction [Citation3]. We further examined if the PIG3 RE adopts a W/S pattern similar to the APAF1 RE. It has been shown that p53 interacts with a pentanucleotide microsatellite sequence within the PIG3 promoter (TGYCC)n where Y = C or T [Citation70]. We identified a 20-bp p53 BS (TGTCCTGCCCTGCCCTGCCC) located in the center of the microsatellite sequence (Supplementary Figure S16A). A 300-bp genomic DNA fragment with this BS at the center was used to generate the W/S profile. It has been shown that the distances between the center of this BS and neighboring peaks are 10 n, where n = 0, 1, 2, … (Supplementary Figure S16B). This pattern is similar to that of the APAF1 RE ()), suggesting that the PIG3 BS is likely to be buried inside when wrapped into a nucleosome.
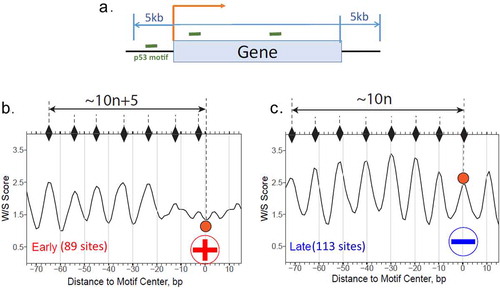
To determine if the BS associated with the early and late genes as a group show different W/S patterns similar to p21 and APAF1 REs (), we first checked the BS between 5 kb upstream of TSS and 5 kb downstream of TTS ()), the BS with early genes illustrate a clear out-of-phase pattern with predicted dyad positions ()). By contrast, the BS with late genes are in-phase with the predicted dyad positions ()). The observed patterns are also hold for p53 BS in other genomic regions such as 5 kb, 10 kb and 20 kb from TSS (data not shown). Our work shows that p53 BS in early genes in general are more likely to be in the rotational frames that promote exposure in nucleosomes, presenting themselves on the nucleosomal surface for direct p53 binding. By contrast, the BS with late genes tend to have the opposite orientation, in which p53 binding is strongly inhibited.
Figure 8. Profiles of the W/S scores for p53 BS associated with early (b) or late (c) genes. The p53 BS between 5 kb upstream of TSS and 5 kb downstream of TTS of early (89 sites) or late (113 sites) genes (a) were used for analysis. W/S scores for the DNA sequences flanking the BS were averaged for each position and the resulting average scores were symmetrized with respect to the BS center (position 0). The notations are the same as in Figure 7. All p53 BS are selected for the analysis (both with spacer S = 0 and S > 0)
To further show that p53 BS associated with early genes have more accessibility than those associated with late genes, we re-analyzed recently published data in which p53-DNA binding across the human genome were measured by ChIP-seq after 1, 2.5, 4, 5, and 7.5 hours of γ-irradiation treatment [Citation17]. We first selected ChIP sites within 5 kb from TSS of early and late genes (Supplementary Table S18 and S19). Then we calculated the ChIP/DNA ratio of these sites and found that, on average, the ratio for early genes is higher than that for late genes over all time points (Supplementary Figure S17). These results indicate that the amount of p53-bound DNA is higher in early gene promoters than that in late gene promoters, consistent with our findings that the p53 BS associated with early genes are more accessible to p53 than their counterparts associated with late genes.
Discussion
Distinctive p53 engagement with DNA across the human genome
It is well established that p53 is able to interact with nucleosomal DNA [Citation31–36]. Specifically, Espinosa and Emerson [Citation31] compared the binding affinities of p53 to its binding sites in the p21 genes (5ʹ and 3ʹ sites) in free DNA versus in chromatin, and found that p53 binds to nucleosomal DNA with a higher affinity than to free DNA. Later, Lidor et al. [Citation32] showed that p53 binds preferentially to genomic regions with high intrinsic nucleosome affinities. Two groups have shown that p53 can bind its sites near the center (i.e. dyad) [Citation33] or close to the ends (~30 bp away from one end) of a nucleosome [Citation34]. Consistent with the latter, recent studies clarified a very specific mode of p53 interaction with the nucleosome, at the nucleosome entry/exit [Citation71].
Beyond the level of mono-nucleosomes, p53 BS have been mapped across the human genome [Citation58,Citation60–62]. Consistent with Sammons et al. [Citation35], the current work shows that the p53 BS have different subclasses. The p53 BS associated with early genes, which are close to TSS, tend to have relatively low nucleosome occupancy, compared to the ones associated with late genes. Interestingly, examination of binding affinities of the two sets of p53 BS reveals no significant difference (Supplementary Figure S13), suggesting that factors other than p53 binding affinities may play an important role in differentiating early genes from late genes (see below).
In relation to CCA- and Apo-sites
In our previous work, we found that CCA- and Apo-sites may have distinct accessibility to p53 in the nucleosomal context [Citation41]. That is, when wrapped into a nucleosome, CCA-sites tend to be exposed on the nucleosomal surface and this is because DNA sequences around CCA-sites preset the sites in an “exposed” conformation in nucleosomal DNA. By contrast, Apo-sites are more likely to be buried inside a nucleosome because of their neighboring sequences.
The current study found that several Apo genes belong to early genes, e.g. BBC3 and BAX (Supplementary Figure S6). It seems to be contradicting that Apo genes are induced early while their p53 BS are predicted to be inaccessible. However, it is noteworthy that p53 REs in BBC3 and BAX promoters are very close to TSS [Citation20]. Specifically, the BBC3 RE is located −126 to −145 bp upstream of TSS (position 0), whereas the BAX RE is located 354 to 373 bp downstream of TSS. Since nucleosomes are in general depleted in human promoters [Citation66], it is plausible that no or few nucleosomes occur around the Apo-sites, which makes these REs accessible and may lead to the fast induction of these Apo genes.
5-FU-induced DNA damage leads to p53 activation, which in turn induces genes to halt cell cycle and repair DNA damage. To find out if early genes are more important for early response to DNA damage, we used DAVID [Citation72,Citation73] to examine the pathways enriched in 391 early and 718 late genes. It was found that early genes, not late genes, are enriched in p53-related functions such as “DNA damage response” (Supplementary Figure S18). This result indicates that early genes play an important role in responding DNA damage, further supporting the functional differences between early and late genes.
A new scheme for temporal gene regulation by p53
For the genes that are directly regulated by p53 binding, the relationship between p53 binding and subsequent gene expression is not expected to be linear because many other binding processes are involved at the same regions and interfere with each other and with p53 binding to the nucleosome [Citation74]. To elucidate the possible mechanisms underlying the nonlinearity, we have identified early and late genes in response to p53 activation using RNA-seq experiments, detected p53 BS in ChIP fragments close to the genes, analyzed nucleosome occupancy around the BS, and predicted the accessibility of the BS when wrapped into a nucleosome. Our results suggest that DNA sequences flanking the BS encode distinct chromatin environments as well as nucleosome positioning patterns, which may contribute to differential kinetics of induction of the genes. As such, we propose a model for temporal gene regulation by p53 (). This model is consistent with in vitro [Citation31] and in vivo [Citation31,Citation32,Citation34,Citation35] data showing that p53 is able to interact with nucleosomal DNA.
Figure 9. A schematic diagram for the role of nucleosomes in temporal gene regulation by p53. For early genes, p53 binding BS are likely located in nucleosome-depleted regions or embedded in the nucleosome in a rotational setting allowing its exposure. In either case, the BS are well exposed and readily targeted by p53, thereby promoting a rapid induction of the genes. By contrast, for late genes, p53 BS tend to occur in nucleosome-enriched regions and be wrapped within a nucleosome, which are either partial or not accessible. Additional events (such as nucleosome remodeling) are required to expose these sites; this may lead to a “relatively slow” kinetics of induction of the genes
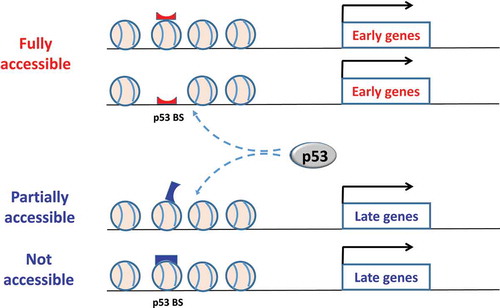
For early genes, p53 BS tend to occur in the vicinity of TSS ()) and exhibit a local nucleosome depletion ()). This is in accordance with observed nucleosome depletion around human promoters [Citation75] and around p53 binding sites upon activation [Citation30]. Our analysis shows that the normalized nucleosome occupancy around these BS is ~1.0, close to the genome average ()), suggesting two possible scenarios in chromatin. The first scenario is that the BS are located in nucleosome-free regions, and they are readily bound by p53 in a cooperative manner as shown in crystal structures [Citation26,Citation27]. The second scenario is that the BS are wrapped into nucleosomes, and our work indicates that the BS tend to be exposed on the nucleosomal surface ()). In either case, the flanking DNA around the BS is organized in such a way that the BS are presented to p53 for stable interaction, which is consistent with “fast” kinetics of induction of early genes in the chromatin context ().
By contrast, p53 BS associated with late genes are widespread in terms of distances to TSS ()) and are characterized with high nucleosome occupancy ()), indicating that they are highly likely to be embedded in nucleosomes. Our analysis indicates that these BS are likely closed when wrapped into a nucleosome with limited accessibility to p53 ()). Because nucleosomes are highly dynamic, governed by an interplay of histone composition, histone post-translational modifications, nucleosome occupancy and positioning [Citation76], the BS may become partially accessible at certain time. The partial accessibility of the BS in the nucleosome still allows subunits of p53 tetramer (e.g. a dimer) to bind, which has been shown as a feature of pioneer TFs [Citation77] that include p53 [Citation78]. However, a p53 dimer binds to a p53 half site for a far shorter period of time compared to a p53 tetramer binding to a full consensus site [Citation26], consistent with an earlier study showing that a p53 tetramer has a 6-fold greater binding affinity than a dimer [Citation79]. Although the interaction between p53 subunits and nucleosomal DNA can be detected by ChIP-seq experiments, the resulting p53-DNA complex on a nucleosome may be not stable enough to recruit cofactors. Additional events such as chromatin remodeling may be required to expose the sites, which leads to delayed kinetics of induction of target genes (). Thus, our model in part explains why sometimes p53 binding to regulatory regions is not correlated with mRNA expression of p53 target genes [Citation3].
In summary, our model sheds new light on the role of nucleosomal p53 BS in temporal gene regulation. Based on this model, flanking DNA sequences are critical to orient p53 BS in different rotational settings in the nucleosome. This can affect the accessibility of the BS in a nucleosome, which in turn may lead to differential kinetics of induction of their associated genes. Our findings provide a new perspective to the understanding of the complicated gene regulatory network of p53 in the context of chromatin.
Supplemental Material
Download MS Word (3.7 MB)Acknowledgments
The authors would like to acknowledge Victor B. Zhurkin (NCI/NIH) for a stimulating discussion, members of University of Rochester Genomic Research Center for help on library preparation and RNA sequencing, as well as members of RIT Research Computing for computing support.
Availability of data and materials
All sequencing data for RNA-seq experiments have been deposited in NCBI’s Gene Expression Omnibus and are accessible through GEO Series accession number GSE157300.
Disclosure statement
The authors declare that they have no conflicts of interest.
Supplementary material
Supplemental data for this article can be accessed here.
Additional information
Funding
References
- Vogelstein B, Lane D, Levine AJ. Surfing the p53 network. Nature. 2000;408(6810):307–310.
- Zhao R, Gish K, Murphy M, et al. Analysis of p53-regulated gene expression patterns using oligonucleotide arrays. Genes Dev. 2000;14(8):981–993.
- Szak ST, Mays D, Pietenpol JA. Kinetics of p53 binding to promoter sites in vivo. Mol Cell Biol. 2001;21(10):3375–3386.
- Weinberg RL, Veprintsev DB, Bycroft M, et al. Comparative binding of p53 to its promoter and DNA recognition elements. J Mol Biol. 2005;348(3):589–596.
- Qian H, Wang T, Naumovski L, et al. Groups of p53 target genes involved in specific p53 downstream effects cluster into different classes of DNA binding sites. Oncogene. 2002;21(51):7901–7911.
- Kracikova M, Akiri G, George A, et al. A threshold mechanism mediates p53 cell fate decision between growth arrest and apoptosis. Cell Death Differ. 2013;20(4):576–588.
- Murray-Zmijewski F, Slee EA, Lu X. A complex barcode underlies the heterogeneous response of p53 to stress. Nat Rev Mol Cell Biol. 2008;9:702–712.
- Chen X, Ko LJ, Jayaraman L, et al. p53 levels, functional domains, and DNA damage determine the extent of the apoptotic response of tumor cells.. Genes Dev. 1996;10(19):2438–2451.
- Flores ER, Tsai KY, Crowley D, et al. p63 and p73 are required for p53-dependent apoptosis in response to DNA damage. Nature. 2002;416(6880):560–564. .
- Samuels-Lev Y, O’Connor DJ, Bergamaschi D, et al. ASPP proteins specifically stimulate the apoptotic function of p53. Mol Cell. 2001;8:781–794.
- Oda K, Arakawa T, Tanaka T, et al. p53AIP1, a potential mediator of p53-dependent apoptosis, and its regulation by Ser-46-phosphorylated p53. Cell. 2000;102:849–862.
- Smeenk L, Van Heeringen SJ, Koeppel M, et al. Role of p53 serine 46 in p53 target gene regulation. PLoS One. 2011;6(3):e17574. .
- Sykes SM, Mellert HS, Holbert MA, et al. Acetylation of the p53 DNA-binding domain regulates apoptosis induction. Mol Cell. 2006;24:841–851.
- Espinosa JM, Verdun RE, Emerson BM. p53 functions through stress- and promoter-specific recruitment of transcription initiation components before and after DNA damage. Mol Cell. 2003;12(4):1015–1027.
- Sullivan KD, Galbraith MD, Andrysik Z, et al. Mechanisms of transcriptional regulation by p53. Cell Death Differ. 2018;25(1):133–143.
- Purvis JE, Karhohs KW, Mock C, et al. p53 dynamics control cell fate. Science. 2012;336(6087):1440–1444.
- Hafner A, Stewart-Ornstein J, Purvis JE, et al. p53 pulses lead to distinct patterns of gene expression albeit similar DNA-binding dynamics. Nat Struct Mol Biol. 2017;24(10):840–847.
- Levine AJ. p53, the cellular gatekeeper for growth and division. Cell. 1997;88(3):323–331.
- El-Deiry WS, Kern SE, Pietenpol JA, et al. Definition of a consensus binding site for p53. Nat Genet. 1992;1(45–9). DOI:10.1038/ng0492-45
- Riley T, Sontag E, Chen P, et al. Transcriptional control of human p53-regulated genes. Nat Rev Mol Cell Biol. 2008;9(5):402–412.
- Ho WC, Fitzgerald MX, Marmorstein R. Structure of the p53 core domain dimer bound to DNA. J Biol Chem. 2006;281(29):20494–20502.
- Kitayner M, Rozenberg H, Kessler N, et al. Structural basis of DNA recognition by p53 tetramers. Mol Cell. 2006;22(6):741–753. .
- Klein C, Planker E, Diercks T, et al. NMR spectroscopy reveals the solution dimerization interface of p53 core domains bound to their consensus DNA. J Biol Chem. 2001;276(52):49020–49027. .
- Rippin TM, Freund SM, Veprintsev DB, et al. Recognition of DNA by p53 core domain and location of intermolecular contacts of cooperative binding. J Mol Biol. 2002;319:351–358.
- Friedman PN, Chen X, Bargonetti J, et al. The p53 protein is an unusually shaped tetramer that binds directly to DNA. Proc Natl Acad Sci USA. 1993;90:3319–3323.
- Malecka KA, Ho WC, Marmorstein R. Crystal structure of a p53 core tetramer bound to DNA. Oncogene. 2009;28:325–333.
- Chen Y, Dey R, Chen L. Crystal structure of the p53 core domain bound to a full consensus site as a self-assembled tetramer. Structure. 2010;18(2):246–256.
- Nagaich AK, Appella E, Harrington RE. DNA bending is essential for the site-specific recognition of DNA response elements by the DNA binding domain of the tumor suppressor protein p53. J Biol Chem. 1997;272(23):14842–14849.
- Nagaich AK, Zhurkin VB, Durell SR, et al. p53-induced DNA bending and twisting: p53 tetramer binds on the outer side of a DNA loop and increases DNA twisting. Proc Natl Acad Sci USA. 1999;96(5):1875–1880.
- Durell SR, Jernigan RL, Appella E, et al. DNA bending induced by tetrameric binding of the p53 tumor suppressor protein: steric constraints on conformation. In: Sarma RH, Sarma MH, editors. Structure, motion, interaction and expression of biological macromolecules. New York: Adenine Press; 1998. p. 277–296.
- Espinosa JM, Emerson BM. Transcriptional regulation by p53 through intrinsic DNA/chromatin binding and site-directed cofactor recruitment. Mol Cell. 2001;8:57–69.
- Lidor NE, Field Y, Lubling Y, et al. p53 binds preferentially to genomic regions with high DNA-encoded nucleosome occupancy. Genome Res. 2010;20(10):1361–1368.
- Sahu G, Wang D, Chen CB, et al. p53 binding to nucleosomal DNA depends on the rotational positioning of DNA response element. J Biol Chem. 2010;285(2):1321–1332. .
- Laptenko O, Beckerman R, Freulich E, et al. p53 binding to nucleosomes within the p21 promoter in vivo leads to nucleosome loss and transcriptional activation. Proc Natl Acad Sci USA. 2011;108(26):10385–10390.
- Sammons MA, Zhu J, Drake A, et al. TP53 engagement with the genome occurs in distinct local chromatin environments via pioneer factor activity. Genome Res. 2015;25(2):179–188.
- Yu X, Buck MJ. Defining TP53 pioneering capabilities with competitive nucleosome binding assays. Genome Res. 2019;29(1):107–115.
- Cui F, Zhurkin VB. Structure-based analysis of DNA sequence patterns guiding nucleosome positioning in vitro. J Biomol Struct Dyn. 2010;27(6):821–841.
- Alharbi BA, Alshammari TH, Felton NL, et al. nuMap: a web platform for accurate prediction of nucleosome positioning. Genomics Proteomics Bioinformatics. 2014;12(5):249–253.
- Cui F, Chen L, LoVerso PR, et al. Prediction of nucleosome rotational positioning in yeast and human genomes based on sequence-dependent DNA anisotropy. BMC Bioinformatics. 2014;15(1):313.
- Satchwell SC, Drew HR, Travers AA. Sequence periodicities in chicken nucleosome core DNA. J Mol Biol. 1986;191(4):659–675.
- Cui F, Zhurkin VB. Rotational positioning of nucleosomes facilitates selective binding of p53 to response elements associated with cell cycle arrest. Nucleic Acids Res. 2014;42(2):836–847.
- Bolger AM, Lohse M, Usadel B. Trimmomatic: a flexible trimmer for Illumina sequence data. Bioinformatics. 2014;30(15):2114–2120.
- Martin M. CUTADAPT removes adapter sequences from high-throughput sequencing reads. EMBnet J. 2011;17:10–12.
- Trapnell C, Pachter L, Salzberg SL. TopHat: discovering splice junctions with RNA-Seq. Bioinformatics. 2009;25(9):1105–1111.
- Kent WJ, Sugnet CW, Furey TS, et al. The human genome browser at UCSC. Genome Res. 2002;12(6):996–1006. .
- Trapnell C, Hendrickson DG, Sauvageau M, et al. Differential analysis of gene regulation at transcript resolution with RNA-Seq. Nat Biotechnol. 2013;31(1):46–53.
- Love MI, Huber W, Anders S. Moderated estimation of fold change and dispersion for RNA-Seq data with DESeq2. Genome Biol. 2014;15(12):550.
- Seyednasrollah F, Laiho A, Elo LL. Comparison of software packages for detecting differential expression in RNA-seq studies. Brief Bioinform. 2013;16:59–70.
- Trapnell C, Williams BA, Pertea G, et al. Transcript assembly and quantification by RNA-Seq reveals unannotated transcripts and isoform switching during cell differentiation. Nat Biotechnol. 2010;28(5):511–515. .
- Roberts A, Pimentel H, Trapnell C, et al. Identification of novel transcripts in annotated genomes using RNA-Seq. Bioinformatics. 2011;27(17):2325–2329.
- Roberts A, Trapnell C, Donaghey J, et al. Improving RNA-Seq expression estimates by correcting for fragment bias. Genome Biol. 2011;12(3):R22.
- Anders S, Pyl PT, Huber W. HTSeq—A Python framework to work with high-throughput sequencing data. Bioinformatics. 2015;31:166–169.
- Li H, Handsaker B, Wysoker A, et al. The sequence alignment/map format and SAMtools. Bioinformatics. 2009;25(16):2078–2079. .
- Wang HY, Long QY, Tang SB, et al. Histone demethylase KDM3A is required for enhancer activation of hippo target genes in colorectal cancer. Nucleic Acids Res. 2019;47:2349–2364.
- Bacon CW, Challa A, Hyder U, et al. KAP1 is a chromatin reader that couples steps of RNA polymerase II transcription to sustain oncogenic programs. Mol Cell. 2020;78(6):1133–1151. .
- Cui F, Cole HA, Clark DJ, et al. Transcriptional activation of yeast genes disrupts intragenic nucleosome phasing. Nucleic Acids Res. 2012;40(21):10753–10764.
- Cui F, Sirotin MV, Zhurkin VB. Impact of Alu repeats on the evolution of human p53 binding sites. Biol Direct. 2011;6:2.
- Bao F, LoVerso PR, Fish JN, et al. p53 binding sites in normal and cancer cells are characterized by distinct chromatin context. Cell Cycle. 2017;16:2073–2085.
- Hinrichs AS, Karolchik D, Baertsch R, et al. The UCSC Genome Browser Database: update 2006. Nucleic Acids Res. 2006;34( Database issue):D590–8. .
- Wei C, Wu Q, Vega VB, et al. A global map of p53 transcription-factor binding sites in the human genome. Cell. 2006;124(1):207–219. .
- Botcheva K, McCorkle SR. Cell context dependent p53 genome-wide binding patterns and enrichment at repeats. PLoS One. 2014;9:e113492.
- Sanchez Y, Segura V, Marin-Bejar O, et al. Genome-wide analysis of the human p53 transcriptional network unveils a lncRNA tumour suppressor signature. Nat Commun. 2014;5(1):5812. .
- Lawrence M, Huber W, Pagès H, et al. Software for computing and annotating genomic ranges. PLoS Comput Biol. 2013;9(8):e1003118. .
- Lawrence M, Gentleman R, Carey V. rtracklayer: an R package for interfacing with genome browsers. Bioinformatics. 2009;25(14):1841–1842.
- Fischer M, Steiner L, Engeland K. The transcription factor p53: not a repressor, solely an activator. Cell Cycle. 2014;13(19):3037–3058.
- Ozsolak F, Song JS, Liu XS, et al. High-throughput mapping of the chromatin structure of human promoters. Nat Biotechnol. 2007;25(2):244–248.
- Luger K, Mader AW, Richmond RK, et al. Crystal structure of the nucleosome core particle at 2.8 Å resolution. Nature. 1997;389(6648):251–260.
- Davey CA, Sargent DF, Luger K, et al. Solvent mediated interactions in the structure of the nucleosome core particle at 1.9Å resolution. J Mol Biol. 2002;319(5):1097–1113.
- Ong MS, Richmond TJ, Davey CA. DNA stretching and extreme kinking in the nucleosome core. J Mol Biol. 2007;368:1067–1074.
- Contente A, Dittmer A, Koch MC, et al. A polymorphic microsatellite that mediates induction of PIG3 by p53. Nat Genet. 2002;30:315–320.
- Nishimura M, Arimura Y, Nozawa K, et al. Linker DNA and histone contributions in nucleosome binding by p53. J Biochem. 2020;168:669–675.
- Huang DW, Sherman BT, Lempicki RA. Systematic and integrative analysis of large gene lists using DAVID bioinformatics resources. Nat Protoc. 2009;4:44–57.
- Huang DW, Sherman BT, Lempicki RA. Bioinformatics enrichment tools: paths toward the comprehensive functional analysis of large gene lists. Nucleic Acids Res. 2009;37:1–13.
- Teif VB, Rippe K. Nucleosome mediated crosstalk between transcription factors at eukaryotic enhancers. Phys Biol. 2011;8:044001.
- Valouev A, Johnson SM, Boyd S, et al. Determinants of nucleosome organization in primary human cells. Nature. 2011;474(7352):516–520.
- Lai WKM, Pugh BF. Understanding nucleosome dynamics and their links to gene expression and DNA replication. Nat Rev Mol Cell Biol. 2017;18:548–562.
- Soufi A, Garcia MF, Jaroszewicz A, et al. Pioneer transcription factors target partial DNA motifs on nucleosomes to initiate reprogramming. Cell. 2015;161(3):555–568.
- Iwafuchi-Doi M, Zaret KS. Pioneer transcription factors in cell reprogramming. Genes Dev. 2014;28:2679–2692.
- Weinberg RL, Veprintsev DB, Fersht AR. Cooperative binding of tetrameric p53 to DNA. J Mol Biol. 2004;341(5):1145–1159.