
ABSTRACT
Myocardial infarction (MI) is a major atherosclerotic cardiovascular disease which represents a leading cause of death worldwide. Kruppel-like factor 5 (KLF5) is a member of the kruppel-like transcription factor family which has been reported with pro-apoptotic functions in myocardial cells. This work focuses on the function of KLF5 in the pathogenesis of MI and the molecules involved. A mouse model with MI was established. Hypoxia/reoxygenation (H/R)-treated H9C2 cells were applied for in vitro experiments. A KLF5-specific inhibitor ML264 was administrated in cell and animal models. ML264 significantly reduced apoptosis, expression of fibrosis-related markers, reactive oxygen species in the H/R-treated H9C2 cells, and it reduced myocardial injury, infarct size, apoptosis and fibrosis in the myocardial tissues in model mice through specific downregulation of KLF5. A microRNA (miRNA) microarray analysis was performed, which suggested miR-27a as the most upregulated miRNA in the H/R-treated cells after ML264 treatment. miR-27a mimic reduced apoptosis and fibrosis in H/R-treated cells, while miR-27a inhibition blocked the protective roles of ML264. The integrated bioinformatic analyses and luciferase assays confirmed glutamine fructose-6-phosphate transaminase 2 (GFPT2) mRNA as a target of miR-27a. Overexpression of GFPT2 counteracted the protective functions of miR-27a against MI through the activation of the TGF-β/Smad2/3 signaling pathway. To conclude, this study evidenced that KLF5 possibly induces cell and tissue damage in MI through downregulation of miR-27a and the subsequent activation of GFPT2/TGF-β/Smad2/3 axis. This study may offer novel thoughts into MI treatment.
1. Introduction
Myocardial infarction (MI) is a one of the major atherosclerotic cardiovascular diseases (CVD) and a leading cause of death across the globe [Citation1]. Complications of acute MI involve a wide range of long-term mechanical, ischemic, dysrhythmic, and inflammatory processes that are correlated with significantly elevated morbidity and mortality [Citation2]. Myocardial ischemia caused by an imbalance between oxygen demand and supply is the initial step of MI development, followed by acute myocardial injury with detection of a rise and/or fall of cardiac troponin (cTn) values and different degrees of myocardial dysfunction [Citation3]. The onset of acute MI after inadequate oxygen supply can be initiated as little as in 20 min, followed by complete cardiomyocyte necrosis in a few hours, and the prolonged ischemia may further lead to impairment in heart contractility due to the poor proliferation ability of the myocardial cells [Citation4]. Identifying novel strategies to enhance regeneration of myocardial cells and control inflammation and fibrosis is of great significance.
A recent research reported that kruppel-like factor 5 (KLF5) is responsible for H2O2-induced ischemic injuries by inducing myocardial cell apoptosis [Citation5]. KLF5 is a member of the Kruppel-like transcription factor family, in which the members are involved in a wide range of biological processes including embryonic development, cellular proliferation and differentiation, stress response, and so forth [Citation6]. The exact functions of KLF5 in myocardial injuries following MI remain largely unknown. In this paper, a KLF5-specific inhibitor, ML264, was administrated to see the relevance of KLF-5 inhibition to MI progression. As a transcription factor, KLF5 regulates diverse cellular processes by controlling gene expression transcriptionally [Citation7]. Growing evidence has acknowledged the key functions of microRNAs (miRNAs) in cardiac cell death and regeneration following MI [Citation4]. miRNAs represent a class of small regulatory RNAs which control crucial cellular processes involved in the development of CVD and the pathophysiological consequences of MI [Citation8]. Thereby, we conducted a miRNA microarray analysis and confirmed that miR-27a was the most differentially expressed miRNAs in cells treated with ML264. Intriguingly, miR-27a has been suggested to be responsible for bilobalide’s protection against oxygen-glucose-deprivation-induced damage in H9C2 cells [Citation9]. This aroused our interests in its role in MI. Here, our integrated bioinformatic analyses identified glutamine fructose-6-phosphate transaminase 2 (GFPT2) as a potential gene of miR-27a. GFPT catalyzes the formation of glucosamine-6-phosphate from glucosamine and fructose-6-phosphate and therefore is involved in metabolic diseases such as diabetes [Citation10]. The role of GFPT2 in ischemia-induced injury has not been concerned yet. Taken together, this study hypothesized that downregulation of KLF5 may enhance the transcription of miR-27a, which further suppresses GFPT2 expression to alleviate progression of MI. A mouse model with MI and hypoxia/reoxygenation (H/R)-treated H9C2 cells were established to validate the hypothesis in vivo and in vitro.
2. Materials and methods
2.1. Establishment of a mouse model with MI
Eighty male C57/BL6J mice (6–8 wk old, 20 ± 2 g) were purchased from Model Animal Research Center of Nanjing University (Nanjing, Jiangsu, China). Usage of animals was ratified and supervised by the Ethics Committee of China-Japan Union Hospital of Jilin University. All experimental procedures were conducted in line with the ethical guidelines of the National Institute of Health (NIH Publications 85–23, 1996). Great efforts were made to minimize the number and suffering of animals.
Mice were anaesthetized by ketamine hydrochloride (50 mg/kg) and diazepam (2.5 mg/kg). MI in mouse was induced through ligating the left anterior descending (LAD) artery as previously reported [Citation11]. Expression of KLF5, miR-27a and GFPT2 in the infarct area in mice was determined. The mice were randomly allocated into MI group (n = 70) and sham group (n = 10). To evaluate the role of KLF5 in MI progression, 70 MI mice were further allocated into MI group (n = 10), Dulbecco’s phosphate-buffered saline (DPBS, n = 10), ML264 group (n = 10), ML264 + antagomiR (n = 10), ML264 + antagomiR NC group (n = 10), ML264 + lentiviral vector (Lv)-GFPT2 group (n = 10) and ML264 + Lv-negative control (NC) group (n = 10) after corresponding treatments. DPBS, ML264 (25 mg/kg, #HY-19,994, MedChemExpress, Monmouth Junction, NJ, USA), miR-27a antagomiR (20 nmol), Lv -GFPT (20 nmol) and the control vectors (all purchased from Sangon Biotech Co., Ltd., Shanghai, China) were administrated into mice through intramyocardial injection using a 29-caliber Hamilton injector instantly following LAD ligation. Mice in the sham group only had the chest opened. Survived animals were subjected to echocardiogram at the first and the fourth week after surgery, respectively. Next, the mice were euthanized through overdose of pentobarbital sodium (150 mg/kg). The heart tissues of animals were collected for further experiments including reverse transcription quantitative polymerase chain reaction (RT-qPCR), western blot analysis, and histological staining/labeling. The death rate of animals in each group was as follows: sham group (0/10), MI group (2/10), DPBS group (1/10), ML264 group (1/10), ML264 + antagomiR NC group (0/10), ML264 + antagomiR-27a group (1/10), ML264 + Lv-NC group (1/10), ML264 + Lv-GFPT2 group (1/10). The number of animals in each group were supplemented to 10.
2.2. Echocardiogram
Before euthanasia, mice in each group were anesthetized using ketamine hydrochloride (50 mg/kg) and diazepam (2.5 mg/kg), fixed on an experimental table and connected to an Echocardiogram System (Sequoia Acuson, 15-MHz linear transducer; Siemens, Erlangen, Germany). The M curve was measured along the long axis of the papillary muscle at the left ventricle level. The following variables including left ventricular end-systolic diameter (LVESD), left ventricular end-diastolic diameter (LVEDD), left ventricular end-systolic volume (LVESV), and left ventricular end-diastolic volume (LVEDV) were evaluated within three consecutive cardiac cycles, and the average values were calculated. Left ventricular ejection fraction (LVEF) and left ventricular fractional shortening (LVFS) values were calculated as the following formulas: LVEF = (LVEDV-LVESV)/LVEDV × 100%; LVFS = (LVEDD-LVESD)/LVEDD × 100%. LVEF and LVFS were considered as the diameters for myocardial functions. Three independent experiments were performed and the average value was acquired.
2.3. Evaluation of MI in mice
During MI, lactate dehydrogenase (LDH), cTnT, cTnI and creatine kinase-MB (CK-MB) can be detected in the arteries. After detection of the myocardial function, the arterial blood in mice was extracted from the abdominal aorta. In detail, the mice were anesthetized again and placed on an anatomy plate and had the limbs stretched and fixed. Then, the skin was disinfected, and the skin and peritoneum were cut open from upper pubis to lower sternum along the ventral midline. After that, two transections were conducted from both ends to the paries ventralis. Then, the abdominal cavity was fully exposed and the abdominal aorta was found. The aorta was punctured at 1–3 mm away (at the centripetal end) from the bifurcation. A 23 G (0.6 mm) puncture needle was used and punctured toward the centripetal end at an angle of 30° and a depth of 5 mm. When the resistance decreased, the front end of the anatomy plate (where the mouse head located) was instantly lifted up for 30–50 mm to allow the arterial blood flowing into the tubes. After that, the blood samples were centrifuged at 3,000 g for 10 min, and then the activity of CK-MB (#H197, Jiancheng Bioengineering Institute, Nanjing, Jiangsu, China) and LDH (#BC0685, Solarbio Science & Technology Co., Ltd., Beijing, China) in mouse serum was determined using an automatic biochemical analyzer (AU-2700, Olympus Optical Co., Ltd, Tokyo, Japan). The levels of cTnT and cTnI were detected using ELISA kits of cTnT (#E019-1, Jiancheng Bioengineering Institute) and cTnI microplate (#E023-1, Jiancheng Bioengineering Institute) using a microplate reader (MULTISKAN MK3, Thermo Fisher Scientific Inc., Waltham, MA, USA). Three independent experiments were performed.
2.4. Hematoxylin and eosin (HE) staining
After euthanasia, the myocardial tissues of mice were rinsed and fixed in 4% paraformaldehyde for at least 48 h. Next, the tissue samples were dehydrated in an ascending series of ethanol, embedded in paraffin, and cut into sections for HE staining. The images after staining were developed on a Cell Imaging System (IncuCyte™S3 ZOOM, Essen BioScience, Ann Arbor, MI, USA).
2.5. Masson’s trichrome staining
The myocardial tissues were successively fixed in 10% formaldehyde for 24 h, decalcified, dehydrated, permeabilized by xylene, embedded in paraffin, and then cut into sections (5 μm). Nuclei were stained using the heidenhain’s iron hematoxylin (#H3136, Sigma-Aldrich Chemical Company, St Louis, MO, USA) for 10 min. After three washes by distilled water, the sections were stained with 0.7% Masson-Ponceau-Fuchsin Acid Staining Reagent (#B6008, Sigma-Aldrich) for 10 min. Next, the samples were rinsed in 2% glacial acetic acid and differentiated in phosphomolybdic acid for 4 min, and then stained with 2% aniline blue dyeing solution (#B8563, Sigma-Aldrich). Thereafter, the samples were dehydrated in ethanol, permeabilized by xylene and fixed by neutral resin, and then observed under an optical microscope.
2.6. Terminal deoxynucleotidyl transferase (TdT)-mediated dUTP nick end labeling (TUNEL)
Cell apoptosis in myocardial tissues was examined using a TUNEL kit (#G7360, Promega, Madison, Wisconsin, USA). Paraffin-embedded tissue sections were dewaxed in xylene, dehydrated in series of alcohol, and treated with proteinase K working solution at 21–37°C for 15–30 min. The TUNEL reaction mixture was prepared. After drying, each slide was loaded with 50 µL TUNEL reaction mixture, sealed, and placed in a humidified incubator (37°C) without light exposure for 60 min. Then, the tissue sections were added with 50 µL converter-POD and cultured at 37°C in a humidified and dark condition for 30 min. Thereafter, the sections were further filled with 50–100 µL 2,4-diaminobutyric acid (DAB) for 10 min of reaction at 15–25°C. After that, the sections were counterstained with hematoxylin or methyl green for seconds, rinsed with running water, dehydrated in alcohol, permeabilized by xylene, and fixed with neutral resin. After addition of phosphate buffer saline (PBS) or glycerol, the cells were counted and photographed under an optical microscope (200–500 cells). The number of TUNEL-positive cells was counted, and the apoptosis rate was calculated as the formula: apoptosis rate = number of TUNEL-positive cells/number of total cells × 100%. Three independent experiments were performed and the average value was recorded.
2.7. Immunohistochemistry staining
Paraffin-embedded myocardial tissue sections were dewaxed, dehydrated in alcohol, and incubated with warm deionized water containing 0.3% H2O2 for 30 min to block the activity of endogenous peroxidase. After that, the sections were blocked with serum and incubated with the primary antibodies against Vimentin (#10,366-1-AP, Proteintech, Group, Inc, Wuhan, Hubei, China) and α-smooth muscle actin (α- SMA, #19,245, Cell Signaling Technology, Beverly, MA, USA) at 4°C overnight. On the second day, the sections were further incubated with horseradish peroxidase (HRP)-labeled immunoglobulin G (IgG, #G-21,234, Invitrogen, Inc., Carlsbad, CA, USA) at 37°C for 1 h. Next, the sections were added with biotin and developed with DAB for 10 min. Thereafter, the sections were counter-stained with hematoxylin, washed, dehydrated and permeabilized, and finally observed under the microscope.
2.8. 2,3,5-triphenyltetrazolium chloride (TTC) staining
Infarct size in mouse myocardial tissues was determined by TTC staining (#17,779, Sigma-Aldrich). After euthanasia, the myocardial tissues were collected and cut into 1-mm sections. The sections were soaked in 2% TTC solution at 37°C for 30 min. The infarct area and total area of each myocardial tissue section were measured using a Leica Image System (DMI6000B, Leica Microsystems, Wetzlar). Then, the infarct size was quantified as follows: infarct size = (infarct area/total area) × 100%.
2.9. Cell culture and H/R treatment
A myocardial cell line H9C2 was acquired from the Cell Bank of Chinese Academy of Sciences (Shanghai, China). Cells were treated with KLF5 inhibitor ML264, miR-27a mimic/inhibitor (Sangon, Shanghai, China) and Lv-GFPT2, respectively. After 48 h, exponentially growing cells were subjected to H/R treatment. In short, the culture medium was first placed in an anaerobic condition for 1 h. Then, the cells were cultured in a hypoxic condition (1%O2, 5%CO2 and 94%N2) in serum- and glucose-free DMEM/F12-Medium for 48 h, followed by 3 h of reoxygenation treatment (20% O2, 5% CO2, and 74% N2) in normal medium.
2.10. Detection of reactive oxygen species (ROS)
The concentration of ROS was detected using the CellROX green reagent (C10444, Molecular Probes, Life Technologies, USA) and MitoSOX Red (1,771,410, Molecular Probes, Life Technologies, Gaithersburg, MD, USA). After treatment, samples were washed with prewarmed PBS and stained with 5 μM CellROX green for 30 min or 5 μM MitoSOX Red for 10 min.
2.11. 5-ethynyl-2'-deoxyuridine (EdU) labeling assay
Cell proliferation was measured using a Cell-LightTM EdU proliferation detection kit (#C10310-1, RiboBio Co., Ltd, Guangzhou, Guangdong China). H9C2 cells were seeded into 96-well plates. Each well was filled with 50 μM EdU solution for 4 h of warm incubation. Next, the cells were fixed in 4% paraformaldehyde for 15 min and then treated with 0.5% Triton X-100 for 20 min. Then, cells were incubated with the reaction mixture for 30 min and then stained with 4', 6-diamidino-2-phenylindole (DAPI) for 15 min. After three PBS washes, the cells were observed and photographed under an inverted fluorescence microscope. Three independent experiments were conducted.
2.12. Cell counting kit-8 (CCK-8) method
Viability of cells was determined using the CCK-8 method. After transfection, cells were seeded on 96-well plates at a density of 1,000 cells per well and cultured at 37°C with 5% CO2. Then, each well was filled with 10 μL CCK-8 Reagent at 0, 24, 48 and 72 h and followed by 2 more hours of incubation. The optical density (OD) value of each well at 450 nm was read using a microplate reader.
2.13. Hoechst 33342/Propidium iodide (PI) staining
Hoechst 33342/PI double staining was performed according to the manufacturer’s instructions (H21491, Invitrogen). H9C2 cells were incubated with Hoechst 33342 (10 μg/mL) and PI (10 μg/mL) at 37°C for 15 min, respectively. After PBS washes, the cells were observed under a fluorescence microscope.
2.14. RT-qPCR
Total RNA was extracted using TRIzol (Invitrogen) as per the manufacturer’s protocols. RNA of specific genes was reversely transcribed to cDNA using a PrimeScript RT Reagent Kit (Takara Holdings Inc., Kyoto, Japan). Real-time q-PCR was then performed using SYBR Premix Ex Taq II (Takara) on a 7900HT real-time qPCR System. miRNA was reversely transcribed using a miScript Reverse Transcription kit (Qiagen GmbH, Hilden, Germany), and miR-27a expression was determined using a MiScript SYBR-Green PCR Kit (Qiagen). Relative gene expression was measured using the 2−ΔΔCT method. The primers are listed in .
Table 1. Primer sequences for RT-qPCR
2.15. Carboxyfluorescein diacetate succinimidyl ester (CFSE) Labeling
A Cell TraceTM CFSE Cell proliferation Kit (#C34570, Thermo Fisher Scientific) was used for cell proliferation detection. CellTrace™ stock solution in 1 μL dimethyl sulfoxide was added into cell suspension in PBS to prepare working solution. Cells were prepared at 37°C in the dark for 20 min. Then, the cells were incubated in medium (containing at least 1% protein) at a 5-fold volume of the dyeing solution for 5 min to remove the remaining free dye. Then, the cell suspension was centrifuged with the supernatant discarded, and the cells were incubated in pre-warmed complete medium for 10 min for further use. Cell TraceTM reagent was used to hydrolyze acetate. Next, the cells were incubated at 37°C with 5% CO2 for 5 d. On the first and fifth days of incubation, the fluorescein in cells was determined using a flow cytometer (# 556,547, BD Biosciences, Franklin Lakes, NJ, USA) at the excitation and emission filters of 488 nm.
2.16. Lactate dehydrogenase (LDH) measurement
After H/R treatment, the cells were washed with precooled PBS. Next, the cells were added with extract reagent at a ratio of 500:1 (cell number (104): extract reagent (mL)). Next, the cells were destroyed on ice and then centrifuged at 4°C at 8000 g for 10 min. Then, the LDH level in the supernatant was instantly determined using the LDH Kit (#BC0685, Solarbio). The OD value at 560 nm was analyzed using a microplate reader.
2.17. Caspase-3 activity detection
Caspase-3 activity was evaluated using a caspase-3 activity kit (#BB-4106-20 T, BestBio, Shanghai, China). The myocardial cells were lysed in 90 μL cell lysis buffer, and the lysates were further filled with 10 μL Ac-DEVD-Ρna and incubated at room temperature for 2 h. The OD values at 405 nm of apoptotic cells and control cones were detected using an ELISA kit, and the caspase-3 activity was determined according to the ratio of the two values.
2.18. Total collagen measurement
A total collagen assay kit (ab222942, Abcam Inc., Cambridge, MA, USA) was used to measure the total collagen content. In brief, samples and standard were hydrolyzed by concentrated NaOH at 120°C and then centrifuged at 10,000 g for 5 min to precipitate the debris. Then, the supernatant was collected, and the samples and standard were evaporated at 65°C and incubated with oxidation mixture for 20 min. After that, the wells were further added with photographic developer for 5 min and concentrated 3,2'-dimethyl-4-aminobiphenyl solution at 65°C for 45 min. Next, the OD value at 560 nm was determined using the microplate reader.
2.19. Flow cytometry
Apoptosis of cells was determined according to the phosphatidylserine exposure and membrane permeability detection. The myocardial cells were double stained using a fluorescein isothiocyanate-Annexin-V/PI apoptosis detection kit (# 556,547) as per the kit’s instructions. Then, the samples were analyzed using the flow cytometer and the Cell Quest Software (Beckman Coulter, USA).
2.20. Transwell assays
Invasion and migration abilities of cells were evaluated using Transwell assays. As for cell invasion, each apical chamber was precoated with 100 µL Matrigel and incubated at 37°C, while the basolateral chambers were loaded with 500 µL complete medium containing 10% fetal bovine serum. H9C2 cells (1 × 10⁶ cells/mL) were suspended in 200 µL serum-free DMEM and filled into the apical chamber. After 48 h of warm incubation, the cells were fixed in 100% methanol at room temperature for 15 min and then stained with 0.2% crystal violet at room temperature for 10 min. Thereafter, the number of invaded cells were observed under an inverted TS2R-FL microscope (Magnification, × 40; Nikon Corp.). Cell migration was performed in a similar manner but except for precoating Matrigel on the apical chambers.
2.21. Immunofluorescence staining
Cell slides were washed in PBS, permeated in 0.1% TritonX-100 for 15 min and then blocked with 10% goat serum at room temperature for an hour. Next, the sections were co-incubated with fibronectin (sc-9068, Santa Cruz Biotech, USA), Vimentin (V5255, Sigma-Aldrich) and α-SMA (A2547, Sigma-Aldrich) at 4°C overnight, and then with AF-488 or AF-555-labeled anti-mouse or anti-rabbit secondary antibody (#A-11,001, Invitrogen) at room temperature for 1 h. After that, the slides were washed with PBS and fixed with a fixed media containing DAPI. The images were captured using a Lionheart Fx Imager (Biotek, USA) at a × 40 magnification. The total fluorescence activity of each protein on the images was analyzed using ImageJ 1.50i (NIH).
2.22. Western blot analysis
Tissues and cells were lysed in Radio-Immunoprecipitation assay cell lysis buffer to collect total protein. The protein concentration was determined using an enhanced bicinchoninic acid (BCA) kit (Beyotime Biotechnology Co., Ltd., Shanghai, China). The protein was heated for denaturation, separated by sodium dodecyl sulfate-polyacrylamide gel electrophoresis and transferred on polyvinylidene fluoride membranes. The membranes were blocked with 1% bovine serum albumin (BSA) at room temperature for 1 h and incubated with primary antibodies at 4°C overnight, and then with horseradish peroxidase-conjugated secondary antibody (#G-21,234, Invitrogen) at room temperature for 30 min. The protein bands were analyzed using an Immun-Star HRP kit (#1,705,018, Bio-Rad, Inc., Hercules, CA, USA) and an Image J2 × software (NIH). The primary antibodies used were Vimentin (#10,366-1-AP, ProteinTech), KLF5 (ab137676, Abcam), apoptotic protease-activating factor-1 (Apaf1, #GTX22001, GeneTex), B-cell lymphoma-2 (Bcl-2, #GTX100064, GeneTex), Bcl-2-associated X (Bax, #GTX109683, GeneTex), fibronectin (#MA5-11,981, Invitrogen), α-SMA (#19,245, CST), Collagen I (ab34710, Abcam), Collagen II (ab34712, Abcam), GFPT2 (#PA5-90,419, Invitrogen); transforming growth factor-beta 1 (TGF-β1, #MA5-15,065, Invitrogen), Smad2 (#8685, CST), p-Smad2 (Ser423/Ser425, #18,338, CST), Smad3 (#9513, CST), p-Smad3 (Ser423/Ser425, #9520, CST) and glyceraldehyde-3-phosphate dehydrogenase (#60,004-1-Ig, ProteinTech).
2.23. miRNA microarray analysis
A miRNA4.0 microarray (Affymetrix, USA) was used according to the manufacturer’s instructions. A FlashTagTM kit (# 901,910, Affymetrix) was used for Poly (A) biotin labeling and hybridization. Thereafter, a GeneChip kit (# 902,412, Thermo Fisher) was used to stain the chips and images, and the raw data were collected by scanning. Differentially expressed miRNAs were screened out with p < 0.05 and |log2FC| > 1 as the screening criteria.
2.24. Chromatin immunoprecipitation (ChIP)-qPCR
ChIP assay was performed as per the manufacturer’s instructions (#26,157, Thermo Fisher). In brief, approximately 1 × 10⁷ cells were fixed in 1% methanol and quenched using glycine. After 3 PBS washes, the cells were collected in cold PBS containing 1% Halt Cocktail, lysed in MNase and detached, and then the mixture was treated with ultrasound on ice to destroy the nuclear membrane. The obtained lysates were incubated with anti-KLF5 (#710,918, Invitrogen) and protein G beads at 4°C overnight with normal anti-rabbit IgG as negative control. Then, the beads were washed, and the DNA was eluted using ChIP elution buffer. After that, the eluent was warm-incubated at 65°C for 1.5 h. A DNA purification kit was used for DNA recovery, and the purified DNA was determined by qPCR. At least three independent experiments were performed.
2.25. Dual-luciferase reporter gene assay
Titanium®Taq was used to amplify PCR products from H9C2 cells based on the 3' untranslated region (3'UTR) of GFPT2 and NAFSC using a PCR kit as per the manufacturer’s instructions (Clontech Laboratories, Palo Alto, CA, USA). The PCR product was double detached using HindIII and MluI and inserted into pmiR vectors. The vectors were then connected using T4 DNA ligase and transfected in Escherichia coli cells (Thermo Fisher Scientific) with DH5α capacity to screen out positive clones. Thereafter, the pmiR-GFPT2-wild type (WT) and pmiR-GFPT2-mutant type (MUT) vectors as well as pmiR-NAFSC-WT and pmiR-NAFSC-MUT vectors were constructed and co-transfected with either miR-27a mimic, miR-27a inhibitor, or NC inhibitor into 293 T cells (Thermo Fisher Scientific) using the riboRECTTMCP transfection reagent. After 48 h of warm incubation, the luciferase activity in cells was determined using a Dual Luciferase Reporter Assay Kit (Promega Corp) as per the kit’s instructions.
2.26. Biotin-labeled RNA pull-down
A specific biotinylated miR-27a probe that can bind with miR-27a was designed and synthesized. H9C2 cells were lysed on ice. Then, the cell lysates were incubated with 3 μg biotin-labeled probe at room temperature for 4 h. Thereafter, the Streptomyces avidin beads (#89,818, PierceTM, Thermo Fisher Scientific) were prepared and co-incubated with RNase-free BSA (10 mg/mL) and 10 μL yeast phenylalanine transfer RNA (tRNA, 10 mg/mL) at 4°C in lysis buffer for 3 h to avoid nonspecific binding. The beads were used to pull down the biotin-labeled RNA compound at 4°C overnight. On the second day, the concentration of GFPT2 fragment was determined by RT-qPCR.
2.27. Statistical analysis
The SPSS 22.0 (IBM Corp. Armonk, NY, USA) was used for data analysis. Kolmogorov–Smirnov test checked whether the data were in normal distribution. Differences between two groups were evaluated using the t-test, while differences among multiple groups were compared using one-way or two-way analysis of variance (ANOVA) followed by Tukey’s multiple comparisons test. Measurement data were collected from three independent experiments and exhibited as mean ± standard deviation (SD). p< 0.05 was considered statistically significant.
3. Results
3.1. ML264 treatment reduces H/R-induced damage in H9C2 cells
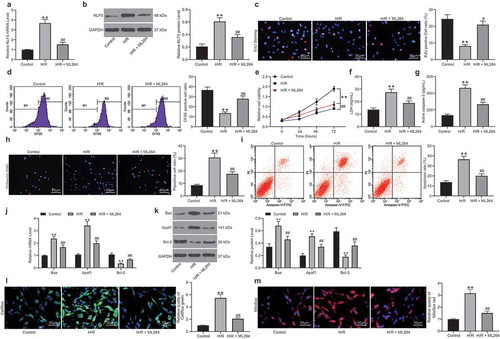
The relevance of KLF5 to MI was first examined in vitro. It was found that KLF5 expression was increased in the H9C2 cells after H/R treatment. Then, a KLF5-specific inhibitor ML264 was introduced in H/R-treated H9C2 cells at 10 μmol/mL, after which the KLF5 expression was significantly suppressed (). Next, EdU and CFSE labeling assays suggested that the viability of H9C2 cells was suppressed after H/R treatment but then significantly recovered following further ML264 administration (). The CCK-8 method showed similar trends where ML264 treatment increased the proliferation activity of H/R-treated H9C2 cells (). After that, an LDH Kit was applied to evaluate the damage in cells after H/R treatment. It was found that the LDH release in H9C2 cells was increased after H/R treatment but reduced after the subsequent ML264 treatment. A similar trend was also observed regarding Caspase-3 activity in cells that ML264 treatment reduced Caspase-3 activity induced by H/R treatment in myocardial cells (). In addition, Hoechst 33342/PI double staining and flow cytometry were performed to measure cell apoptosis. The results showed that the number of PI-positive cells (apoptotic cells) was increased following initial H/R treatment but then decreased following ML264 administration (). Moreover, RT-qPCR and western blot analysis results showed that the mRNA and protein expression of pro-apoptotic factors Bax and Apaf-1 in cells was increased while the expression of anti-apoptotic Bcl-2 was decreased following H/R treatment. These changes were then reversed after ML264 treatment (). The ROS concentration in cells was examined as well. It was found that the concentration of ROS in the H9C2 cells was significantly increased after H/R treatment but decreased again after ML264 treatment (). To exclude that other cellular factors mediated by ML264 are involved in the events, artificial downregulation of KLF5 in cells was introduced via short-hairpin (sh)RNA of KLF5. It was found that sh-KLF5 reduced apoptosis and ROS concentration in the H/R-treated H9C2 cells, which showed similar effects induced by ML264 (Supplementary Fig. S1A-F). These results indicated that KLF5 downregulation was responsible for the protective events mediated by ML264.
Figure 1. ML264 treatment reduces H/R-induced damage in H9C2 cells. A KLF5-specific inhibitor ML264 was introduced in H/R-treated H9C2 cells at 10 μmol/mL. A-B, mRNA (a) and protein (b) expression of KLF5 in cells determined by RT-qPCR and western blot analysis, respectively (one-way ANOVA, ** p < 0.01 vs. Control, ## p < 0.01 vs. H/R treatment); C-D, viability of cells determined by EdU labeling (c) and CFSE labeling (d) (one-way ANOVA, ** p < 0.01 vs. Control, ## p < 0.01 vs. H/R treatment); E, proliferation of cells determined by CCK-8 method (two-way ANOVA, ** p < 0.01 vs. Control, # p < 0.05, ## p < 0.01 vs. H/R treatment); F, LDH production in cells determined using an LDH kit (one-way ANOVA, ** p < 0.01 vs. Control, ## p < 0.01 vs. H/R treatment); G, Caspase-3 activity in H9C2 cells measured using a Caspase-3 detection kit (one-way ANOVA, ** p < 0.01 vs. Control, ## p < 0.01 vs. H/R treatment); H-I, apoptosis of H9C2 cells determined by Hoechst 33342/PI double staining (h) and flow cytometry (i) (one-way ANOVA, ** p < 0.01 vs. Control, ## p < 0.01 vs. H/R treatment); J-K, mRNA (j) and protein (k) expression of apoptosis-related factors Bax, Bcl-2 and Apaf1 in cells determined by RT-qPCR and western blot analysis, respectively (two-way ANOVA, ** p < 0.01 vs. Control, ## p < 0.01 vs. H/R treatment); L-M, ROS concentration in cells examined using CellROX Green (l) and MitoSox Red (m) kits (one-way ANOVA, ** p < 0.01 vs. Control, ## p < 0.01 vs. H/R treatment). Data were exhibited as mean ± SD from at least three independent experiments
3.2. ML264 inhibits H/R-induced fibrosis of H9C2 cells
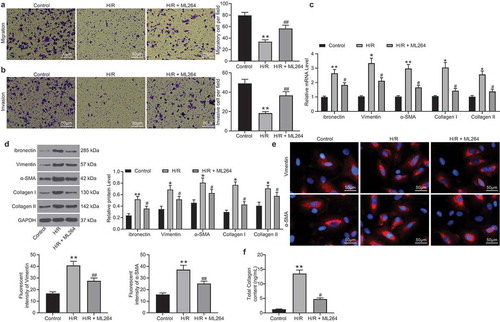
The role of KLF5 in H/R-induced myocardial fibrosis in cells was then determined. First, Transwell assays were performed and identified a significant decline in the number of migrated and invaded cells after H/R treatment, but the cell invasion and migration abilities were recovered after KLF5 inhibition by ML264 (). Next, RT-qPCR and western blot analysis were performed to evaluate the levels of fibrosis-related factors including fibronectin, Vimentin, α-SMA, and Collagen I/II in cells. The levels of these factors were notably increased after H/R treatment. But these changes were reversed by ML264 treatment (). In addition, the immunofluorescence staining results concerning the expression of Vimentin and α-SMA in cells were in line with the above results (). In addition, a Collagen kit was used to determine the secretion of collagen in cells. Again, the results showed that the ML264 treatment inhibited the collagen content in cells induced by H/R treatment (). Likewise, downregulation of KLF5 by sh-KLF5 was found to reduce the expression of the fibrosis-related factors (Supplementary Fig. S1A-F). These results indicated H/R treatment induces KLF5 expression to trigger apoptosis and fibrosis in H9C2 cells.
Figure 2. ML264 inhibits H/R-induced fibrosis of H9C2 cells. A-B, invasion and migration abilities of H9C2 cells determined by Transwell assays (one-way ANOVA** p < 0.01 vs. Control ## p < 0.01 vs. H/R treatment); C-D, mRNA (c) and protein (d) expression of fibronectin, Vimentin, α-SMA and Collagen I/II in cells determined by RT-qPCR and western blot analysis, respectively (two-way ANOVA, * p < 0.05, ** p < 0.01 vs. Control, # p < 0.05 vs. H/R treatment); E, Vimentin and α-SMA expression in cells further evaluated by immunofluorescence staining (one-way ANOVA, ** p < 0.01 vs. Control, ## p < 0.01 vs. H/R treatment); F, total collagen content in cells determined by a collagen kit (one-way ANOVA, ** p < 0.01 vs. Control, # p < 0.05 vs. H/R treatment). Data were exhibited as mean ± SD from at least three independent experiments
3.3. miR-27a was significantly up-regulated in H9C2 cells following ML264 treatment
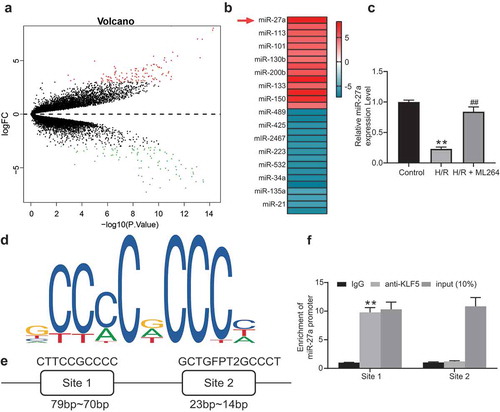
To further explore the molecules involved, a miRNA microarray analysis was conducted to evaluate differentially expressed miRNAs after ML264 treatment in cells. Consequently, a total of 212 miRNAs were screened out with |LogFC > 2| and adj p value < 0.01 as the screening criteria, among which miR-27a showed the highest degree of differential expression (). Next, the RT-qPCR results showed that miR-27a expression in cells was significantly decreased after H/R treatment but recovered after ML264 treatment (). We then speculated that as a transcription factor, KLF5 might suppress miR-27a expression through the transcriptional inhibition. According to the prediction on JASPAR (http://jaspar.genereg.net/), there are two binding sites between KLF5 and the promoter region of miR-27a (). Thereafter, a ChIP-qPCR was performed and identified that the fragments precipitated by anti-KLF5 were more than those precipitated by anti-IgG at miR-27a site 1, while little difference was found at miR-27a site 2 (), indicating that KLF5 transcriptionally suppresses miR-27a expression by binding to the promoter sequence at site 1.
Figure 3. miR-27a is significantly up-regulated in H9C2 cells following ML264 treatment. A, a volcano map for differentially expressed miRNAs in cells following ML264 treatment; B, top 15 differentially expressed miRNAs; C, miR-27a expression in cells determined by RT-qPCR (one-way ANOVA, ** p < 0.01 vs. Control, ## p < 0.01 vs. H/R treatment); D, conservative sequence of KLF5; E, binding sites between KLF5 and the promoter region of miR-27a predicted on JASPAR; F, binding relationship between KLF5 and the promoter region of miR-27a validated through a ChIP-qPCR analysis (two-way ANOVA, ** p < 0.01 vs. anti-IgG). Data were exhibited as mean ± SD from at least three independent experiments
3.4. miR-27a mimic suppresses H/R-induced apoptosis and fibrosis in H9C2 cells
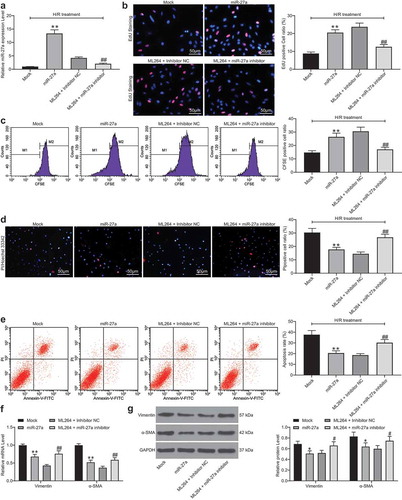
To confirm the role of miR-27a in H/R-treated H9C2 cells, miR-27a mimic was introduced in H/R-treated cells, while miR-27a inhibitor was transfected into ML264-treated cells. Successful transfection was confirmed 48 h after transfection according to RT-qPCR (). Next, EdU and CFSE labeling results suggested that miR-27a mimic increased the viability of cells that was inhibited by H/R treatment. Conversely, miR-27a inhibition further reduced cell viability that was increased by ML264 (). Likewise, the Hoechst 33342/PI double staining and flow cytometry results suggested that overexpression of miR-27a reduced the number of apoptotic cells induced by H/R, while miR-27a inhibitor increased cell apoptosis that was initially suppressed by ML264 (). In addition, the RT-qPCR and western blot analysis results suggested that overexpression of miR-27a suppressed the expression of Vimentin and α-SMA in cells, but downregulation of miR-27a led to inverse trends (). In addition, the function of miR-27a inhibition alone was further analyzed. miR-27a inhibitor and the inhibitor NC were transfected into H/R-treated cells without ML264 treatment. Then, it was found that the H/R-induced decline in cell viability and increase in apoptosis and production of fibrosis-related factors were further aggravated upon miR-27a inhibition (Supplementary Fig. S2A-F).
Figure 4. miR-27a mimic suppresses H/R-induced apoptosis and fibrosis in H9C2 cells. miR-27a mimic was introduced in H/R-treated cells while miR-27a inhibitor was transfected into ML264-treated cells. A, miR-27a expression in cells determined by RT-qPCR (one-way ANOVA, ** p < 0.01 vs. Mock, ## p < 0.01 vs. ML264 + miR-27a inhibitor); B-C, viability of cells determined by EdU labeling (b) and CFSE labeling (c) assays (one-way ANOVA, ** p < 0.01 vs. Mock, ## p < 0.01 vs. ML264 + miR-27a inhibitor); D-E, apoptosis of H9C2 cells determined by Hoechst 33342/PI double staining (d) and flow cytometry (e) (one-way ANOVA, ** p < 0.01 vs. Mock, ## p < 0.01 vs. ML264 + miR-27a inhibitor); F-G, mRNA (f) and protein (g) expression of Vimentin and α-SMA in cells determined by RT-qPCR and western blot analysis, respectively. Data were exhibited as mean ± SD from at least three independent experiments (two-way ANOVA, * p < 0.05 vs. Mock, # p < 0.05 vs. ML264 + miR-27a inhibitor). Data were exhibited as mean ± SD from three independent experiments
3.5. miR-27a targets GFPT2 and inactivates the TGF-β/Smad2/3 signaling pathway
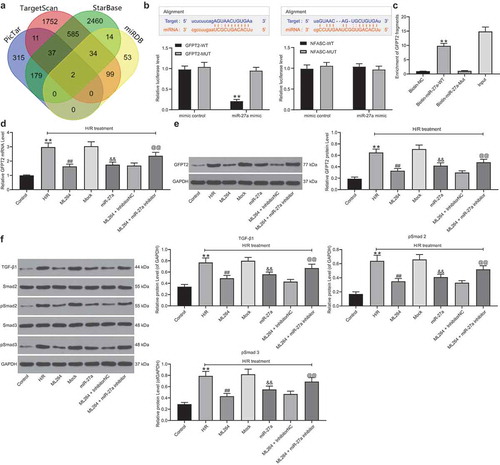
Then, the target mRNAs of miR-27a were predicted on several bioinformatic systems including StarBase (http://starbase.sysu.edu.cn/index.php), TargetScan (http://www.targetscan.org/vert_72/), miRDB (http://mirdb.org/) and PicTar (https://pictar.mdc-berlin.de/), and two target mRNAs including NFASC and GFPT2 were predicted (). Next, dual-luciferase reporter gene assays were performed, which suggested that transfection of miR-27a mimic reduced the luciferase activity of the GFPT2 WT luciferase vector in cells, while it did not affect the activity of the GFPT2 MUT or the NFASC luciferase vectors (). In addition, an RNA pull-down assay was performed, which suggested that compounds pulled down by biotin-labeled miR-27a-WT were more than those by biotin-NC or biotin-miR-27a-MUT (). These results suggested that miR-27a targeted GFPT2 mRNA. Next, RT-qPCR and western blot analysis were performed to explore GFPT2 expression in H9C2 cells. It was found that GFPT2 expression in cells was significantly increased after H/R treatment or miR-27a downregulation but decreased after ML264 or miR-27a mimic administrations (). Thereafter, we determined activation of the TGF-β/Smad2/3 signaling pathway in cells using western blot analysis. The results showed that after H/R or miR-27a inhibitor treatments, the expression of TGF-β1 and phosphorylation of Smad2/3 were enhanced promoted, while inhibition of KLF5 or upregulation of miR-27a suppressed TGF-β1 expression as well as Smad2/3 phosphorylation in cells ().
Figure 5. miR-27a targets GFPT2 and inactivates the TGF-β/Smad2/3 signaling pathway. A, intersected target mRNAs of miR-27a predicted on four bioinformatic systems StarBase, TargetScan, miRDB and PicTar; B, binding relationships between miR-27a and GFPT2 or NAFSC mRNA examined through dual-luciferase reporter gene assays (two-way ANOVA, ** p < 0.01 vs. GFPT2-MUT); C, binding relationship between miR-27a and GFPT2 validated through a biotin-labeled RNA pull-down assay (one-way ANOVA, ** p < 0.01 vs. Biotin-NC); D-E, mRNA (d) and protein (e) expression of GFPT2 in cells determined by RT-qPCR and western blot analysis, respectively (one-way ANOVA, ** p < 0.01 vs. control, ## p < 0.01 vs. H/R, && p < 0.01 vs. Mock, @@ p < 0.01 vs. ML264 + inhibitor); F, expression of TGF-β1 and phosphorylation of Smad2/3 in cells determined by western blot analysis (one-way ANOVA, ** p < 0.01 vs. control, ## p < 0.01 vs. H/R, && p < 0.01 vs. Mock, @@ p < 0.01 vs. ML264 + inhibitor). Data were exhibited as mean ± SD from at least three independent experiments
3.6. Overexpression of GFPT2 counteracts the protective roles of miR-27a in H/R-induced cell damage
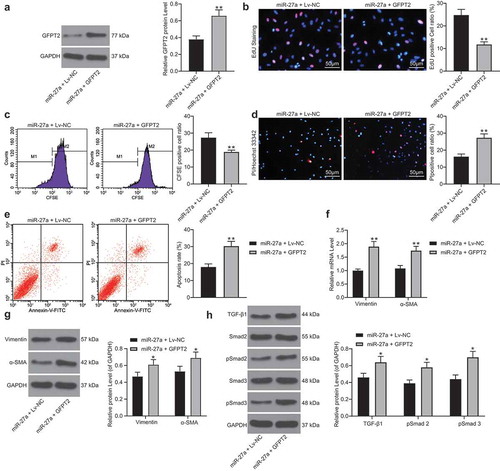
Overexpression of GFPT2 was further administrated into H/R-treated cells after miR-27a upregulation. Forty-eight hours after LV-GFPT2 administration, it was found that the GFPT2 level was successfully increased (). Thereafter, we found and the increase in cell viability and the decrease in apoptosis and production of fibrosis-related factors induced by miR-27a were blocked after GFPT2 upregulation (). In addition, the TGF-β expression as well as Smad2/3 phosphorylation inhibited by miR-27a were recovered following GFPT2 overexpression ().
Figure 6. Overexpression of GFPT2 counteracts the protective roles of miR-27a in H/R-induced cell damage. A, GFPT2 expression in H/R-treated cells overexpressing miR-27a determined by western blot analysis 48 h after LV-GFPT2 administration (unpaired t test, ** p < 0.01 vs. miR-27a + LV-NC); B-C, viability of cells determined by EdU labeling (b) and CFSE labeling followed by flow cytometry (c) (unpaired t test, ** p < 0.01 vs. miR-27a + LV-NC); D-E, apoptosis of H9C2 cells determined by Hoechst 33342/PI double staining (d) and flow cytometry (e) (unpaired t test, ** p < 0.01 vs. miR-27a + LV-NC); F-G, mRNA (f) and protein (g) expression of Vimentin and α-SMA in cells determined by RT-qPCR and western blot analysis (two-way ANOVA, * p < 0.05, ** p < 0.01 vs. miR-27a + LV-NC); H, expression of TGF-β1 and phosphorylation of Smad2/3 in cells determined by western blot analysis (two-way ANOVA, * p < 0.05 vs. miR-27a + LV-NC). Data were exhibited as mean ± SD from at least three independent experiments
3.7. ML264 elevates expression of miR-27a and enhances myocardial function of mice with MI
In vivo experiments were conducted for more comprehensive findings. A mouse model with MI was established and further treated with ML264, miR-27a antagomiR, and LV-GFPT2, respectively (). The expression of miR-27a and GFPT2 in mouse myocardial tissues was then examined. It was found that the expression of miR-27a was significantly decreased while the expression of GFPT2 was enhanced in the myocardial tissues of model mice. ML264 treatment enhanced the expression of miR-27a and reduced the expression of GFPT2, while further administration of antagomiR-27a or LV-GFPT2 significantly reduced the expression of GFPT2 in tissues (). Then, the myocardial function of mice was examined. According to the LVEF and LVFS values by echocardiogram, KLF5 inhibition significantly enhanced the myocardial function in MI mice, but this enhancement was inhibited following further miR-27a down-regulation or GFPT2 overexpression (). In addition, the levels of LDH, cTnT, cTnI and CK-MB in mouse serum were determined. It was found that ML264 treatment notably relieved myocardial injury in model mice, but this alleviation was blocked following miR-27a down-regulation or GFPT2 overexpression ().
Figure 7. KLF5 transcriptionally suppresses miR-27a expression to activate GFPT2/TGF-β/Smad2/3 signaling pathway to trigger fibrosis in mice with MI. A, a brief diagram for mouse grouping; B, expression of miR-27a and GFPT2 in mouse myocardial tissues examined by RT-qPCR and western blot analysis, respectively (one-way ANOVA, ** p < 0.01 vs. sham, ## p < 0.01 vs. DPBS, && p < 0.01 vs. ML264 + antagomiR NC, @@ p < 0.01 vs. ML264 + Lv-NC); C-D, LVEF and LVFS levels determined by echocardiogram (one-way ANOVA, ** p < 0.01 vs. sham, ## p < 0.01 vs. DPBS, & p < 0.05, && p < 0.01 vs. ML264 + antagomiR NC, @ p < 0.05, @@ p < 0.01 vs. ML264 + Lv-NC); E, levels of LDH and CK-MB in mouse serum determined using an automatic biochemical analyzer while cTnI and cTnT by ELISA kits (one-way ANOVA, ** p < 0.01 vs. sham, ## p < 0.01 vs. DPBS, && p < 0.01 vs. ML264 + antagomiR NC, @@ p < 0.01 vs. ML264 + Lv-NC). There were 10 mice in each group. Data were exhibited as mean ± SD from at least three independent experiments
3.8. KLF5/miR-27a/GFPT2 axis mediates the TGF-β/Smad2/3 signaling pathway to affect MI progression in mice
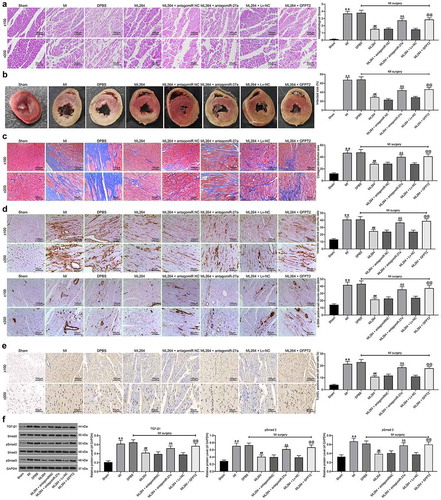
The pathological changes in mouse tissues were further examined. First, the HE, TTC and Masson’s staining were carried out to evaluate fibrosis in tissues, and immunohistochemistry staining was conducted to measure the expression of Vimentin and α-SMA in mouse myocardial tissues. The results showed that the infarct size and fibrosis in myocardial tissues in MI mice were reduced after ML264 treatment, but this reduction was blocked by miR-27a inhibition or GFPT2 overexpression (). Moreover, TUNEL results suggested that the cell apoptosis in myocardial tissues was inhibited by ML264 but then enhanced by miR-27a antagomiR or LV-GFPT2 (). Western blot analysis was performed to evaluate TGF-β1 expression and Smad2/3 phosphorylation, and it was found that the expression of TGF-β1 and phosphorylation of Smad2/3 in the myocardial tissues were decreased after ML264 treatment. Still, these changes were reversed after further miR-27a down-regulation or GFPT2 overexpression ().
Figure 8. KLF5/miR-27a/GFPT2 axis mediates the TGF-β/Smad2/3 signaling pathway to affect MI progression in mice. A, pathological structure in mouse myocardial tissues determined by HE staining (one-way ANOVA, ** p < 0.01 vs Sham, ## p < 0.01 vs DPBS; && p < 0.01 vs ML264 + antagomiR NC; @@ p < 0.01 vs ML264 + Lv-NC); B, infarct size in mouse myocardial tissues determined by TTC staining (one-way ANOVA, ** p < 0.01 vs Sham, ## p < 0.01 vs DPBS; && p < 0.01 vs ML264 + antagomiR NC; @@ p < 0.01 vs ML264 + Lv-NC); C, fibrosis in myocardial tissues evaluated by Masson’s trichrome staining (one-way ANOVA, ** p < 0.01 vs Sham, ## p < 0.01 vs DPBS; && p < 0.01 vs ML264 + antagomiR NC; @@ p < 0.01 vs ML264 + Lv-NC); D, expression of Vimentin and α-SMA in myocardial tissues detected by immunohistochemistry staining (one-way ANOVA, ** p < 0.01 vs Sham, ## p < 0.01 vs DPBS; && p < 0.01 vs ML264 + antagomiR NC; @@ p < 0.01 vs ML264 + Lv-NC); E, cell apoptosis in mouse myocardial tissues determined by TUNEL assay (one-way ANOVA, ** p < 0.01 vs Sham, ## p < 0.01 vs DPBS; && p < 0.01 vs ML264 + antagomiR NC; @@ p < 0.01 vs ML264 + Lv-NC); F, TGF-β expression and phosphorylation of Smad2/3 in mouse myocardial tissues determined by western blot analysis (one-way ANOVA, ** p < 0.01 vs Sham, ## p < 0.01 vs DPBS; && p < 0.01 vs ML264 + antagomiR NC; @@ p < 0.01 vs ML264 + Lv-NC). There were 10 mice in each group. Data were exhibited as mean ± SD from at least three independent experiments
4. Discussion
MI-induced cardiomyocyte death or dysfunction is a major cause of heart failure and a leading cause of hospitalization, poor quality of life, and death [Citation12]. The potential involvement of KLF5 in myocardial cell apoptosis and ischemic injury has been implicated [Citation5]. Here, our study validated that the silencing of KLF5 by ML264 improved myocardial function in model mice and decreased loss and fibrosis in myocardial cells in vivo and in vitro, during which upregulation of miR-27a and GFPT2 suppression and the following TGF-β/Smad2/3 inactivation were possibly involved.
KLF5 has also been suggested as a potential biomarker for diagnosis and prognosis in many human cancers and cardiovascular diseases [Citation7]. In addition to the aforementioned pro-apoptotic function in myocardial cells [Citation13], similarly, KLF5 has been suggested as a target for angiotensin II signaling and an essential regulator of cardiovascular remodeling [Citation14] or as a contributor in fibrogenic responses in liver fibrosis [Citation15]. However, KLF5 has shown beneficiary roles in improving cardiac function by enhancing the transcription of peroxisome proliferator-activated receptor α that is necessary for fatty acid oxidation and accounts for 70% of cardiac ATP content [Citation13]. The discrepancy in KLF5 function may be attributed to the different target transcripts involved. The initial finding of the study was that downregulation of KLF5 by ML264 restored the viability while reduced apoptosis and fibrosis in H/R-treated cells. Myocardial cell apoptosis has been widely accepted to augment MI and heart failure, leaving limiting cardiomyocyte apoptosis a great object in heart protection [Citation16]. Heart regeneration with the reconstitution of the cardiomyocyte substrate has been recognized as a tantalizing and potentially disruptive strategy to combat heart failure [Citation12]. In addition, inflammation and excessive fibrotic responses and reactive fibrosis are detrimental as they may lead to progressive myocardial impairment and eventually heart failure [Citation17–19]. From the cytokine perspective, it was found the levels of pro-apoptotic factors Bax, Apaf1 and Caspase-3 were decreased while the expression of anti-apoptotic Bcl2 [Citation20] was increased after ML264 administration. In addition, the levels of fibrosis-biomarkers fibronectin, Vimentin, α-SMA, and Collagen I/II [Citation21,Citation22] were declined after KLF5 inhibition. In vivo, it was found that apoptosis in myocardial cells and the infarct size in mouse myocardium were reduced as well. Infarct size is an independent indicator predicting mortality after infarction [Citation23]. The myocardial function was recovered after ML264 introduction, also as evidenced by decreased contents of cTnT, cTnI, LDH, and CK-MB [Citation3,Citation24]. In addition, ML264 was initially developed as a specific inhibitor of KLF5 for colorectal cancer treatment [Citation25]. Considering the difference in tissue may affect the inhibitory effect, to exclude that KLF5 downregulation was responsible for the protective events mediated by ML264, sh-KLF5 was further introduced in cells, which reduced apoptosis and ROS concentration in the H/R-treated H9C2 cells. All in all, the above findings indicated that silencing of KLF5 led to alleviation in MI in both animal and cell models.
MiRNAs have aroused increased interests in the field of MI research since their aberrant expression is frequently closed to MI progression [Citation4]. Here, in this paper, a miRNA microarray was performed with miR-27a identified as the most up-regulated miRNA in H/R-treated H9C2 cells following ML264 administration. Thereafter, we identified that miR-27a expression could be transcriptionally suppressed by KLF5. Interestingly, miR-27a was found as one of the biomarker miRNAs with diagnostic value in MI [Citation26]. Either miR-27a-5p [Citation27] or miR-27a-3p [Citation28] was suggested to be down-regulated in hypoxia-induced H9C2 cells and could attenuate cardiomyocyte injury. Here, we found that overexpression of miR-27a significantly reduced apoptosis and fibrosis in H/R-treated H9C2 cells. In addition, we further found that miR-27a directly bound to GFPT2 and inactivated the TGF-β/Smad2/3 signaling pathway. It was noteworthy that artificial upregulation of GFPT2 blocked the protective functions of miR-27a mimic against H/R-induced myocardial cell damage and restored the TGF-β/Smad2/3 activity. Similar results were reproduced in vivo. GFPT2 has been reported to trigger chronic renal insufficiency through mediating overproduction of TGF-β1 expression in patients with diabetics [Citation29]. Likewise, GFPT2 activity has been reported to be necessary for the induction of TGF-β1 and fibronectin expression in mesangial cells [Citation30]. TGF-β1 and its stimulatory factors Smad2/3 are crucial extracellular matrix-related proteins whose long-term excessive expression leading to fibrotic remodeling of tissues and eventually organ failure [Citation31]. More relevantly, the TGF-β/Smad pathway has been suggested as a major therapeutic target for prevention and treatment of myocardial fibrosis [Citation32–34]. The findings in this study suggested that this signaling pathway is possibly accountable for KLF-5 induced myocardial injury.
To conclude, this study provided evidence that silencing of KLF5 could alleviate cell and tissue damage in MI through the upregulation of miR-27a and the downregulation of GFPT2/TGF-β/Smad2/3. However, there are still several limitations of the current study. How GFPT2 affects the TGF-β/Smad2/3 signaling pathway remains elusive. We selected miR-27a as the study subject through a combination of microarray analysis and ChIP-qPCR assays. This could be a little arbitrary compared to a ChIP-seq assay. In addition, the miR-27a-GFPT2 may not be the only axis involved in the protective events mediated by ML264, other similar networks may also be implicated. In addition, we selected GFPT2 as the target of miR-27a through integrated bioinformatic analysis and luciferase assays. Due to the funding and time limitations, a transcriptional profiling which may help identify target transcripts of miR-27a more completely was not included in the study. We would like to investigate more molecules and axes involved in the events and use more complete methods in our future researches. Anyway, these findings may provide novel insights into MI control and treatment. We also hope that more studies will be launched in this field to offer more understandings and to develop novel less-invasive and promising strategies for MI and other CAD.
Supplemental Material
Download MS Word (1.1 MB)Disclosure statement
All authors declare no conflict of interests in this study.
Supplementary material
Supplemental data for this article can be accessed here
References
- Barquera S, Pedroza-Tobias A, Medina C, et al. Global overview of the epidemiology of atherosclerotic cardiovascular disease. Arch Med Res. 2015;46(5):328–338.
- Montrief T, Davis WT, Koyfman A, et al. Mechanical, inflammatory, and embolic complications of myocardial infarction: an emergency medicine review. Am J Emerg Med. 2019;37(6):1175–1183.
- Thygesen K, Alpert JS, Jaffe AS, et al. Fourth universal definition of myocardial infarction (2018). J Am Coll Cardiol. 2018;72(18):2231–2264.
- Sun T, Dong YH, Du W, et al. The role of MicroRNAs in myocardial infarction: from molecular mechanism to clinical application. Int J Mol Sci. 2017;18(4):745.
- Yang D, Yu J, Liu HB, et al. The long non-coding RNA TUG1-miR-9a-5p axis contributes to ischemic injuries by promoting cardiomyocyte apoptosis via targeting KLF5. Cell Death Dis. 2019;10(12):908.
- Diakiw SM, D’Andrea RJ, Brown AL. The double life of KLF5: opposing roles in regulation of gene-expression, cellular function, and transformation. IUBMB Life. 2013;65(12):999–1011.
- Dong JT, Chen C. Essential role of KLF5 transcription factor in cell proliferation and differentiation and its implications for human diseases. Cell Mol Life Sci. 2009;66(16):2691–2706.
- Gholamin S, Pasdar A, Khorrami MS, et al. The potential for circulating microRNAs in the diagnosis of myocardial infarction: a novel approach to disease diagnosis and treatment. Curr Pharm Des. 2016;22(3):397–403.
- Cao A, Li X. Bilobalide protects H9c2 cell from oxygen-glucose-deprivation-caused damage through upregulation of miR-27a. Artif Cells Nanomed Biotechnol. 2019;47(1):2980–2988.
- Zhang H, Jia Y, Cooper JJ, et al. Common variants in glutamine: fructose-6-phosphateamidotransferase 2 (GFPT2) gene are associated with type 2 diabetes, diabetic nephropathy, and increased GFPT2 mRNA levels. J Clin Endocrinol Metab. 2004;89(2):748–755.
- Li X, Geng J, Chen Y, et al. Exposure to particulate matter induces cardiomyocytes apoptosis after myocardial infarction through NFkappaB activation. Biochem Biophys Res Commun. 2017;488(1):224–231.
- Cahill TJ, Choudhury RP, Riley PR. Heart regeneration and repair after myocardial infarction: translational opportunities for novel therapeutics. Nat Rev Drug Discov. 2017;16(10):699–717.
- Drosatos K, Pollak NM, Pol CJ, et al. Cardiac myocyte KLF5 regulates ppara expression and cardiac function. Circ Res. 2016;118(2):241–253.
- Shindo T, Manabe I, Fukushima Y, et al. Kruppel-like zinc-finger transcription factor KLF5/BTEB2 is a target for angiotensin II signaling and an essential regulator of cardiovascular remodeling. Nat Med. 2002;8(8):856–863.
- Ohara F, Nii A, Sakiyama Y, et al. Pathophysiological characteristics of dimethylnitrosamine-induced liver fibrosis in acute and chronic injury models: a possible contribution of KLF5 to fibrogenic responses. Dig Dis Sci. 2008;53(8):2222–2232.
- Jose Corbalan J, Vatner DE, Vatner SF. Myocardial apoptosis in heart disease: does the emperor have clothes? Basic Res Cardiol. 2016;111(3):31.
- Francis Stuart SD, De Jesus NM, Lindsey ML, et al. The crossroads of inflammation, fibrosis, and arrhythmia following myocardial infarction. J Mol Cell Cardiol. 2016;91:114–122.
- Prabhu SD, Frangogiannis NG. The biological basis for cardiac repair after myocardial infarction: from inflammation to fibrosis. Circ Res. 2016;119(1):91–112.
- Talman V, Ruskoaho H. Cardiac fibrosis in myocardial infarction-from repair and remodeling to regeneration. Cell Tissue Res. 2016;365(3):563–581.
- Cavalcante GC, Schaan AP, Cabral GF, et al. A cell’s fate: an overview of the molecular biology and genetics of apoptosis. Int J Mol Sci. 2019;20(17):20.
- Liu L, Chen G, Chen T, et al. si-SNHG5-FOXF2 inhibits TGF-beta1-induced fibrosis in human primary endometrial stromal cells by the Wnt/beta-catenin signalling pathway. Stem Cell Res Ther. 2020;11(1):479.
- Yu YH, Zhang YH, Ding YQ, et al. MicroRNA-99b-3p promotes angiotensin II-induced cardiac fibrosis in mice by targeting GSK-3beta. Acta Pharmacol Sin. 2020.
- Sanz-Rosa D, Garcia-Prieto J, Ibanez B. The future: therapy of myocardial protection. Ann N Y Acad Sci. 2012;1254(1):90–98.
- O’Brien PJ. Cardiac troponin is the most effective translational safety biomarker for myocardial injury in cardiotoxicity. Toxicology. 2008;245(3):206–218.
- Ruiz De Sabando A, Wang C, He Y, et al. ML264, A novel small-molecule compound that potently inhibits growth of colorectal cancer. Mol Cancer Ther. 2016;15(1):72–83.
- Wu K, Zhao Q, Li Z, et al. Bioinformatic screening for key mi RNAs and genes associated with myocardial infarction. FEBS Open Bio. 2018;8(6):897–913.
- Zhang J, Qiu W, Ma J, et al. miR-27a-5p attenuates hypoxia-induced rat cardiomyocyte injury by inhibiting Atg7. Int J Mol Sci. 2019;20(10):2418.
- Li Y, Ren S, Xia J, et al. EIF4A3-induced circ-BNIP3 aggravated hypoxia-induced injury of H9c2 cells by targeting miR-27a-3p/BNIP3. Mol Ther Nucleic Acids. 2020;19:533–545.
- Prasad P, Tiwari AK, Kumar KM, et al. Association analysis of ADPRT1, AKR1B1, RAGE, GFPT2 and PAI-1 gene polymorphisms with chronic renal insufficiency among Asian Indians with type-2 diabetes. BMC Med Genet. 2010;11(1):52.
- Weigert C, Friess U, Brodbeck K, et al. Glutamine:fructose-6-phosphate aminotransferase enzyme activity is necessary for the induction of TGF-beta1 and fibronectin expression in mesangial cells. Diabetologia. 2003;46(6):852–855.
- Zeglinski MR, Hnatowich M, Jassal DS, et al. SnoN as a novel negative regulator of TGF-beta/Smad signaling: a target for tailoring organ fibrosis. Am J Physiol Heart Circ Physiol. 2015;308(2):H75–82.
- Yf D, Yr P, Li J, et al. Gualou xiebai decoction prevents myocardial fibrosis by blocking TGF-beta/Smad signalling. J Pharm Pharmacol. 2013;65(9):1373–1381.
- Liu JC, Zhou L, Wang F, et al. Osthole decreases collagen I/III contents and their ratio in TGF-beta1-overexpressed mouse cardiac fibroblasts through regulating the TGF-beta/Smad signaling pathway. Chin J Nat Med. 2018;16(5):321–329.
- Zhu JN, Chen R, Fu YH, et al. Smad3 inactivation and MiR-29b upregulation mediate the effect of carvedilol on attenuating the acute myocardium infarction-induced myocardial fibrosis in rat. PLoS One. 2013;8(9):e75557.