
ABSTRACT
Long non-coding RNAs (lncRNAs) are known to competitively bind with microRNAs (miRNAs) to participate in human cancers. We aim to explore the role of non-coding RNA activated by DNA damage (NORAD) binding to miR-323a-3p in breast cancer (BC) with the involvement of pumilio RNA-binding family member 1 (PUM1)/eukaryotic initiation factor 2 (eIF2) axis. Expression of NORAD, miR-323a-3p and PUM1 in tissues and cell lines was detected, and the correlation between NORAD expression and clinicopathological features of BC patients was analyzed. The screened cell line was respectively transfected with altered NORAD or miR-323a-3p to reveal their roles in viability, migration, invasion and apoptosis of BC cells in vitro. The tumor growth in vivo was observed in nude mice. The binding relationships among NORAD, miR-323a-3p and PUM1 were analyzed, and the regulatory role of NORAD and miR-323a-3p in the eIF2 signaling pathway was assessed. NORAD and PUM1 were upregulated and miR-323a-3p was downregulated in BC. High NORAD expression indicated a poor prognosis of BC patients. NORAD inhibition or miR-323a-3p elevation inhibited malignant behaviors of BC cells. The in vivo assay revealed that NORAD inhibition or miR-323a-3p elevation inhibited tumor growth as well. MiR-323a-3p inhibition reversed the role of NORAD knockdown in the biological functions of BC cells while silencing PUM1 reversed the influence of NORAD overexpression on BC cells. NORAD bound with miR-323a-3p and miR-323a-3p targeted PUM1. NORAD and miR-323a-3p functioned through the PUM1/eIF2 axis. NORAD inhibition or miR-323a-3p elevation suppresses the development of BC through the PUM1/eIF2 axis.
Introduction
Breast cancer (BC) is the most prevalent cancer among women currently and is the main cause of cancer-related death. There are about 1.6 million cases diagnosed with BC throughout the world each year [Citation1]. Women living in low- and middle-income countries account for 53% of newly diagnosed BC cases and 62% of cancer-associated deaths globally [Citation2]. It was revealed that 5–10% of all BC cases were resulted from genetic disorders, while the remaining 90–95% of cases were associated with lifestyle and environmental factors [Citation3]. Fortunately, the mortality of BC has been reduced in recent decades due to advanced detection, improved awareness and efficient treatments [Citation4]. Patients with early and advanced-stage BC were treated with surgery combined with radio- and/or chemotherapy. Nevertheless, the prognosis of most patients to some chemotherapy drugs is poor because of multidrug resistance [Citation5]. Therefore, novel biomarkers are urgently needed to be explored for BC treatment.
Long non-coding RNAs (lncRNAs) are non-coding RNAs with over 200 nt in length. With the development of molecular biology recently, the role of lncRNAs in cancers and many others diseases has been valued [Citation6]. For instance, lncRNA SNHG15 has been revealed to promote BC cell proliferation, migration and invasion [Citation7], and lncRNA linc00617 exhibited oncogenic activity in BC [Citation8]. Non-coding RNA activated by DNA damage (NORAD) plays an essential role in DNA protection and chromosomal stability [Citation9]. NORAD was found to promote hepatocellular carcinoma progression [Citation10], and regulate lung cancer cell proliferation, migration, invasion and apoptosis [Citation11]. Importantly, NORAD expression has been uncovered to predict poor prognosis and promote BC progression [Citation12]. MicroRNAs (miRNAs) are endogenous non-coding RNAs with 18–23 nt in length which can post-transcriptionally regulate eukaryotic genes [Citation13]. As previously reported, many miRNAs, such as miR-145-5p and miR-18a-5p are implicated in the progression of BC [Citation14,Citation15]. A study has shown that miR-323a-3p was downregulated in glioblastoma and its upregulation suppressed glioblastoma cell growth [Citation16]. Moreover, miR-323a-3p has been reported to suppress the glycolysis of osteosarcoma [Citation17]. These data indicated the anti-tumor role of miR-323a-3p in cancers. However, its role in BC remains largely unknown. Belonging to RNA binding protein PUF family, pumilio RNA binding family member 1 (PUM1) is encoded by the PUM1 gene located on human chromosome 1 p35.2 [Citation18]. It has been unearthed that PUM1 gene was the most stable gene among the BC tissue samples [Citation19] and PUM1 silencing prevented pancreatic adenocarcinoma progression [Citation20]. Here, we aim to explore the role of the NORAD/miR-323a-3p/PUM1/eIF2 axis during BC development, and we speculated that NORAD may bind to miR-323a-3p, which targets PUM1 to affect biological functions of BC cells through the eIF2 signaling pathway.
Materials and methods
Ethics statement
Written informed consents were acquired from all patients before this study. The protocol of this study was confirmed by the Ethic Committee of The Central Hospital of Wuhan, Tongji Medical College, Huazhong University of Science and Technology and based on the ethical principles for medical research involving human subjects of the Helsinki Declaration. Animal experiments were strictly in accordance with the Guide to the Management and Use of Laboratory Animals issued by the National Institutes of Health. The protocol of animal experiments was approved by the Institutional Animal Care and Use Committee of The Central Hospital of Wuhan, Tongji Medical College, Huazhong University of Science and Technology.
Study subjects
BC tissues and adjacent normal tissues were harvested from 108 female patients (aging 38–65 years, median age at 49 years) accepted treatment in The Central Hospital of Wuhan, Tongji Medical College, Huazhong University of Science and Technology from December 2011 to March 2012. Patients accepted neoadjuvant chemo- or radiotherapy were excluded.
Cell culture
Human BC cell lines MCF-7, MDA-MB-231, MDA-MB-468, MDA-MB-453 and T47D, and human mammary cell-line MCF10A were obtained from American Type Culture Collection (VA, USA). MCF10A cells were incubated in Roswell Park Memorial Institute (RPMI)-1640 containing 10% fetal bovine serum (FBS) and 1% penicillin-streptomycin (P/S); BC cell lines were incubated in Dulbecco’s modified Eagle medium (DMEM) with 10%FBS and 1% P/S.
Cell transfection
MDA-MB-453 cells were seeded at 6-well plates (3 × 10⁵ cells/well) and, respectively, transfected with NORAD-negative control (NC), short hairpin RNA (sh)-NORAD, overexpression (oe)-NORAD, miR-323a-3p-NC, miR-323a-3p-mimic, miR-323a-3p-inhibitor, sh-NC + inhibitor-NC, sh-NORAD + inhibitor-NC, sh-NORAD + miR-323a-3p-inhibitor, oe-NC + si-NC, oe-NC + si-PUM1 or oe-NORAD + si-PUM1 using Lipofectamine 2000 (Invitrogen Inc., CA, USA) for 72 h. MiR-323a-3p-mimic/inhibitor, sh-NORAD and sh-NC were obtained from RiboBio Co., Ltd. (Guangdong, China); pBudCE4.1 vector targeting NORAD and its NC (blank pBudCE4.1 vector) were constructed by Genechem Co., Ltd. (Shanghai, China) [Citation21].
3-(4,5-dimethyl-2-thiazolyl)-2,5-diphenyl-2-H-tetrazolium bromide (MTT) assay
MTT assay was performed to assess the cell viability as described previously [Citation22] and the absorbance at 570 nm was determined using a microplate reader (BMG Labtech, Germany).
Colony formation assay
Single-cell suspension was prepared and seeded at 96-well plates (CoStar Group Inc., Washington D.C., USA) at 500 cells/well for 2-w culture. Then, cells were fixed and then stained with 1% crystal violet dye solution. The colonies were examined and counted under a microscope.
Transwell assay
The migration and invasion of MDA-MB-453 cells were evaluated using Transwell chamber (Costar) according to the description in a former literature [Citation23]. Matrigel was used in the invasion assay but not migration assay. Crystal violet dye solution was used for staining and the invasive and migrated cells were counted under a microscope.
Reverse transcription quantitative polymerase chain reaction (RT-qPCR)
Total RNA was extracted using Trizol kits (Invitrogen) and reversely transcribed into cDNA using GoScript reverse transcription system (Promega, WI, USA). Primers () were amplified using SYBR Premix Dimmer (TaKaRa Biotechnology Co., Ltd., Liaoning, China) with glyceraldehyde phosphate dehydrogenase (GAPDH) and U6 as the internal references. Data were analyzed with 2−ΔΔCt method [Citation23].
Table 1. Primer sequence
Western blot analysis
Total protein was extracted and conducted with gel electrophoresis (PCG2001, Sigma). Transferred onto membranes (P2938, Sigma), the proteins were incubated with appropriate primary and secondary antibodies (). β-actin was used as the internal reference and the protein bands were analyzed using the chemiluminescent system (Merck KGaA, Darmstadt, Germany) [Citation24].
Table 2. Antibody information
Subcutaneous tumorigenesis in nude mice
Thirty-six male BALB/c-nu/nu nude mice (aging 4 w, 19.0 g; SLAC Laboratory Animal Co., Ltd., Shanghai, China) were fed under humidity of 50 ± 5%, temperature at 24 ± 2°C and 12 h day/night cycle with standard rodent food and water. The nude mice were randomly classified into six groups and, respectively, injected with 0.2 mL single-cell suspension (1 × 10⁷ cells/mL) transfected with small interfering RNA (si)-NC, si-NORAD, NC-mimic, miR-323a-3p-mimic, si-NORAD + NC-inhibitor, or si-NORAD + miR-323a-3p-inhibitor at back [Citation25]. The length and width of xenografts were measured each week to evaluate the volume. Mice were euthanized after 4 w with the xenografts resected and weighed. The tumor tissue sections were prepared [Citation26].
Terminal deoxynucleotidyl transferase-mediated deoxyuridine triphosphate nick end-labeling (TUNEL) staining
The 4-µm tumor sections were conducted with TUNEL staining referring to a publication [Citation26] and the images were collected using a fluorescent microscope.
Immunohistochemical staining
Sections were dewaxed, incubated with antibody (1:100) in at 4°C overnight and coupled using SignalItain®Boost IHC kits (Cell Signaling Technology, MA, USA) for 2 h. Treated with diaminobenzidine, the sections were counterstained with hematoxylin (Sigma) and sealed. An optical microscope (Olympus, Tokyo, Japan) was used for observation under the Olympus 600 automatic biochemical analyzer [Citation27].
RNA pull-down assay
Biotinylated miRNAs: wild-type miR-323a-3p (Bio-323a-3p-WT), mutant-type miR-323a-3p (Bio-323a-3p-MUT) and a random miRNA did not complementary to PUM1 or NORAD (Bio-NC, used as the NC) were co-cultured with cells. The RNA-protein complex and magnetic beads were mixed to prepare the probe-magnetic bead complex. The total RNA was extracted using Trizol and PUM1 and NORAD expression was assessed using RT-qPCR [Citation28,Citation29].
RNA immunoprecipitation (RIP)
Magna-RNA binding protein immunoprecipitation kit (Millipore, MA, USA) was utilized for detection. RIP buffer containing human anti-Ago2 antibody (ab186733, Abcam) coupled magnetic beads or normal mouse immunoglobulin G was added to the cell lysate and incubated with proteinase K. The immunoprecipitated RNA was further isolated, and the concentration was evaluated by spectrophotometer (Thermo Scientific, MA, USA) and RNA quality by a bio-analyzer (Agilent, CA, USA). Finally, the RNA was extracted, purified and detected by RT-qPCR.
Dual luciferase reporter gene assay
Binding sites between NORAD and miR-323a-3p were predicted at ENCORI (http://starbase.sysu.edu.cn/). WT or MUT NORAD 3ʹUTR sequence was inserted into pmir-GLO-vector (Promega). The 100 ng pmirGLO-NORAD-WT and pmirGLO-NORAD-MUT were co-transfected with miR-323a-3p or its NC into cells for 24 h [Citation30]. The luciferase activity was detected. The WT or MUT PUM1 3ʹUTR was inserted into pmirGLO to produce PUM1 3ʹUTR-WT or PUM1 3ʹUTR-MUT, and the luciferase activity was detected as described above.
Statistical analysis
All data analyses were conducted using SPSS 21.0 software (IBM, NY, USA). The measurement data conforming to the normal distribution were expressed as mean ± standard deviation. The unpaired t-test was performed for comparisons between two groups and one-way analysis of variance (ANOVA) was used for comparisons among multiple groups, followed by Tukey’s post hoc test. P value < 0.05 was indicative of statistically significant difference.
Results
NORAD is upregulated in BC
NORAD expression in clinical samples was determined, and we found the significant high NORAD expression in BC tissues (). Moreover, as shown in , the high NORAD expression was correlated with clinical stage, tumor size, histological grade and lymph node metastasis (LNM), while was not related to age of BC patients. Then, NORAD expression in cell lines was assessed as well, and it was discovered that NORAD was upregulated in BC cell lines. Among these BC cell lines, MDA-MB-453 cell line had the highest NORAD expression (). These results indicated that NORAD was highly expressed in BC.
Table 3. Correlation between NORAD expression and clinicopathological characteristics of BC patients
Figure 1. NORAD is upregulated in BC; NORAD inhibition suppresses malignancy of BC cells and NORAD overexpression has opposite effect. A, NORAD expression in BC tissues and adjacent normal tissues detected using RT-qPCR (n = 108); B, NORAD expression in BC cell lines and human mammary cell line MCF10A detected using RT-qPCR; C, NORAD expression in MDA-MB-453 cells detected using RT-qPCR after transfection of NORAD-NC, sh-NORAD, or oe-NORAD; D, viability of MDA-MB-453 cells assessed using CCK-8 assay after transfection of NORAD-NC, sh-NORAD, or oe-NORAD; E, colony formation ability of MDA-MB-453 cells assessed using colony formation assay after transfection of NORAD-NC, sh-NORAD, or oe-NORAD; F, migration and invasion of MDA-MB-453 cells assessed using Transwell assay after transfection of NORAD-NC, sh-NORAD, or oe-NORAD (repetitions = 3); the measurement data conforming to the normal distribution were expressed as mean ± standard deviation, unpaired t-test was performed for comparisons between two groups and one-way ANOVA was used for comparisons among multiple groups, followed by Tukey’s post hoc test; A/B:* P < 0.05 vs the MCF10A cell line.C-F: * P < 0.05 vs the NORAD-NC group
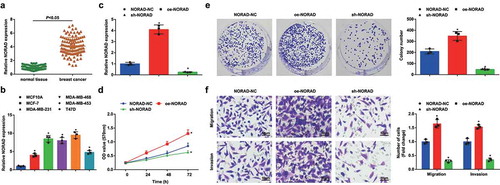
NORAD inhibition suppresses malignancy of BC cells and NORAD overexpression has opposite effect
MDA-MB-453 cells were, respectively, transfected with NORAD-NC, sh-NORAD or oe-NORAD and RT-qPCR detection verified the transfection was successful in MDA-MB-453 cells (). Next, the viability, migration and invasion of MDA-MB-453 cells were measured through MTT assay and colony formation assay (, e) and Transwell (). The findings suggested that in NORAD-deficient MDA-MB-453 cells, their viability, invasion and migration were impaired, while in NORAD-overexpressing MDA-MB-453 cells, the situation went in an opposite way.
MiR-323a-3p upregulation inhibits malignancy of BC cells and miR-323a-3p downregulation has opposite effects
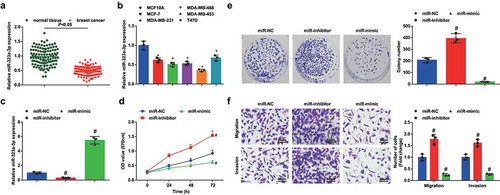
MiR-323a-3p expression was determined, and we found that it was downregulated in BC tissues and cell lines (, b). Then, MDA-MB-453 cells were, respectively, transfected with miR-323a-3p-mimic or miR-323a-3p-inhibitor to successfully up- or downregulate miR-323a-3p (). According to the results of our experiments (), it was revealed that MDA-MB-453 cells with upregulated miR-323a-3p showed restricted viability, migration and invasion, while those with downregulated miR-323a-3p were in the reverse state.
Figure 2. MiR-323a-3p upregulation inhibits malignancy of BC cells and miR-323a-3p downregulation has opposite effects. A, miR-323a-3p expression in BC tissues and adjacent normal tissues detected using RT-qPCR (n = 108); B, miR-323a-3p expression in BC cell lines and human mammary cell line MCF10A detected using RT-qPCR; C, miR-323a-3p expression in MDA-MB-453 cells detected using RT-qPCR after transfection of miR-323a-3p NC, miR-323a-3p mimic, or miR-323a-3p inhibitor; D, viability of MDA-MB-453 cells assessed using CCK-8 assay after transfection of miR-323a-3p NC, miR-323a-3p mimic, or miR-323a-3p inhibitor; E, colony formation ability of MDA-MB-453 cells assessed using colony formation assay after transfection of miR-323a-3p NC, miR-323a-3p mimic, or miR-323a-3p inhibitor; F, migration and invasion of MDA-MB-453 cells assessed using Transwell assay after transfection of miR-323a-3p NC, miR-323a-3p mimic, or miR-323a-3p inhibitor; repetitions = 3; the measurement data conforming to the normal distribution were expressed as mean ± standard deviation, unpaired t-test was performed for comparisons between two groups and one-way ANOVA was used for comparisons among multiple groups, followed by Tukey’s post hoc test; * P < 0.05 vs the MCF10A cell line; # P < 0.05 vs the miR-NC group
NORAD competitively binds to miR-323a-3p
To ensure the interaction between NORAD and miR-323a-3p, the binding sites between NORAD and miR-323a-3p was predicted at http://starbase.sysu.edu.cn/(). Then, dual luciferase reporter experiment further detected that the co-transfection of NORAD-WT and miR-323a-3p mimic suppressed the luciferase activity in MDA-MB-453 cells (). To further prove the endogenous binding of miR-323a-3p and NORAD, RIP assay () was conducted and showed that miR-323a-3p and NORAD were enriched in the immunoprecipitation of Ago2. RNA pull down showed that the relative abundance of NORAD was elevated by Bio-323a-3p-WT (). The results indicated that miR-323a-3p had sequence specificity for the recognition of NORAD.
Figure 3. NORAD competitively binds to miR-323a-3p. A, binding sites between NORAD and miR-323a-3p obtained from Starbase; B, binding relationship between NORAD and miR-323a-3p confirmed using dual luciferase reporter gene assay; C, the endogenous binding of miR-323a-3p and NORAD assessed using RIP; D, the binding of NORAD-WT and miR-323a-3p assessed using RNA pull down assay; E, expression of miR-323a-3p in MDA-MB-453 cells assessed using RT-qPCR after transfection of NORAD-NC, sh-NORAD, or oe-NORAD; F, correlation between expression of miR-323a-3p and NORAD; G, NORAD and miR-323a-3p expression in the sh-NC + inhibitor-NC, sh-NORAD + inhibitor-NC and sh-NORAD + miR-inhibitor groups detected using RT-qPCR; H, cell viability of the sh-NC + inhibitor-NC, sh-NORAD + inhibitor-NC and sh-NORAD + miR-inhibitor groups detected using MTT assay; I, colony formation ability of the sh-NC + inhibitor-NC, sh-NORAD + inhibitor-NC and sh-NORAD + miR-inhibitor groups detected using colony formation assay; J, migration and invasion of the sh-NC + inhibitor-NC, sh-NORAD + inhibitor-NC and sh-NORAD + miR-inhibitor groups detected using Transwell assay; repetitions = 3; the measurement data conforming to the normal distribution were expressed as mean ± standard deviation and one-way ANOVA was used for comparisons among multiple groups, followed by Tukey’s post hoc test; * P < 0.05 vs the co-transfection group of NORAD-WT and miR-NC; # P < 0.05 vs the NORAD-NC group; $ P < 0.05 vs the sh-NC + inhibitor-NC group
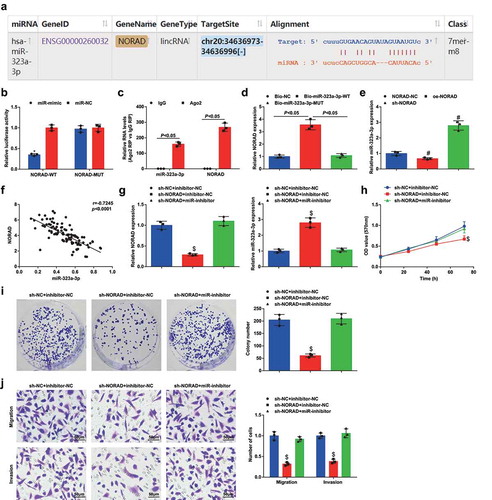
miR-323a-3p levels in MDA-MB-453 cells altering NORAD expression was determined and we found that miR-323a-3p expression was increased after NORAD was silenced, while miR-323a-3p expression was decreased after NORAD was restored (). Furthermore, NORAD and miR-323a-3p levels were found in a negative relationship ().
Next, rescue assays were conducted to verify miR-323a-3p involving in NORAD-mediated BC progression. MDA-MB-453 cells were transfected with NORAD- and miR-323a-3p-related vector (the groups were hereinafter referred to as the sh-NC + inhibitor-NC, sh-NORAD + inhibitor-NC, and sh-NORAD +miR-inhibitor groups). It was found from RT-qPCR that miR-323a-3p inhibitor reversed sh-NORAD-induced promotion of miR-323a-3p expression (). Detection of cellular biological functions implied that down-regulating miR-323a-3p mitigated the role of silenced NORAD for the aggressiveness of MDA-MB-453 cells ().
PUM1 is upregulated in BC and is targeted by miR-323a-3p
The related target genes of miR-323a-3p were analyzed at Targetscan and the miTG score (0.98) of the target gene was screened at DIANA. The binding sites were confirmed at Starbase. Then, PUM1, having binding sites with miR-323a-3p and related to tumor proliferation and migration, was selected as the candidate gene (, b). PUM1 expression in tissues and cell lines was detected through RT-qPCR and Western blot, and we found that it was upregulated in BC tissues and cell lines (, d).
Figure 4. PUM1 is upregulated in BC and is targeted by miR-323a-3p. A&B, Targetscan (http://www.targetscan.org/) analyzed miR-323a-3p related target genes, and DIANA website (http://diana.imis.athena-innovation.gr/DianaTools/index.php?r=microT_CDS/index) screened the miTG score of the target gene was 0.98, and Starbase (http://starbase.sysu.edu.cn/) verified the binding site; C, PUM1 expression in BC tissues and adjacent normal tissues detected using RT-qPCR and Western blot (n = 108); D, PUM1 expression in BC cell lines and human mammary cell line MCF10A detected using RT-qPCR; E, targeting relationship between miR-323a-3p and PUM1 confirmed using dual luciferase reporter gene assay; F, targeting relationship between miR-323a-3p and PUM1 confirmed using RNA pull-down assay; G, correlation between expression of miR-323a-3p and PUM1; H, correlation between expression of NORAD and PUM1; repetitions = 3; the measurement data conforming to the normal distribution were expressed as mean ± standard deviation and one-way ANOVA was used for comparisons among multiple groups, followed by Tukey’s post hoc test; * P < 0.05 vs the MCF10A cell line; # P < 0.05 vs the co-transfection group of PUM1-WT and miR-NC; $ P < 0.05 vs the Bio-NC group
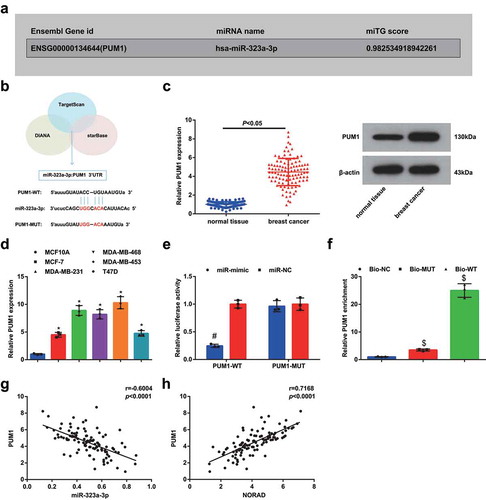
The dual luciferase reporter gene assay revealed that the co-transfection of PUM1-WT and miR-323a-3p-mimic suppressed the luciferase activity, indicating the targeting relationship between PUM1 and miR-323a-3p (), which was further confirmed using RNA pull-down assay (). The correlation among expression of PUM1, NORAD and miR-323a-3p was analyzed and it was observed that PUM1 expression was negatively related to miR-323a-3p expression while was positively related to NORAD expression (, h).
NORAD/miR-323a-3p/PUM1/eIF2 functions through an axial relationship
PUM1 has been reported to affect the eIF2 signaling pathway and regulate the expression of key proteins (p-PERK, p-EIF2A and ATF4) in the pathway [Citation20]. In order to identify the axial relationship of NORAD, miR-323a-3p, PUM1 and eIF2, we detected PUM1 expression through RT-qPCR and contents of PUM1, p-PERK, p-EIF2 and ATF4 using Western blot analysis. The outcomes () reflected that NORAD positively while miR-323a-3p negatively regulated PUM1 expression; NORAD and miR-323a-3p in combination could regulate PUM1 expression; PUM1 and PERK/eIF2/ATF4 signaling pathway were both simultaneously affected by NORAD and miR-323a-3p. These findings revealed the existence of the NORAD/miR-323a-3p/PUM1/eIF2 axis.
Figure 5. NORAD/miR-323a-3p/PUM1/eIF2 functions through an axial relationship. A, PUM1 expression in MDA-MB-453 cells detected using RT-qPCR after transfection of NORAD-NC, sh-NORAD, or oe-NORAD; B, PUM1 expression in MDA-MB-453 cells detected using RT-qPCR after transfection of miR-323a-3p NC, miR-323a-3p mimic, or miR-323a-3p inhibitor; C, PUM1 expression in the NORAD-NC + miR-NC, sh-NORAD + miR-NC and sh-NORAD + miR-inhibitor expression detected using RT-qPCR; D, protein contents of PUM1, p-PERK, p-EIF2 and ATF4 detected using Western blot analysis; E, the absorbance at 570 nm at different time points (0, 24, 48, 72 h) detected using MTT; F, the number of colonies detected using colony formation experiment; G, the migration and invasion detected using Transwell method. repetitions = 3; the measurement data conforming to the normal distribution were expressed as mean ± standard deviation and one-way ANOVA was used for comparisons among multiple groups, followed by Tukey’s post hoc test; * P < 0.05 vs the NORAD-NC group; # P < 0.05 vs the miR-323a-3p-NC group; $ P < 0.05 vs the NORAD-NC + miR-323a-3p-NC group; & P < 0.05 vs the oe-NC + si-NC group; ^ P < 0.05 vs the oe-NC + si-PUMI group
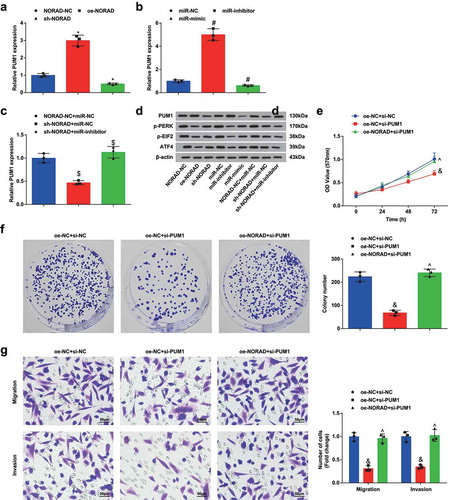
To further explore whether NORAD affects BC proliferation and migration through the miR-323a-3p/PUM1/eIF2 axis, we co-transfected oe-NORAD and sh-PUM1 into MDA-MB-453 cells and conducted a series of cell experiments to reveal that suppression of PUM1 reduced upregulated NORAD-induced enhancement of proliferation, migration and invasion capabilities of BC cells ().
NORAD silencing or miR-323a-3p elevation represses the tumor growth in BC nude mice
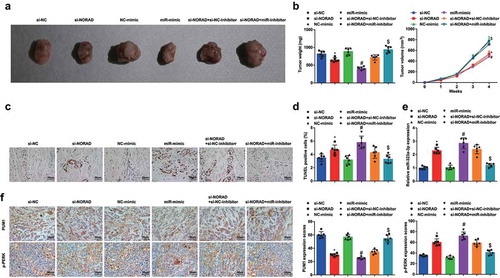
The results of in vivo experiment indicated that the volume and weight of xenografts from nude mice stimulated by NORAD inhibition or miR-323a-3p upregulation were both restricted, and the apoptosis in the tumors was promoted; the suppressive role of NORAD inhibition in tumor growth was reversed by miR-323a-3p reduction (). miR-323a-3p expression in the xenografts was determined and we found that its expression was increased after NORAD was inhibited (). Moreover, the immunohistochemical staining revealed that the staining tendencies of PUM1 and p-PERK were contrary (). These data suggested that the NORAD/miR-323a-3p/PUM1/eIF2 axis regulated the development of BC in vivo.
Figure 6. NORAD silencing or miR-323a-3p elevation represses the tumor growth in BC nude mice. A, representative images of xenografts resected from nude mice injected with transfected MDA-MB-453 cells; B, weight and volume of xenografts resected from nude mice injected with transfected MDA-MB-453 cells; C, representative images of TUNEL staining of xenografts resected from nude mice injected with transfected MDA-MB-453 cells; D, ratio of TUNLE positive cells in xenografts resected from nude mice injected with transfected MDA-MB-453 cells; E, miR-323a-3p in xenografts resected from nude mice injected with transfected MDA-MB-453 cells; F, PUM1 and p-PERK expression in xenografts resected from nude mice injected with transfected MDA-MB-453 cells was detected using immunohistochemical staining (200 ×); n = 6; the measurement data conforming to the normal distribution were expressed as mean ± standard deviation and one-way ANOVA was used for comparisons among multiple groups, followed by Tukey’s post hoc test; * P < 0.05 vs the si-NC group; # P < 0.05 vs the NC-mimic group; $ P < 0.05 vs the si-NORAD + NC-inhibitor group
Discussion
BC is the most prevalent cause of cancer-associated deaths among women and the 2nd most prevalent cancer-related deaths in developed countries after lung cancer [Citation31]. We performed this research to study the role of the NORAD/miR-323a-3p/PUM1/eIF2 axis in biological processes of BC cells, and we found that the downregulation of NORAD or elevation of miR-323a-3p restricted the malignant behaviors of BC cells via inhibiting PUM1 through the eIF2 signaling pathway.
NORAD has been reported as an oncogene in many human cancers and was frequently upregulated. For instance, Tian et al. have found that NORAD was upregulated in both hepatocellular carcinoma tissues and cells [Citation10], and it has been revealed that the expression level of NORAD was increased in lung cancer tissues and cells [Citation11]. Thus, here we also detected NORAD expression in tissues and cell lines to confirm whether it is abnormally expressed in BC, and it was found that NORAD exhibited a higher expression level in BC tissues and cell lines. Moreover, we analyzed the correlation between NORAD expression and the clinicopathological characteristics of BC patients. The data indicated that high NORAD expression was related to high histological grade, larger tumor size, late clinical stage and LNM, indicating the predictive role of NORAD in BC prognosis. Similarly, a former study has shown that high expression of NORAD was correlated with larger tumor size and T stage in esophageal squamous cell carcinoma [Citation32]. In view of the aberrant expression of NORAD in BC, the screened MDA-MB-453 cells in our research was transfected with upregulated or silenced NORAD plasmid vector to observe the role of altered NORAD in BC cell growth. Our results came out that NORAD inhibition suppressed the viability, migration and invasion of BC cells in vitro, and repressed the tumor growth in vivo. Oppositely, NORAD overexpression had totally contrary effects. Consistently with our findings, it has been elucidated that NORAD could promote the growth and proliferation of gastric cancer cells both in vivo and in vitro [Citation33]. Zhang et al. have demonstrated that NORAD knockdown inhibited prostate cancer cell growth [Citation34]. Additionally, the increased expression of NORAD in BC tissues has been found to promote proliferation, invasion and migration of BC cells and relate to worse prognosis [Citation12]. Furthermore, lncRNAs are known to function as competing endogenous RNAs (ceRNAs) in pathology. ceRNAs are transcripts regulating each other at the post-transcriptional level by acting as natural molecular sponge for miRNAs [Citation35]. It has been validated that NORAD downregulation repressed prostate cancer progression through competitively binding to miR-495-3p [Citation9], and NORAD has also been reported to accelerate the progression of neuroblastoma through functioning as a sponge of miR-144-3p [Citation36]. The spongy relationship between NORAD and miR-323a-3p was confirmed using bioinformatic prediction and dual luciferase in our research, which is a novel finding remains scarcely studied.
Here we also detected miR-323a-3p expression in BC, and we found that miR-323a-3p was downregulated in BC tissues and cell lines. Consistently, Chen et al. have observed that miR-323a-3p was significantly downregulated in osteosarcoma [Citation17], and it has been demonstrated that miR-323a-3p was lowly expressed in bladder cancer tissues and 3 bladder cancer cell lines, respectively, compared with adjacent non-cancerous tissues and the normal bladder cell line [Citation37]. In our research, the BC cells were transfected to detect the role of miR-323a-3p in BC cell phenotypes. It was found in our experiments that the upregulation of miR-323a-3p restricted viability, migration and invasion of BC cells in vitro, and inhibited tumor growth in vivo. Similar to our findings, Bjeije et al. have proposed that the upregulation of miR-323a-3p reduced the proliferation and cell cycle progression, and promoted the apoptosis of colorectal cancer cells [Citation38]. Moreover, we have confirmed the existence of the targeting relationship between miR-323a-3p and PUM1, which remains largely unknown. As observed in our research, PUM1 was upregulated in BC tissues and cells, and could regulate the eIF2 signaling pathway. In line with our findings, a previous study has revealed that the PUM1 protein level was higher in ovarian cancer tissues than in adjacent tissue [Citation18]. In addition, PUM1 inhibition has been found to prevent pancreatic adenocarcinoma progression [Citation20]. These data provided a theoretical basis for revealing the molecular mechanisms in BC.
In summary, we found that the inhibition of NORAD or elevation of miR-323a-3p restricted the malignant behaviors of BC cells through inhibiting PUM1 via the eIF2 signaling pathway. This study may provide novel biomarkers of the treatment of BC. However, more efforts are still needed to further the understanding of molecular mechanism on BC.
Acknowledgments
We acknowledge and appreciate our colleagues for their valuable suggestions and technical assistance for this study.
Disclosure statement
No potential conflict of interest was reported by the author(s).
Additional information
Funding
References
- Thorat MA, Cuzick J. Preventing invasive breast cancer using endocrine therapy. Breast. 2017;34(Suppl 1):S47–S54.
- Grover S, Martei YM, Puri P, et al. Breast Cancer and HIV in sub-saharan Africa: a complex relationship. J Glob Oncol. 2018;4:1–11.
- Agnieszka K , Marzena K , Katarzyna S, et al. Primary and secondary prevention of breast cancer. Ann Agric Environ Med. 2017;24(4):549–553.
- Geffken K, Spiegel S. Sphingosine kinase 1 in breast cancer. Adv Biol Regul. 2018;67:59–65.
- Chen S, Wang H, Huang Y F, et al. WW domain-binding protein 2: an adaptor protein closely linked to the development of breast cancer. Mol Cancer. 2017;16(1):128.
- Hao WY, Guo LW, Luo J, et al. LncRNA TUG1 promotes growth and metastasis of cholangiocarcinoma cells by inhibiting miR-29a. Cancer Manag Res. 2020;12:11103–11111.
- Kong Q, Qiu M. Long noncoding RNA SNHG15 promotes human breast cancer proliferation, migration and invasion by sponging miR-211-3p. Biochem Biophys Res Commun. 2018;495(2):1594–1600.
- Li H, Zhu L, Xu L, et al. Long noncoding RNA linc00617 exhibits oncogenic activity in breast cancer. Mol Carcinog. 2017;56(1):3–17.
- Chen F, Liu L, Wang S. Long non-coding RNA NORAD exhaustion represses prostate cancer progression through inhibiting TRIP13 expression via competitively binding to miR-495-3p. Cancer Cell Int. 2020;20:323.
- Tian Q, Yan X, Yang L, et al. lncRNA NORAD promotes hepatocellular carcinoma progression via regulating miR-144-3p/SEPT2. Am J Transl Res. 2020;12(5):2257–2266.
- Li J, Xu X, Wei C, et al. Long noncoding RNA NORAD regulates lung cancer cell proliferation, apoptosis, migration, and invasion by the miR-30a-5p/ADAM19 axis. Int J Clin Exp Pathol. 2020;13(1):1–13.
- Zhou K, Ou Q, Wang G, et al. High long non-coding RNA NORAD expression predicts poor prognosis and promotes breast cancer progression by regulating TGF-beta pathway. Cancer Cell Int. 2019;19(1):63.
- Zhong Q, Wang L, Qi Z, et al. Long non-coding RNA TUG1 modulates expression of elastin to relieve bronchopulmonary dysplasia via sponging miR-29a-3p. Front Pediatr. 2020;8:573099.
- Tang W, Zhang X , Tan W, et al. miR-145-5p suppresses breast cancer progression by inhibiting SOX2. J Surg Res. 2019;236:278–287.
- Zheng P, Dong L, Zhang B, et al. Long noncoding RNA CASC2 promotes paclitaxel resistance in breast cancer through regulation of miR-18a-5p/CDK19. Histochem Cell Biol. 2019;19(1):281–291.
- Shahar T, Granit A, Zrihan D, et al. Expression level of miRNAs on chromosome 14q32.31 region correlates with tumor aggressiveness and survival of glioblastoma patients. J Neurooncol. 2016;130(3):413–422.
- Chen H, Gao S, Cheng C. MiR-323a-3p suppressed the glycolysis of osteosarcoma via targeting LDHA. Hum Cell. 2018;31(4):300–309.
- Guan X, Chen S, Liu Y, et al. PUM1 promotes ovarian cancer proliferation, migration and invasion. Biochem Biophys Res Commun. 2018;497(1):313–318.
- Kilic Y, Celebiler AC, Sakizli M. Selecting housekeeping genes as references for the normalization of quantitative PCR data in breast cancer. Clin Transl Oncol. 2014;16(2):184–190.
- Dai H, Shen K, Yang Y, et al. PUM1 knockdown prevents tumor progression by activating the PERK/eIF2/ATF4 signaling pathway in pancreatic adenocarcinoma cells. Cell Death Dis. 2019;10(8):595.
- Ghasemi-Dehkordi P, Doosti A, Jami MS. The functions of azurin of Pseudomonas aeruginosa and human mammaglobin-A on proapoptotic and cell cycle regulatory genes expression in the MCF-7 breast cancer cell line. Saudi J Biol Sci. 2020;27(9):2308–2317.
- Du L, Liu X, Ren Y, et al. Loss of SIRT4 promotes the self-renewal of breast cancer stem cells. Theranostics. 2020;10(21):9458–9476.
- Liao SA, Guan J, Mo H, et al. lncRNA LSINCT5 regulates mir-20a-5p/XIAP to inhibit the growth and metastasis of osteosarcoma cells. Onco Targets Ther. 2020;13:8209–8221.
- Zhang Z, Guo M, Shen M, et al. The BRD7-P53-SLC25A28 axis regulates ferroptosis in hepatic stellate cells. Redox Biol. 2020;36:101619.
- Luo X, Liu X, Tao Q, et al. Enoxacin inhibits proliferation and invasion of human osteosarcoma cells and reduces bone tumour volume in a murine xenograft model. Oncol Lett. 2020;20(2):1400–1408.
- Zhu J, Shi L, Du G, et al. Upregulated SET promotes cell survival through activating Akt/NF-kappaB signal in colorectal carcinoma. Cancer Manag Res. 2020;12:4735–4745.
- Jaeckel S, Kaller M, Jackstadt R, et al. Ap4 is rate limiting for intestinal tumor formation by controlling the homeostasis of intestinal stem cells. Nat Commun. 2018;9(1):3573.
- Sun CC, Zhu W, Li S-J, et al. FOXC1-mediated LINC00301 facilitates tumor progression and triggers an immune-suppressing microenvironment in non-small cell lung cancer by regulating the HIF1alpha pathway. Genome Med. 2020;12(1):77.
- Jiang Y, Zhou J, Zhao J, et al. The U2AF2/circRNA ARF1/miR-342-3p/ISL2 feedback loop regulates angiogenesis in glioma stem cells. J Exp Clin Cancer Res. 2020;39(1):182.
- Pu JT, Hu Z, Zhang DG, et al. MiR-654-3p suppresses non-small cell lung cancer tumourigenesis by inhibiting PLK4. Onco Targets Ther. 2020;13:7997–8008.
- Warrier S, Tapia G, Goltsman D, et al. An update in breast cancer screening and management. Womens Health (Lond). 2016;12(2):229–239.
- Wu X, Lim ZF, Li ZW, et al. NORAD expression is associated with adverse prognosis in esophageal squamous cell carcinoma. Oncol Res Treat. 2017;40(6):370–374.
- Tao W, Li Y, Zhu M, et al. LncRNA NORAD promotes proliferation and inhibits apoptosis of gastric cancer by regulating miR-214/Akt/mTOR axis. Onco Targets Ther. 2019;12:8841–8851.
- Zhang H, Guo H. Long non-coding RNA NORAD induces cell proliferation and migration in prostate cancer. J Int Med Res. 2019;47(8):3898–3904.
- Klec C, Prinz F, Pichler M. Involvement of the long noncoding RNA NEAT1 in carcinogenesis. Mol Oncol. 2019;13(1):46–60.
- Bw A, Lx A, Ju ZC, et al. LncRNA NORAD accelerates the progression and doxorubicin resistance of neuroblastoma through up-regulating HDAC8 via sponging miR-144-3p. Biomed Pharmacother. 2020;129:110268.
- Li J, Xu X, Meng S, et al. MET/SMAD3/SNAIL circuit mediated by miR-323a-3p is involved in regulating epithelial-mesenchymal transition progression in bladder cancer. Cell Death Dis. 2017;8(8):e3010.
- Bjeije H, Soltani BM, Behmanesh M, et al. YWHAE long non-coding RNA competes with miR-323a-3p and miR-532-5p through activating K-Ras/Erk1/2 and PI3K/Akt signaling pathways in HCT116 cells. Hum Mol Genet. 2019;28(19):3219–3231.