
ABSTRACT
The hypoxia-induced transcription factor HIF1 inhibits cell growth in normoxia through poorly understood mechanisms. A constitutive upregulation of hypoxia response is associated with increased malignancy, indicating a loss of antiproliferative effects of HIF1 in cancer cells. To understand these differences, we examined the control of cell cycle in primary human cells with activated hypoxia response in normoxia. Activated HIF1 caused a global slowdown of cell cycle progression through G1, S and G2 phases leading to the loss of mitotic cells. Cell cycle inhibition required a prolonged HIF1 activation and was not associated with upregulation of p53 or the CDK inhibitors p16, p21 or p27. Growth inhibition by HIF1 was independent of its Asn803 hydroxylation or the presence of HIF2. Antiproliferative effects of hypoxia response were alleviated by inhibition of lactate dehydrogenase and, more effectively, by boosting cellular production of NAD+, which was decreased by HIF1 activation. In comparison to normal cells, various cancer lines showed several fold-higher expressions of NAMPT, which is a rate-limiting enzyme in the main biosynthetic pathway for NAD+. Inhibition of NAMPT activity in overexpressor cancer cells sensitized them to antigrowth effects of HIF1. Thus, metabolic changes in cancer cells, such as enhanced NAD+ production, create resistance to growth-inhibitory activity of HIF1 permitting manifestation of its tumor-promoting properties.Abbreviations: DMOG: dimethyloxalylglycine, DM-NOFD: dimethyl N-oxalyl-D-phenylalanine, NMN: β-nicotinamide mononucleotide
KEYWORDS:
Introduction
HIF1 is a hypoxia-activated transcription factor that is largely responsible for the upregulation of gene expression in low O2[Citation1]. Hypoxia or chemicals that act as hypoxia mimetics increase transcription of more than 1000 genes[Citation2]. HIF1 is a heterodimer composed of a hypoxia-stabilized subunit HIF1α and a stable subunit HIF1β. In normoxia, HIF1α undergoes a rapid degradation following its hydroxylation at two Pro residues by O2-dependent dioxygenases PHD1-3 [Citation3–5]. Hydroxylated Pro402 and Pro564 are recognized by the E3 ubiquitin ligase VHL that marks HIF1α for proteolysis by 26S proteasomes [Citation6,Citation7]. The loss of Pro hydroxylation in hypoxia results in HIF1α accumulation, its dimerization with HIF1β and induction of gene expression through binding to the target promoters. The full activation of HIF1α also requires the loss of the FIH-mediated Asn803 hydroxylation, which promotes the recruitment of the transcription coactivators p300/CBP[Citation8]. In addition to O2, both PHDs and FIH also require 2-oxoglutarate and Fe(II) for their hydroxylation activity[Citation1]. Chemicals that mimic hypoxia in their ability to activate HIF1α usually inhibit PHDs and FIH by acting as 2-oxoglutarate analogues or interfering with Fe(II) binding to these enzymes. Operating through these mechanisms are two widely used hypoxia mimetics dimethyloxalylglycine (DMOG) and the iron competitor Co(II). In several types of cancers, high levels of oncometabolites acting as structural mimics of 2-oxoglutarate cause upregulation of HIFα in the absence of hypoxia[Citation9]. Reactive oxygen species and other oxidants are also able to upregulate HIF1α [Citation10–12], which extends its responsiveness to a broad range of xenobiotics and cell stress-inducing conditions in normoxia. HIF1α stabilization by reactive oxygen species is linked to oxidation of functionally important Cys-SH groups in PHDs [Citation13,Citation14].
Advanced cancers frequently show elevated HIF1 and upregulation of its gene expression signature [Citation15–18]. HIF1 activity promotes the proliferation of cancer cells and confers more aggressive malignant characteristics, such as increased invasiveness, angiogenesis, and metabolic reprogramming [Citation19,Citation20]. In contrast to its clearly oncogenic role in advanced cancers, HIF1 acts as a tumor suppressor gene in the development of human renal clear cell carcinoma [Citation21] and in mouse models of some other cancers [Citation22,Citation23]. One of the well-established cellular responses to hypoxia is reversible growth arrest [Citation24,Citation25], which limits energy expenditures and may diminish mutagenesis during the hypoxia-induced metabolic stress and DNA repair suppression[Citation26]. In moderate hypoxia, this antiproliferative response was suppressed by the loss of HIF1[Citation27]. The function of the related transcription factor HIF2 has been studied primarily in transformed cells where it promoted proliferation [Citation28,Citation29]. Activation of HIF1 and growth arrest in hypoxia did not involve the upregulation of the stress-responsive transcription factor p53 [Citation30–33]. Antiproliferative effects of HIF1 in hypoxia were associated to a different extent with the transcriptional upregulation of the CDK inhibitors p21 and p27 [Citation25,Citation34,Citation35]. Antigrowth effects of hypoxia response in normoxic cells, especially in normal human cells, are more poorly understood.
Here, we examined cell cycle changes and growth of normoxic primary human cells with activated hypoxia response. We found that hypoxia response in normoxic cells caused HIF1-dependent but HIF2-independent antigrowth effects that were not associated with the induction of p21 or p27. The loss of HIF1α-Asn803 hydroxylation was dispensable for cell cycle inhibition. HIF1 induced a global slowdown of cell cycle and its growth-inhibitory effects stemmed from the prolonged activation of aerobic glycolysis causing cellular accumulation of lactate and depletion of NAD+. Cancer cells were resistant to growth inhibition by HIF1 due to their high expression of the NAD+-producing enzyme NAMPT.
Results
Antigrowth effects of activated HIF1α in primary human cells under normoxia
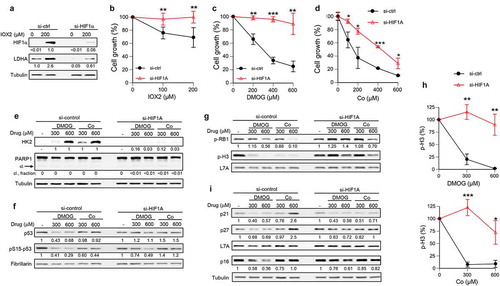
To understand the proliferation-related effects of activated hypoxia signaling, we used WI38 primary human lung fibroblasts grown under a tissues-relevant 5% O2 concentration in media without the addition of the supraphysiological amounts of pyruvate, which may distort metabolic conditions in HIF1/2-activated cells due to their diminished ability to utilize pyruvate for energy production[Citation19]. To avoid the potential growth differences that can arise during prolonged propagation of genetically modified primary cells, we employed siRNA to deplete HIF1α in WI38 cells of the same passage. Transfections with targeted siRNA strongly diminished the protein abundance of HIF1α and suppressed upregulation of its known target, lactate dehydrogenase A (LDHA), in response to a treatment with the PHD inhibitor IOX2 (). To assess the long-term effects of activated hypoxia signaling in normoxia, we treated WI38 cells with hypoxia mimetics that either specifically stabilize HIF1/2 transcription factors (PHD inhibitor IOX2) or act as broad-spectrum inhibitors of 2-oxoglutarate-dependent enzymes (DMOG, Co2+). Co(II) is a carcinogenic metal that is widely used as a hypoxia mimetic inducing HIF1α stabilization and its transcriptional activation [Citation36,Citation37]. Transcriptome changes by DMOG were very close to those produced by the actual hypoxia[Citation2]. Despite their mechanistically distinct modes of activation of hypoxia signaling, all three hypoxia mimetics showed a strong dependency of their cytotoxic/antiproliferative effects on the presence of HIF1α (). This protective effect of HIF1α depletion was observed at all levels of exposures ranging from minimally toxic to 90% toxicity. For the PHD inhibitors IOX2 and DMOG, the knockdown of HIF1α completely rescued their growth-inhibitory effects. A potent stimulation of HIF1αactivity by DMOG or Co(II), as evidenced by a massive upregulation of hexokinase II, did not result in PARP1 cleavage, indicating a lack of apoptosis in response to these hypoxia mimetics (). Consistent with the absence of apoptosis, both DMOG and Co(II) also failed to increase the protein abundance of the proapoptotic transcription factor p53 or trigger its activating phosphorylation at Ser15 (). DMOG-treated cells in fact showed moderately lower levels of p53 and its Ser15 phosphorylation, which may reflect slower rates of replication as replication stress is one of the background triggers of p53 activity. To further analyze the antiproliferative properties of activated HIF1α, we assessed the phosphorylation of the tumor suppressor RB1 at Ser807/811 and histone H3 at Ser10. Histone H3-Ser10 phosphorylation is a mitosis-specific event, whereas RB1 phosphorylation at Ser807/811 by CDK4/6 kinases is the priming event for the subsequent inactivation of this G1-S transition repressor by the CDK2-cyclin E kinase[Citation38]. We found that hypoxia mimetics decreased the extent of RB1 phosphorylation at Ser807/811, which was completely (for DMOG) or nearly completely (for Co2+) rescued by HIF1α knockdown (). Suppressive effects of DMOG and Co(II) on histone-Ser10 phosphorylation in control cells were even more dramatic, indicating a strong inhibition of cell cycle. HIF1α depletion again had potent protective effects, resulting in a complete normalization of phospho-histone H3 levels at lower doses of hypoxia mimetics (). A slowdown of cell cycle in hypoxia was associated with a HIF1-dependent accumulation of the CDK inhibitors p21 and p27 [Citation25,Citation34,Citation35]. The p21 gene is a well-known target of the DNA damage-responsive transcription factor p53[Citation39]. We found no apparent upregulation of p21, p27 or the G1-specific CDK inhibitor p16 in DMOG-treated cells irrespective of their HIF1α status (). In Co(II)-treated cells, the protein abundance of both p21 and p27 CDK inhibitors was increased but only at the highest dose, which occurred in a HIF1α-dependent manner.
Figure 1. Resistance of HIF1α-depleted primary human cells to growth inhibition by hypoxia mimetics
Cell cycle effects of HIF1
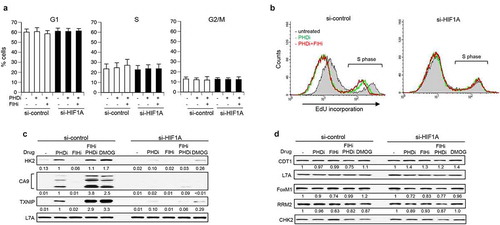
To determine the impact of activated hypoxia signaling on cell cycle, we analyzed the distribution of cells by a two-parameter FACS using EdU (DNA synthesis marker) and DNA staining. 2D-FACS profiles showed a clear separation of cells in G1, S and G2/M phases after treatments with a solvent, the PHD inhibitor IOX2, or IOX2 plus the FIH inhibitor DM-NOFD (Fig. S1). Despite the observed decreases in the amount of phospho-RB1 in hypoxia mimetics-treated cells (), which is indicative of a less efficient entry from G1 to S, the distribution of cells among G1, S and G2/M phases determined from FACS profiles was not significantly altered by the inhibition of HIF-Pro hydroxylation alone or in a combination with the repression of Asn803 hydroxylation (). However, FACS measurements of EdU incorporation showed clearly diminished rates of DNA replication in cells with inhibited PHD or PHD+FIH activities (). The extent of DNA synthesis reduction by the PHD inhibitor was not affected by the addition of the FIH inhibitor, indicating that the transactivation of a limited group of genes controlled by the FIH-mediated hydroxylation of HIF1α at Asn803 is not involved in replication-repressive effects of hypoxia signaling. One of the genes with increased transactivation upon inhibition of Asn803 hydroxylation in HIF1-stabilized cancer cells is carbonic anhydrase IX[Citation2]. We also observed a further upregulation of CA9 in the PHD-inhibited cells by the inactivation of FIH, confirming the effectiveness of FIH inhibition under our conditions (). TXNIP was another protein showing a strong hyperaccumulation in cells treated with DMOG or PHD+FIH inhibitors relative to the PHD-only inhibited cells. Increases in the protein abundance of TXNIP by hypoxia mimetics were strictly HIF1α-dependent. TXNIP acts as a repressor of glucose uptake and its upregulation in cells with activated HIF1α represents a negative feedback response triggered by the accumulation of glycolytic products, especially glucose-6-phosphate generated by hexokinase activity[Citation40]. Upregulation of HK2 was comparable among cells treated with the PHD inhibitor alone, PHD inhibitor + FIH inhibitor, or DMOG (), indicating that accumulation of TXNIP was not a linear measure of HK2 protein expression. Inhibition of FIH activity alone had no effect on the protein levels of HK2, CA9 or TXNIP. As a second approach for the determination of the distribution of cells among different cell cycle phases, we examined the expression of proteins that show a strong cell cycle dependence[Citation41]. We found that neither DMOG nor inhibitors of PHD±FIH activity led to appreciable changes in the protein abundance of the G1 marker CDT1, S phase-inducible ribonucleotide reductase subunit RRM2 or G2-inducible FoxM1 (). Similar to DMOG treatments, stabilization of HIF1α by inhibition of PHDs with and without suppression of Asn803 hydroxylation was not associated with upregulation of the CDK inhibitors p21 and p27 or changes in protein levels of the G1/S-promoting phosphatase CDK25A (Fig. S2).
Figure 2. Analysis of cell cycle in cells treated with hypoxia mimetics
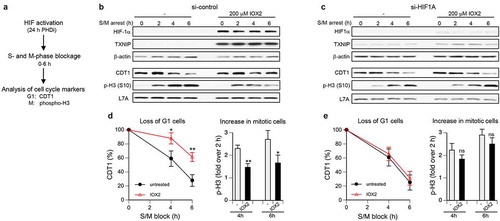
The absence of significant changes in the distribution of cells among G1, S and G2 phases despite slower rates of DNA replication suggested that activated HIF1 could be causing a global slowdown of cell cycle. To test this possibility, we monitored the cell cycle progression for 0–6 h after arrest of cells in S-phase and mitosis by the addition of the DNA polymerase inhibitor aphidicolin and the mitosis inhibitor nocodazole, respectively (). These manipulations did not result in changes in TXNIP induction, indicating the cell cycle-independence of metabolic changes by activated HIF1 (). S- and M-phase blockage in control cells caused a clear time-dependent decrease in the abundance of the G1-specific protein CDT1, which reflects its degradation upon the entry of G1 cells into S-phase and the lack of the inflow of cells into G1 from mitosis. Cells with activated hypoxic signaling by the PHD inhibitor IOX2 showed a diminished progression from G1 to S, as judged by a significantly slower disappearance CDT1 at 4- or 6-h long blockage in S- and M-phases (). High HIF activity also caused a slower progression of G2 cells into mitosis, as evident by smaller increases in phospho-H3 after 4 and 6 h incubations with the S/M-blockers in comparison to the 2 h time point (). When HIF1α was depleted with siRNA, PHD-inhibited and untreated cells showed similar decreases in CDT1 (), indicating elimination of the differences in G1-S progression rates. HIF1 knockdown also caused normalization of G2-M progression, as seen from a comparable accumulation of Ser10-phosphorylated histone H3 in both untreated and PHD-inactivated cells (). Thus, activated HIF1 induces a global slowdown of the entire cell cycle, which includes a reduced rate of replication (slower S phase) and a slower progression from G1 to S and from G2 to M.
Figure 3. Cell cycle progression in cells with activated hypoxia signaling
HIF2 independence of growth inhibition by hypoxia mimetics
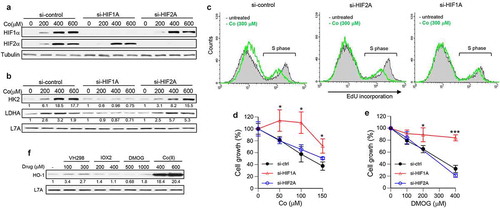
HIF2 is another hypoxia-activated transcription factor that is closely related to HIF1 in its activation and some but not all functions [Citation1,Citation29]. Thus, it is possible that HIF2 could also be involved in the regulation of cell growth by hypoxia signaling. We focused on the cellular responses to Co(II) as in contrast to other HIF1/2 activators, the rescue of its growth-inhibitory effects by HIF1α depletion was incomplete (). Our transfections of siRNA targeting HIF1α and HIF2α produced very efficient and specific knockdowns of individual transcription factors in Co(II)-treated cells (). Consistent with a narrower role of HIF2α in hypoxia-induced metabolic responses [Citation1,Citation29], upregulation of the glycolytic enzymes HK2 and LDHA by Co(II) was only dependent on the presence of HIF1α (). As with other hypoxia mimetics, inhibition of DNA replication by Co(II) was abolished in cells with HIF1α knockdown (). In contrast, depletion of HIF2α did not produce noticeable effects on the DNA replication activity in Co(II)-treated cells. To further examine the role of HIF2α, we evaluated its effects on the growth of Co(II)- or DMOG-treated cells (). We found that antigrowth effects of both hypoxia mimetics in cells with HIF2α knockdown were similar to those in control cells. Parallel measurements in cells with HIF1α knockdowns showed the expected loss of growth-inhibitory effects. Thus, HIF2α does not play a significant role in antigrowth/cytotoxic effects of hypoxia mimetics in primary human cells under normoxia. The incomplete dependence of growth inhibition by Co(II) in HIF1α knockdown cells probably reflects a general proteotoxicity of this metal, as evidenced by its ability to cause a massive upregulation of heme oxygenase 1 (HO-1) ()). HO-1 is a target of the electrophilic stress-responsive transcriptional factor NRF2[Citation42]. In contrast to Co(II), the protein abundance of HO-1 was not affected by treatments with DMOG or IOX2. VH298, a frequently used inhibitor of the HIF-targeting E3 ubiquitin ligase VHL, moderately increased HO-1 levels pointing to some of its off-target or secondary effects.
Figure 4. HIF2α independence of antiproliferative effects of hypoxia mimetics
Metabolic factors in antigrowth effects of HIF1
To determine how fast cells can downregulate cell cycle in response to the activation of hypoxia signaling, we examined cells treated with the PHD inhibitor IOX2 for 2 and 6 h. We found that the protein abundance of HIF1α already reached its maximal level after 2 h incubation with IOX2 (). In contrast to 24-h long incubations () and 6(h) treatments with IOX2 did not increase protein levels of TXNIP, which is upregulated in response to the overabundance of glycolytic products [Citation40,Citation43]. The short treatments with IOX2 also did not cause the loss of the mitotic marker Ser10-phosphorylated histone H3 or substantially change the amounts of the CDK inhibitors p21 and p27 (). FACS measurements of EdU incorporation showed no appreciable effects on DNA replication rates in control or HIF1α-depleted cells treated with IOX2 for 2 or 6 h (). Consistent with these findings, PHD inhibition by IOX2 for 6 h also produced no significant changes in cell cycle distribution in control or HIF1α knockdown cells ().
Figure 5. Absence of cell cycle inhibition after a short-term activation of HIF1
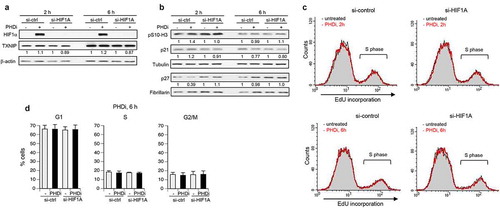
Figure 6. Metabolic factors in growth-inhibitory effects of HIF1 in primary cells
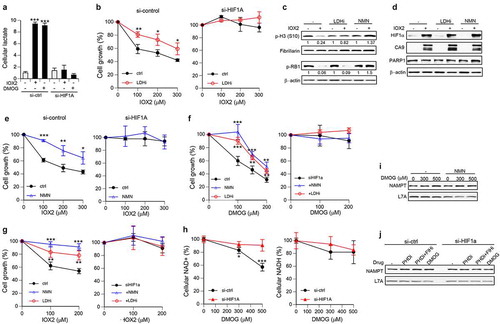
The delayed impact of upregulated HIF1α on cell cycle progression raised the possibility that a slow buildup or depletion of some metabolic products could be responsible for its antiproliferative activity. A major effect of HIF1 on cell energetics involves stimulation of glucose uptake and its predominant metabolism via glycolysis, even in well-oxygenated cells [Citation19,Citation20]. Upregulation of LDHA by HIF1 causes pyruvate, a normal final product of glycolysis taken up by mitochondria for the use in the oxidative phosphorylation cycle, to be converted into lactate. Lactate is toxic to cells and excreted from the cells by the monocarboxylate transporters MCT1 and MCT4[Citation44]. We measured the cellular lactate concentrations and found them to be much higher after 24 h incubations with the PHD inhibitor IOX2 or the 2-oxoglutarate analog DMOG, which was completely preventable by HIF1α knockdown (). To test whether a prolonged production of lactate contributes to the antiproliferative effects of activated HIF1α, we examined the growth of cells treated with IOX2 in the presence of a selective lactate dehydrogenase inhibitor GSK 2837808A. The addition of this inhibitor to normoxic cells with activated aerobic glycolysis increased utilization of pyruvate in the mitochondrial citric acid cycle[Citation45]. We found that inhibition of LDH activity resulted in a significantly higher growth of IOX2-treated cells (). As expected, the knockdown of HIF1α completely eliminated the cytotoxicity of IOX2 and inhibition of LDH activity in these cells had no viability effects. LDH inactivation also prevented a decrease in the mitotic marker Ser10-phosphorylated histone H3 by IOX2 but not the loss of RB1 phosphorylation at Ser807/Ser811 (CDK4/6 target sites) (). Considering a stressed state of energy production in cells with hypoxia response, we next tested the impact of elevation of nicotinamide adenine dinucleotide (NAD+) in cells with high HIF1. NAD+ is an essential factor for energy production in cells. The addition of NMN, the immediate precursor to NAD+ in the main biosynthetic pathway, is a commonly used approach to increase cellular NAD levels [Citation46,Citation47]. NMN supplementation restored normal levels of RB1 phosphorylation and mitotic phospho-histone H3 in IOX2-treated cells (). The addition of the LDH inhibitor or NMN did not affect the upregulation of HIF1α or its transcription target CA9 (). NMN supplementation alleviated the antiproliferative effects of IOX2, with a complete rescue of growth at its lowest dose (). NMN had no effect on the growth of HIF1α knockdown cells, indicating that its protective activity in IOX2-treated normal cells neutralized the toxicity of high HIF1. Additions of the LDH inhibitor or NMN were also protective against growth inhibition by the 2-oxoglutarate analog DMOG (). The suppression of antigrowth effects of DMOG at its low dose was completed by both the LDH inhibitor and NMN. The same pharmacological interventions in HIF1α-depleted cells produced no cytotoxicity/growth effects, indicating that their protective properties in normal cells counteracted consequences of HIF1 activation by DMOG. HIF1A-dependence of cytotoxic effects of activated hypoxia signaling and protective properties of NMN supplementation or LDH inhibition were further confirmed in another primary human cell line – IMR90 ().
NAD is not very stable biologically with the estimated t1/2 = 1 h in human cells [Citation48] and its cellular levels can fluctuate in response to metabolic cues[Citation47]. We measured both NAD forms in cells with activated hypoxia response and found significant decreases in cellular concentrations of NAD+ but not its reduced form NADH (). The depletion in cellular NAD+ was caused by activated HIF1 as its knockdown prevented this change. Thus, cells after a prolonged activation of HIF1 experience a loss of the NAD+ form that is necessary for ATP production in glycolysis and other cellular functions. Supplementation with NMN rescues this biochemical deficiency, explaining its neutralization effect on antigrowth activity of HIF1. Using the same LDH inhibitor concentration as in cell growth studies, we found that it enhanced the depletion of NAD+ by DMOG (decrease by 15.6±4.0%, p < 0.01, n = 4, 600 µM DMOG for 24 h), which at least partially explains the inability of LDH inactivation to fully rescue cytotoxic effects of prolonged HIF1 activity in normoxia. The main biosynthetic process for NAD+ in cells is controlled by the rate-limiting enzyme NAMPT, which generates NMN[Citation47]. Suppression of antigrowth effects of HIF1 by NMN raised the possibility of NAMPT deficiency in cells with activated HIF signaling. We found that hypoxia response triggered by DMOG did not cause appreciable changes in protein levels of NAMPT with or without NMN supplementation (). NAMPT expression also remained similar in control and HIF1α knockdown cells treated with various hypoxia mimetics ().
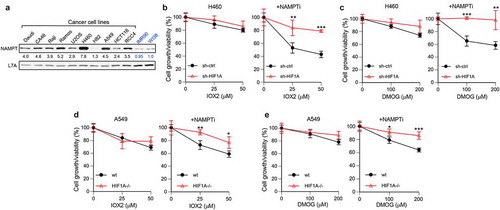
Elevated hypoxic response in advanced cancers is associated with increased aggressiveness [Citation1,Citation16], which suggest that malignant cells acquired resistance to growth inhibition by HIF1. One of the common metabolic changes in tumors is the upregulation of NAD+ synthesis through overexpression of NAMPT [Citation46,Citation47]. We compared NAMPT expression in a panel of cancer human cells and found that 9 out 10 cancer lines had higher levels of this enzyme than normal cells (). On average, cancer cells had 4 ± 1.8-times more NAMPT. H460 lung large-cell carcinoma line had a particularly high expression of NAMPT and these cells were previously found to lack a HIF1-dependent cytotoxicity by the hypoxia mimetic nickel[Citation49]. H460 cells also lacked a significant growth inhibition by the selected doses of HIF1 activators IOX2 and DMOG (). However, when NAMPT activity in these cells was suppressed by its inhibitor FK866, both IOX2 and DMOG produced strong, HIF1-dependent growth-inhibitory effects. To confirm these observations, we examined the cytotoxic effects of IOX2 and DMOG in A549 adenocarcinoma cells that overexpress NAMPT more moderately relative to H460 cells (). To extend our models of HIF1 loss beyond si/shRNA, we employed wild-type and HIF1A knockout strains of A549. We found that inhibition of NAMPT also sensitized A549 cells to cytotoxicity of IOX2 and DMOG in a HIF1-dependent manner ().
Figure 7. High NAMPT in cancer cells confers resistance to growth inhibition by HIF1
Discussion
Cell cycle inhibition by HIF1 in normoxia
Our work uncovered important mechanisms of growth-suppressive effects of hypoxia signaling in primary human cells in normoxia. We activated hypoxia-related signaling via a loss of inhibitory hydroxylation in HIF1 and HIF2 and defined the individual effects of these transcription factors. HIF1 was responsible for all antiproliferative responses in normal cells treated with HIF-specific activators and the 2-oxoglutarate analog DMOG. Similar to Hif1a loss in mouse embryonic fibroblasts[Citation50], a knockdown of HIF1α in Co(II)-treated human cells resulted in a significant but incomplete rescue of cytotoxic effects probably due to a general protein damage by this SH-reactive metal[Citation51], which was evident in a massive upregulation of the NRF2-inducible target HO-1 in Co(II)-treated cells (). Unlike hypoxia [Citation25,Citation34,Citation35], HIF1-dependent growth inhibition in normoxic cells treated with DMOG or specific PHD and FIH inhibitors was not accompanied by upregulation of the CDK inhibitors p21 or p27. Only high doses of Co(II) increased protein levels of p21 and p27, pointing to a potential involvement of Co(II) proteotoxicity in this response. In contrast to its pro-growth effects in cancer cells [Citation28,Citation29], the second hypoxia-inducible transcription factor HIF2 did not produce detectable effects on cell cycle or proliferation of normal cells treated with hypoxia mimetics. Unexpectedly, we found that growth-inhibitory effects of hypoxia mimetics were not associated with significant changes in the distribution of cells among G1, S and G2 phases. However, HIF1 activation resulted in the loss of mitotic cells, which was consistent with the strong growth inhibition but not with the normal distribution of cells in other phases. The answer to these contradictions was found in our analysis of the progression of cells through individual cell cycle phases. We found that the extended HIF1 activation resulted in a global slowdown of cell cycle progression, including the rates of G1-S transition, DNA replication and G2-M transition. The results of this global cell cycle slowdown were a normal distribution of cells among the three longest phases, a loss of short-lived mitotic cells and the overall growth-inhibitory outcome. Inhibition of cell cycle by HIF1 was indirect, as indicated by the absence of changes during the first several hours of its upregulation, which pointed to some slow-building metabolic or other changes as a likely cause of antigrowth effects.
Metabolic factors in growth inhibition by HIF1
Hypoxic response mediated by HIF1 strongly increases the overall rate of glucose metabolism and redirects it toward glycolysis, which yields lactic acid as the final metabolite [Citation19,Citation20,Citation52]. We found that the accumulation of cellular lactate contributed to the antiproliferative effects in cells with a prolonged activation of HIF1. This metabolic mechanism is consistent with other findings, such as the independence of growth-inhibitory effects of hypoxia signaling on HIF1-Asn803 hydroxylation by FIH and HIF2α. Neither the loss of Asn803 hydroxylation nor HIF2α presence was important for the induction of glycolytic enzymes by hypoxia and hypoxia mimetics, including the lactate-producing LDHA[Citation2], which was confirmed in our experiments. The HIF1-induced metabolic switch causes accumulation of toxic lactate in all cells, which helps explain slower progression rates through all cell cycle phases. Biochemically, the lactate production-associated acidification of the cellular milieu is expected to decrease the activity of many cellular enzymes, which were evolutionarily optimized for functioning at physiological pH. No specific sensors for low cellular pH are known in human or rodent cells [Citation44,Citation53]. Cell cycle progression is driven by the activity of a small group of catalytically and structurally related CDK kinases that are in turn activated by another small group of related CDC25 phosphatases [Citation38,Citation41]. The lactate dependence of HIF1-induced inhibitory effects on cell cycle are supported by previous studies on the pH regulation of the kinase activities of selected CDKs, G1/S and G2/M progression rates [Citation54–56] and the overall inhibitory effects of the subphysiological pH on cell proliferation[Citation53]. Conservative catalytic mechanisms in CDK kinases and CDC25 phosphatases suggest that their activity should be similarly sensitive to inhibition at low pH, which would produce proportionally similar decreases in the rates of progression through different cell cycle phases. Lactate also exerts pH-unrelated inhibitory effects on cellular energy metabolism through the release of Mg2+ ions from the endoplasmic reticulum that enter mitochondria and inhibit their activity [Citation57]. Excretion of lactate from cells with activated glycolysis also alters the tumor microenvironment and immune responses [Citation58,Citation59].
NAD+ production was the second, even more important metabolic factor, which we found to be involved in the regulation of growth-suppressive effects of HIF1. Activated HIF1 decreased cellular concentrations of NAD+ and their elevation suppressed anti-growth effects of HIF1 in normal and cancer cells. NAD+ is an essential factor for ATP production in cells through glycolysis and oxidative phosphorylation [Citation46,Citation47]. A decrease in NAD+ availability is expected to diminish ATP production in glycolysis and activity of pentose phosphate pathway, which is necessary for the production of biomass, including nucleotides [Citation19,Citation60,Citation61]. Growth-inhibitory effects of low NAD+ may also result from its role in cell signaling processes, such as protein deacetylation and mono- and poly-ADP-ribosylation. A specific biochemical cause for the observed NAD+ loss in cells with activated HIF1 remains unclear, but it could be related to a metabolic misbalance formed in cells after a prolonged hypoxia response. NAD+ decreases also occur in aging where they play a causative role [Citation47,Citation62]. Identification of biochemical causes of these age-associated changes has not yet been successful, reflecting complexity and multitude of metabolic and catabolic processes affecting NAD levels.
Resistance of cancer cells to antigrowth effects of HIF1
Upregulation of HIF1 in advanced cancers enhances several malignancy-promoting characteristics [Citation19,Citation20]. Thus, cancer cells apparently lost or attenuated their sensitivity to proliferation-inhibitory effects of HIF1, allowing them to benefit from malignancy-promoting features of elevated hypoxia signaling. Adaptation to the constitutively active glycolysis (Warburg effect) in cancer cells includes upregulation of pH-stabilizing processes such as the lactate/H+ symporters MCT1 and MCT4, H+-ATPases and the Na+-H+ exchanger NHE1. As a result of these changes, cancer cells also have a higher pH relative to normal cells [Citation44,Citation53]. The other common metabolic change in tumor cells is increased NAD+ production, which most typically occurs via upregulation of NAMPT – the rate-limiting enzyme in the main biosynthetic pathway for NAD [Citation46,Citation47]. Our results showed that NAD availability plays a critical role in the growth-inhibitory effects of HIF1. Pharmacologically increased production of NAD in primary cells suppressed HIF1 cytotoxicity and inhibition of a high activity of NAMPT in cancer cells eliminated their resistance to antigrowth effects of HIF1. NAMPT expression is stimulated by the biosynthesis- and replication-promoting transcription factor c-MYC[Citation63]. Many cancers overexpress oncogenic c-MYC, which cooperates with HIF1 in setting up a tumor-specific cellular metabolism to stimulate proliferation of cancer cells [Citation64–66]. Our findings suggest that these cooperative interactions may include the neutralization of HIF1 antigrowth effects by enhanced NAD+ biosynthesis in cells with hyperactivated c-MYC.
Materials and methods
Chemicals
CoCl2⋅6 H2O (BioReagent grade), VH298 and the FIH inhibitor dimethyl N-oxalyl-D-phenylalanine (DM-NOFD) were purchased from Sigma. IOX2, DMOG and β-nicotinamide mononucleotide (NMN) were from Cayman Chemical. The lactate dehydrogenase inhibitor GSK 2837808A was obtained from Millipore.
Cell culture
A549 HIF1A-/- cells were purchased from Sigma (CLLS1014). All other cells were obtained from the American Type Culture Collection. WI38 and IMR90 primary human cells were propagated in HEPES- and glutamine-supplemented DMEM media (Gibco, 12,430,062) containing 20% fetal bovine serum. Cells were grown in a humidified atmosphere with 5% O2 and 5% CO2. H460 cells were grown in 10% fetal bovine serum-containing RPMI-1640 (Gibco, 11,875,119). A549 cells were grown in 10% fetal bovine serum-supplemented F12-K media (ATCC, 30–2004).
Treatments with hypoxia mimetics and other chemicals were done in complete growth media in 5% O2 atmosphere. Freshly prepared solutions of CoCl2 were always used.
Immunoblotting
Cells were treated at 60–70% confluence and protein samples were prepared by boiling cells for 10 min in a 2% SDS solution (2% SDS, 50 mM Tris-HCl pH 6.8, 10% glycerol) containing Halt Protease and Phosphatase Inhibitors (ThermoFisher Scientific). SDS-PAGE was run at 120 V with 20 µg of protein for each sample. For the detection of small proteins, samples were run on 12% SDS-PAGE gels and then electrotransferred onto PVDF membranes using PierceG2 Fast Blotter and 12% ethanol-supplemented buffer for 13 min at 25 V. Large proteins were separated on 6% or 10% gels and transferred onto PVDF membranes by a passive diffusion at 4°C overnight at 18 V using Bjerrum Schafer-Nielsen Buffer. Membranes were incubated with primary antibodies overnight at 4°C. The following primary antibodies were used: HIF1α (BD Biosciences, 610,958), HIF2α (Cell Signaling, 7096), HK2 (Cell Signaling, 2106), CA9 (Cell Signaling, 5649), LDHA (Cell Signaling, 2012), PARP1 (Cell Signaling, 9542), p53 (Santa Cruz, sc-126), phospho-Ser15-p53 (Cell Signaling, 9284), p16 (Cell Signaling, 80,772), p21 (Abcam, ab109199), p27 (Cell Signaling, 2552), phospho-Ser10-histone H3 (Cell Signaling, 9701), phospho-Ser807/811-RB1 (Cell Signaling, 9308), ribosomal protein L7A (Cell Signaling, 2415), γ-tubulin (Sigma, T6557), β-actin (Cell Signaling, 4967), CHK2 (Cell Signaling, 3440), CDT1 (Cell Signaling, 8064), TXNIP (Cell Signaling, 14,715), CDC25A (Cell Signaling, 3652), RRM2 (Millipore, MABC154), FoxM1 (Cell Signaling, 5436), HO-1 (Cell Signaling, 5061), NAMPT (Cell Signaling, 86,634). Primary antibodies were used at 1:1000 dilution, except for HIF1α and γ-tubulin that were diluted 1:500 and 1:2000, respectively. Secondary antibodies were horseradish peroxidase-conjugated goat anti-mouse IgG (Millipore, 12–349) and goat anti-rabbit IgG (Cell Signaling, 7074) that were used at 1:2000 dilution. Intensity of protein bands in immunoblots was quantified by ImageJ.
siRNA
Transient knockdowns were produced using the ON-TARGETplus SMARTpool human HIF1A siRNA from Dharmacon (HIF1A: L-004018-00, HIF2A: L-004814-00, TXNIP: L-010814-00). Control cells were transfected with the ON-TARGETplus Control Pool Non-Targeting pool siRNA (Dharmacon, D-001810-10-10). For transfections, mixtures of siRNA (90 nM final concentration in media) and Lipofectamine RNAiMAX (Invitrogen, 13,778,150) were added to cells seeded onto 100-mm dishes (0.5 million/dish). Cells were incubated with the transfection mixtures for 6 h. The second transfection was performed 24 h later, and cells were seeded for the experiments the next day.
Stable shRNA expression
Cells with stable knockdowns of HIF1A were produced through a continuous expression of shRNA from the pSUPER.retro.puro (OligoEngine, VEC-pRT-0002). The targeting sequence for HIF1A was 5’-GAAGGAACCTGATGCTTTA-3’. A nonspecific shRNA control was obtained from the supplier of the vector. The double-stranded oligonucleotides and linearized vector were incubated with T4 ligase overnight followed by the transformation of the ligated products into E. coli. Purified vectors were packaged into the viral particles by cotransfection with MoMuLV gag-pol and VSVG-encoding plasmids into 293 T cells[Citation67]. Virus-containing media was collected 48 h after transfection, filtered and added to cells overnight. Cells with chromosomally integrated vectors were selected and continuously maintained in the presence of 1.5 μg/mL puromycin.
Fluorescence-activated cell sorting (FACS)
WI38 cells transfected with control or targeting siRNA were seeded on 60-mm dishes and grown overnight. The next day, cells were treated with a solvent or hypoxia mimetics for 24 h. For the accurate quantitation of S-phase population and the determination of rates of DNA replication, cells were labeled with 10 μM EdU during the last hour of the drug treatments [Citation68,Citation69]. Cells were collected by trypsinization, fixed overnight in 80% ethanol at 4°C, washed with 0.5 mL PBS and then permeabilized with 150 μL of 0.5% Triton X-100 in PBS for 30 min at room temperature. After a wash with 0.5 mL PBS, cell pellets were resuspended in a Click-iT reaction mixture (Click-iT EdU-Alexa Fluor 488 Flow Cytometry Assay kit from Invitrogen, C10420) and incubated for 30 min at room temperature. Cells were washed once with 0.5 mL PBS and then stained for 30 min with 0.5 μg/mL 7-AAD (BD Biosciences, 559,925). Cells were washed with PBS and resuspended in 0.5 mL PBS. Flow cytometry data were acquired from FACSCalibur (BD Biosciences) and analyzed using the CellQuest Pro software.
Growth inhibition/cytotoxicity
The number of viable cells was determined using the CellTiter-Glo luminescent assay (Promega, G7571). Cells were seeded (500–1000 per well) into optical bottom cell culture plates (ThermoFisher Scientific, 165,305) and grown overnight before the addition of the test chemicals. Cell viability was measured at different times after treatments.
Cellular lactate measurements
Cellular lactate concentrations were assayed by the Lactate-Glo Assay (Promega, J5021). Cells were seeded at 10,000 per well into optical bottom cell culture plates (ThermoFisher Scientific, 165,305), grown overnight and then treated with hypoxia mimetics for 24 h. Lactate concentrations were determined according to the manufacturer’s instructions.
NAD+/NADH quantification
NAD+ and NADH concentrations in cells were measured using the NAD/NADH-Glo™ assay kit from Promega (G9071). WI38 cells (5000 per well) were seeded into the optical bottom of 96-well plates (ThermoFisher Scientific, 165,305), grown overnight and then treated with drugs for 24 h. NAD+ and NADH concentrations were determined according to supplier’s instructions.
Statistics
Statistical significance between two independent groups was evaluated by two-tailed, unpaired t-test. Data in multiple comparisons were evaluated by one-way ANOVA with the post-hoc Tukey’s test. Differences with p < 0.05 were considered statistically significant.
Supplemental Material
Download Zip (801 KB)Disclosure statement
No potential conflict of interest was reported by the author(s).
Supplementary material
Supplemental data for this article can be accessed here
Additional information
Funding
References
- Schito L, Semenza GL. Hypoxia-inducible factors: master regulators of cancer progression. Trends Cancer. 2016;2(12):758–770.
- Chan MC, Ilott NE, Schödel J, et al. Tuning the transcriptional response to hypoxia by inhibiting hypoxia-inducible factor (HIF) prolyl and asparaginyl hydroxylases. J Biol Chem. 2016;291(39):20661–20673.
- Bruick RK, McKnight SL. A conserved family of prolyl-4-hydroxylases that modify HIF. Science. 2001 Nov 9;294(5545):1337–1340. .
- Epstein AC, Gleadle JM, McNeill LA, et al. elegans EGL-9 and mammalian homologs define a family of dioxygenases that regulate HIF by prolyl hydroxylation. Cell. 2001 Oct 5;107(1):43–54. .
- Berra E, Benizri E, Ginouvès A, et al. HIF prolyl-hydroxylase 2 is the key oxygen sensor setting low steady-state levels of HIF-1alpha in normoxia. EMBO J. 2003 Aug 15;22(16):4082–4090. .
- Ivan M, Kondo K, Yang H, et al. HIFalpha Targeted for VHL-Mediated destruction by proline hydroxylation: implications for O2 sensing. Science. 2001;292(5516):464–468.
- Jaakkola P, Mole DR, Tian YM, et al. Targeting of HIF-alpha to the von Hippel-Lindau ubiquitylation complex by O2-Regulated prolyl hydroxylation. Science. 2001;292(5516):468–472.
- Lando D, Peet DJ, Gorman JJ, et al. FIH-1 is an asparaginyl hydroxylase enzyme that regulates the transcriptional activity of hypoxia-inducible factor. Genes Dev. 2002;16(12):1466–1471.
- Beyoğlu D, Idle JR. Metabolic rewiring and the characterization of oncometabolites. Cancers (Basel). 2021 Jun 10;13(12):2900. .
- Brunelle JK, Bell EL, Quesada NM, et al. Oxygen sensing requires mitochondrial ROS but not oxidative phosphorylation. Cell Metab. 2005;1(6):409–414.
- Kaczmarek M, Timofeeva OA, Karaczyn A, et al. The role of ascorbate in the modulation of HIF-1alpha protein and HIF-dependent transcription by chromium(VI) and nickel(II). Free Radic Biol Med. 2007;42(8):1246–1257.
- Niecknig H, Tug S, Reyes BD, et al. Role of reactive oxygen species in the regulation of HIF-1 by prolyl hydroxylase 2 under mild hypoxia. Free Radic Res. 2012;46(6):705–717.
- Briggs KJ, Koivunen P, Cao S, et al. Paracrine induction of HIF by glutamate in breast cancer: eglN1 senses cysteine. Cell. 2016;166(1):126–139.
- Lee G, Won HS, Lee YM, et al. Oxidative dimerization of PHD2 is responsible for its inactivation and contributes to metabolic reprogramming via HIF-1α activation. Sci Rep. 2016;6(1):18928.
- Semenza GL. Targeting HIF-1 for cancer therapy. Nat Rev Cancer. 2003 Oct;3(10):721–732. .
- Rohwer N, Cramer T. Hypoxia-mediated drug resistance: novel insights on the functional interaction of HIFs and cell death pathways. Drug Resist Updat. 2011;14(3):191–201.
- Cassim S, Vučetić M, Ždralević M, et al. Warburg and beyond: the power of mitochondrial metabolism to collaborate or replace fermentative glycolysis in cancer. Cancers (Basel). 2020 Apr 30;12(5):1119. .
- Cassim S, Raymond VA, Lacoste B, et al. Metabolite profiling identifies a signature of tumorigenicity in hepatocellular carcinoma. Oncotarget. 2018 Jun 1;9(42):26868–26883. .
- Nakazawa MS, Keith B, Simon MC. Oxygen availability and metabolic adaptations. Nat Rev Cancer. 2016;16(10):663–673.
- Rankin EB, Giaccia AJ. Hypoxic control of metastasis. Science. 2016;352(6282):175–180.
- Shen C, Beroukhim R, Schumacher SE, et al. Genetic and Functional Studies Implicate HIF1 α as a 14q kidney cancer suppressor gene. Cancer Discov. 2011;1(3):222–235.
- Scortegagna M, Martin RJ, Kladney RD, et al. Hypoxia-inducible factor-1alpha suppresses squamous carcinogenic progression and epithelial-mesenchymal transition. Cancer Res. 2009;69(6):2638–2646.
- Velasco-Hernandez T, Hyrenius-Wittsten A, Rehn M, et al. HIF-1α can act as a tumor suppressor gene in murine acute myeloid leukemia. Blood. 2014;124(24):3597–3607.
- Box AH, Demetrick DJ. Cell cycle kinase inhibitor expression and hypoxia-induced cell cycle arrest in human cancer cell lines. Carcinogenesis. 2004;25(12):2325–2335.
- Hubbi ME, Semenza GL. Regulation of cell proliferation by hypoxia-inducible factors. Am J Physiol Cell Physiol. 2015 Dec 15;309(12):C775–82. .
- Scanlon SE, Glazer PM. Multifaceted control of DNA repair pathways by the hypoxic tumor microenvironment. DNA Repair (Amst). 2015;32:180–189.
- Goda N, Ryan HE, Khadivi B, et al. Hypoxia-inducible factor 1alpha is essential for cell cycle arrest during hypoxia. Mol. Cell Biol. 2003;23(1):359–369.
- Gordan JD, Bertout JA, Hu CJ, et al. HIF-2alpha promotes hypoxic cell proliferation by enhancing c-myc transcriptional activity. Cancer Cell. 2007 Apr;11(4):335–347. .
- Mucaj V, Shay JE, Simon MC. Effects of hypoxia and HIFs on cancer metabolism. Int J Hematol. 2012 May;95(5):464–470. .
- Filippi S, Latini P, Frontini M, et al. CSB protein is (a direct target of HIF-1 and) a critical mediator of the hypoxic response. EMBO J. 2008 Oct 8;27(19):2545–2556. .
- Hammond EM, Mandell DJ, Salim A, et al. Genome-wide analysis of p53 under hypoxic conditions. Mol Cell Biol. 2006;26(9):3492–3504.
- Sermeus A, Michiels C. Reciprocal influence of the p53 and the hypoxic pathways. Cell Death Dis. 2011;2(5):e164.
- Wong VC, Morse JL, Zhitkovich A. p53 activation by Ni(II) is a HIF-1α independent response causing caspases 9/3-mediated apoptosis in human lung cells. Toxicol Appl Pharmacol. 2013;269(3):233–239.
- Gardner LB, Li Q, Park MS, et al. Hypoxia inhibits G1/S transition through regulation of p27 expression. J Biol Chem. 2001 Mar 16;276(11):7919–7926. .
- Green SL, Freiberg RA, Giaccia AJ. p21Cip1 and p27Kip1 Regulate Cell Cycle Reentry after Hypoxic Stress but Are Not Necessary for Hypoxia-Induced Arrest. Mol Cell Biol. 2001;21(4):1196–1206.
- Salnikow K, Donald SP, Bruick RK, et al. Depletion of intracellular ascorbate by the carcinogenic metals nickel and cobalt results in the induction of hypoxic stress. J Biol Chem. 2004;279(39):40337–40344.
- Semenza GL, Roth PH, Fang HM, et al. Transcriptional regulation of genes encoding glycolytic enzymes by hypoxia-inducible factor 1. J Biol Chem. 1994;269(38):23757–23763.
- Choi YJ, Anders L. Signaling through cyclin D-dependent kinases. Oncogene. 2014;33(15):1890–1903.
- Sullivan KD, Galbraith MD, Andrysik Z, et al. Mechanisms of transcriptional regulation by p53. Cell Death Differ. 2018;25(1):133–143.
- Stoltzman CA, Peterson CW, Breen KT, et al. Glucose sensing by MondoA:Mlx complexes: a role for hexokinases and direct regulation of thioredoxin-interacting protein expression. Proc Natl Acad Sci U S A. 2008 May 13;105(19):6912–6917. .
- Duronio RJ, Xiong Y. Signaling pathways that control cell proliferation. Cold Spring Harb Perspect Biol. 2013;5(3):a008904.
- Araujo JA, Zhang M, Yin F. Heme oxygenase-1, oxidation, inflammation, and atherosclerosis. Front Pharmacol. 2012 Jul 19;3:119. .
- Chen JL, Merl D, Peterson CW, et al. Lactic acidosis triggers starvation response with paradoxical induction of TXNIP through MondoA. PLoS Genet. 2010 Sep 2;6(9):e1001093. .
- Corbet C, Feron O. Tumour acidosis: from the passenger to the driver’s seat. Nat Rev Cancer. 2017 Oct;17(10):577–593. .
- Billiard J, Dennison JB, Briand J, et al. Quinoline 3-sulfonamides inhibit lactate dehydrogenase A and reverse aerobic glycolysis in cancer cells. Cancer Metab. 2013 Sep 6;1(1):19.
- Chiarugi A, Dölle C, Felici R, et al. The NAD metabolome-a key determinant of cancer cell biology. Nat Rev Cancer. 2012 Nov;12(11):741–752.
- Strømland Ø, Niere M, Nikiforov AA, et al. Keeping the balance in NAD metabolism. Biochem Soc Trans. 2019 Feb 28;47(1):119–130.
- Rechsteiner M, Hillyard D, Olivera BM. Magnitude and significance of NAD turnover in human cell line D98/AH2. Nature. 1976 Feb 26;259(5545):695–696.
- Luczak MW, Zhitkovich A. Nickel-induced HIF-1α promotes growth arrest and senescence in normal human cells but lacks toxic effects in transformed cells. Toxicol Appl Pharmacol. 2017;331:94–100.
- Vengellur A, LaPres JJ. The role of hypoxia inducible factor 1alpha in cobalt chloride induced cell death in mouse embryonic fibroblasts. Toxicol. Sci. 2004;82(2):638–646.
- Luczak MW, Zhitkovich A. Role of direct reactivity with metals in chemoprotection by N-acetylcysteine against chromium(VI), cadmium(II), and cobalt(II). Free Radic Biol Med. 2013Dec;65:262–269.
- Chan TS, Cassim S, Raymond VA, et al. Upregulation of Krebs cycle and anaerobic glycolysis activity early after onset of liver ischemia. PLoS One. 2018;13(6):e0199177.
- Webb BA, Chimenti M, Jacobson MP, et al. Dysregulated pH: a perfect storm for cancer progression. Nat Rev Cancer. 2011 Aug 11;11(9):671–677. . PMID: 21833026.
- Pouysségur J, Franchi A, L’Allemain G, et al. Cytoplasmic pH, a key determinant of growth factor-induced DNA synthesis in quiescent fibroblasts. FEBS Lett. 1985;190(1):115–119.
- Putney LK, Barber DL. NaH exchange-dependent increase in intracellular pH times G2/M entry and transition. J Biol Chem. 2003;278(45):44645–44649.
- Sellier C, Bodart J-F, Flament S, et al. Intracellular acidification delays hormonal G2/M transition and inhibits G2/M transition triggered by thiophosphorylated MAPK inXenopus oocytes. J Cell Biochem. 2006;98(2):287–300. .
- Daw CC, Ramachandran K, Enslow BT, et al. Lactate elicits ER-Mitochondrial Mg2+ dynamics to integrate cellular metabolism. Cell. 2020 Oct 15;183(2):474–489.
- Cassim S, Pouyssegur J. Tumor microenvironment: a metabolic player that shapes the immune response. Int J Mol Sci. 2019 Dec 25;21(1):157. .
- Parks SK, Mueller-Klieser W, Pouysségur J. Lactate and acidity in the cancer microenvironment. Annu. Rev. Cancer Biol. 2020 4: 1. ;(1):141–158.
- Pavlova NN, Thompson CB. The emerging hallmarks of cancer metabolism. Cell Metab. 2016;23(1):27–47.
- Salazar-Roa M, Malumbres M. Fueling the cell division cycle. Trends Cell Biol. 2017;27(1):69–81.
- McElroy GS, Reczek CR, Reyfman PA, et al. NAD+ regeneration rescues lifespan, but not ataxia, in a mouse model of brain mitochondrial complex I dysfunction. Cell Metab. 2020 Aug 4;32(2):301–308.e6.
- Menssen A, Hydbring P, Kapelle K, et al. The c-MYC oncoprotein, the NAMPT enzyme, the SIRT1-inhibitor DBC1, and the SIRT1 deacetylase form a positive feedback loop. Proc Natl Acad Sci U S A. 2012 Jan 24;109(4):E187–96.
- Dang CV. MYC on the path to cancer. Cell. 2012;149(1):22–35.
- Kim JW, Gao P, Liu YC, et al. Hypoxia-inducible factor 1 and dysregulated c-Myc cooperatively induce vascular endothelial growth factor and metabolic switches hexokinase 2 and pyruvate dehydrogenase kinase 1. Mol Cell Biol. 2007;27(21):7381–7393.
- Qing G, Skuli N, Mayes PA, et al. Combinatorial regulation of neuroblastoma tumor progression by N-Myc and hypoxia inducible factor HIF-1alpha. Cancer Res. 2010;70(24):10351–10361.
- Reynolds M, Peterson E, Quievryn G, et al. Human nucleotide excision repair efficiently removes chromium-DNA phosphate adducts and protects cells against chromate toxicity. J Biol Chem. 2004 Jul 16;279(29):30419–30424.
- Wong VC, Cash HL, Morse JL, et al. S-phase sensing of DNA-protein crosslinks triggers TopBP1-independent ATR activation and p53-mediated cell death by formaldehyde. Cell Cycle. 2012 Jul 1;11(13):2526–2537.
- Ortega-Atienza S, Wong VC, DeLoughery Z, et al. ATM and KAT5 safeguard replicating chromatin against formaldehyde damage. Nucleic Acids Res. 2016 Jan 8;44(1):198–209.