
ABSTRACT
Breast cancer (BC) is one of the most common malignancies in female, and has a high mortality rate. The mechanisms of tumorigenesis and reprogramming of somatic cells have a certain degree of similarity. Here, we focus on the relationship between gene expression, signaling pathways and functions in BC compared to induced pluripotent stem cells (iPSCs). We first identified differentially expressed genes (DEGs) common to BC and iPSCs in datasets from GEO and TCGA. We found 22 DEGs that were significantly associated with clinicopathological features and prognosis by performing Kaplan-Meier survival analysis and one-way ANOVA. The results of protein mass spectrometry of tumor stem cells (Mcfips) demonstrated that the proteins encoded by 8 of these DEGs were also differentially expressed. The functional enrichment analysis showed that most of the 30 DEGs were related to collagen and chromatin functions. Our results might offer targets for future studies into the mechanisms underlying tumor occurrence and progression, and our studies could provide valuable data for both basic research and clinical applications of BC.
Introduction
Breast cancer (BC), that is, a malignant tumor arising from breast tissue, is a common female malignancy and among the deadliest [Citation1]. The incidence of the disease increases with age [Citation2,Citation3]. BC is a multifaceted disease with a complicated pathogenesis that is thought to arise via a combination of genetic and environmental factors, among which genetic factors contribute a large proportion of risk [Citation4–6]. Therefore, understanding the genetic mechanisms of BC is a key to studying its pathogenesis. Since the completion of the Human Genome Project, high-throughput technology has made extraordinary progress and DNA microarray technology is now widely used. Previous microarray studies of BC have varied in their design and analysis methods, so it is difficult to compare them. Integration of such studies could greatly improve the reliability of the results and directions for future study. Mihály Z et. al. [Citation7] integrated microarray expression data from 665 BC patient samples in the GEO database to search for new biomarkers related to tamoxifen response. A total of 68 biomarkers were identified including PGR, MAPT, and SLC7A5. Although they successfully identified genetic factors for BC, the mechanisms of the pathogenesis are still unclear.
Somatic cell reprogramming processes, especially the induction of induced pluripotent stem cells (iPSCs), are very similar to the process of carcinogenesis [Citation8]. Somatic cell reprogramming involves the remodeling of cellular epigenetic markers to return a cell to a pluripotent or totipotent state [Citation9,Citation10]. The most important and useful property of iPSCs is their ability to self-renew and differentiate, which also occurs during tumorigenesis. In terms of molecular mechanisms, striking parallels can be found between iPSCs and tumor cells, and aberrant reprogramming can become tumorigenic. iPSCs and cancer cells possess similar signaling pathways [Citation11] and cellular metabolic features [Citation12]. Transcription factors involved in reprogramming are also involved in the development of various types of cancer [Citation13]. Other researchers have suggested that all tumors originate from normal stem cells or progenitor cells, or that the development of cancer cells could be regarded as a progressive dedifferentiation process [Citation14–18]. Recent studies have shown that the regulatory network of control functions in stem cell is active in some types of cancers [Citation16]. One example of this is the transcription factor OCT4, which is necessary to maintain the totipotency of embryonic stem cells and primordial germ cells [Citation19,Citation20]. Several studies have indicated that OCT4 might play a role in cancer development; induced expression of the Oct4 gene in mouse led to dysplasia in epithelial tissues [Citation21].
To investigate BC pathogenesis, we employed integrative expression profiling to compare gene expression, gene function, and signaling pathways between BC and iPSCs obtained from the GEO website (https://www.ncbi.nlm.nih.gov/geo/). Furthermore, we determined whether the differentially expressed genes (DEGs) were associated with the clinical analysis and treatment of cancer using RNA-seq data from TCGA. To examine the protein expression levels of these DEGs in cancer stem cells, we carried out a combined analysis of the transcriptome and proteome. The present study offers a new perspective for studying the genetic mechanisms of BC pathogenesis by comparing reprogrammed and BC cells.
Materials and methods
Affymetrix genechip datasets overview from GEO
The Human Genome U133 Plus 2.0 platform (Affymetrix, Santa Clara, CA, USA) offers a high-density microarray that contains 54,675 probesets representing 23,519 gene symbols with annotation information including probe name, gene symbol, and Entrez ID associated with each probeset and were obtained from yhr GEO database. To compare the transcriptome of BC and iPSCs, the following search terms were used to find the matched studies: “breast carcinoma” or “breast cancer” or “BC” or “breast” for BC, “induced pluripotent stem cell” or “ips” for iPS, and “homo sapiens”.
The included datasets met the following criteria: (1) the raw data cell intensity file (CEL) was available; (2) the total number in each study must be at least 2; (3) for BC, case-control studies were based on gene expression profiling of peripheral blood and/or tissue samples; and (4) for iPSCs, the datasets must be designed were designed to compare of iPSCs with normal somatic cells.
BC studies were excluded if they involved cancer cell lines, human stem cells, any drug treatment, metastatic lesions, gene overexpression or knockout/knockdown, siRNA interference, or diet control. iPSC studies were excluded if they involved donor cells obtained from a diseased or drug-treated sample, siRNA interference, or gene overexpression or knockout/knockdown.
For BC studies we also collected the BC type, sample type (peripheral blood or tissue), and the numbers of patients and healthy controls. For iPSCs we collected donor type, method of induction, reprogramming factors, and number of iPSCs and somatic cells
Microarray data quality control and pre-processing
To compare gene expression in tumor development and somatic cell reprogramming, we queried, filtered, and selected DNA microarray profiles from the GEO database. Datasets that met the above criteria were downloaded via the GEO FTP site (ftp://ftp.ncbi.nih.gov/pub/geo/). All statistical analyses were carried out in R version 3.5.0. Raw CEL files were normalized using robust multichip averaging (RMA) using the Affy package in Bioconductor, which returned log2-transformed intensities. The ComBar function of SVA was used to correct for the batch effect.
Two-tailed Student’s t-tests with correction for false discovery rate (FDR) were performed for each gene to evaluate whether it was differentially expressed in tumor (BC versus healthy controls) and reprogramming (iPSCs versus somatic cells) comparison groups. Genes were considered statistically significant if P < 0.05, with a fold change (FC) ≥ 2 indicating up-regulated genes and ≤ 0.50 indicating down-regulated genes. Hierarchical clustering analysis of DEGs was conducted using the pheatmap package.
Functional annotation analysis of DEGs
To gain insight into the biological processes of the DEGs, functional annotation analysis and pathway enrichment analysis were performed using the online tool DAVID (https://david.ncifcrf.gov/) based on Gene Ontology (GO, http://www.geneontology.org/), with the as GO terms of biological process (BP), cellular component (CC), and molecular function (MF), and the Kyoto Encyclopedia of Genes and Genomes (KEGG) categories (http://www.kegg.jp/) [Citation22]. The annotation was considered statistically significant if the FDR-adjusted P value was < 0.05.
Gene expression RNA-seq data from TCGA were analyzed
To evaluate the relationship between DEGs and clinical prognosis, Kaplan-Meier survival analysis was performed between the expression levels of DEGs and patient survival time by using survival package in R. The median expression value of each gene served as the threshold to determine high vs. low expression; an expression value greater than the median was recorded as 1, and any other value was recorded as 0. The results were then subjected to one-way ANOVA followed by Tukey’s test for multiple comparisons and the chi-square test to identify candidate genes. Gene expression data for BC patients were collected from TCGA, and normalized level 3 gene expression data from IlluminaHiSeq_RNASeqV2 were downloaded. Samples that contained the following clinical information were included: American Joint Committee on Cancer (AJCC) stage, estrogen receptor α (ER), progesterone receptor (PR), and erbb2 receptor tyrosine kinase 2 (HER2), current molecular subtypes (luminal A, luminal B, basal-like, HER2-enriched, and normal-like), survival time and outcomes, and pathological type (invasive lobular carcinoma and invasive ductal carcinoma). Figures were created using the “ggplot2” package within R. All TCGA data were downloaded from UCSC Xena (https://xena.ucsc.edu/).
Results
The DEGs were obtained from BC compared with healthy samples
Using keywords, we found 239 publications associated with gene expression profile data sets, 6 of which were excluded after reading the abstract. After querying, filtering, and selecting, 221 relevant articles were excluded: of these, 147 were associated with BC cell lines, 1 did not offer tissue or peripheral blood samples, 1 was a duplicate dataset, 33 did not provide control samples, 26 were related to drug or diet treatments, 6 were subjected to siRNA interference or treated with transgenes, and 7 came from cancer metastases. Ultimately, a total of 12 publicly available studies with 588 BC patients and 253 controls were included. Details of each individual BC microarray study were summarized in .
Table 1. Characteristics of microarray datasets that associated breast cancer studies included in the analysis
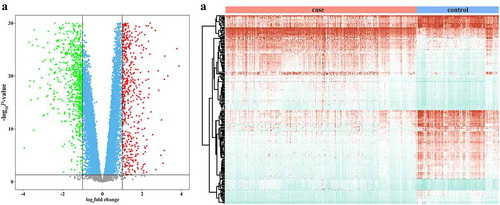
After normalization of the cDNA microarray data, 24,436 genes qualified for gene differential expression analysis. Of these DEGs, 18,945 were statistically significant (), with 869 genes showing higher expression and 846 genes showing lower expression in BC than in healthy controls (; Table S1).
Figure 1. Variation in breast cancer from GEO data. (a) Volcano plot for differentially expressed genes (DEGs). The x- and y-axis are the log2 fold change (FC) and – log10 p-value for a gene by differential expression analysis in breast cancer (BC) comparing with healthy controls, respectively. Green, robin, and Red dots respectively indicate that genes are significantly in BCs with FC ≤ 0.5, between 0.5 and 2, and ≥ 2, and on the contrary, gray dots are not significantly. (b) Hierarchical clustering analysis of top 100 up- and down-regulated DEGs. The color from red through blue indicates high to low expressed genes in BC compared with healthy controls
To gain insight into the biological functions associated with these changes in gene expression, DAVID was applied to identify significantly overrepresented GO classes. For genes with increased expression, the following GO terms were significantly enriched: cell cycle (GO: 0007049), nuclear division (GO: 0000280), mitosis (GO: 0007067), cell division (GO: 0051301), and chromosome (GO: 0005694) (). The down-regulated gene sets corresponded to GO terms such as biological adhesion (GO: 0022610), cell adhesion (GO: 0007155), blood vessel development (GO: 0001568), vasculature development (GO: 0001944), extracellular region part (GO: 0044421), and plasma membrane (GO: 0005886) ().
Figure 2. Up- (a) and down-regulated (b) differentially expressed genes categorized by biological process, molecular function, and cellular component in breast cancer patients comparing to healthy controls. (c) Classification of the differentially expressed genes with decreased expression in BC was categorized by KEGG database
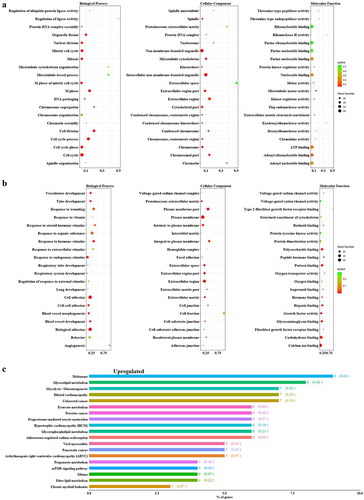
To further investigate the functions of the DEGs, we mapped them to the KEGG database. DEGs upregulated in BC were enriched in leukocyte transendothelial migration, fc epsilon RI signaling pathway, and T cell receptor signaling pathway. Down-regulated DEGs were significantly enriched in glycerolipid metabolism, melanoma, pyruvate metabolism, and aldosterone-regulated sodium reabsorption pathway ().
Identifying the DEGs in reprogramming
We also identified 56 relevant articles that were associated with iPSCs, 5 of which were excluded after reading abstracts. After a careful full-text reading, 6 more articles were excluded because donor cells were obtained from the disease sample, 9 studies were duplicate datasets, 9 did not provide somatic cell samples, and 7 offered fewer than 2 available samples. After this review process, 20 GSE experiments consisting of 170 iPSCs and 80 somatic cells were included. Details of the GEO datasets that were collected were shown in .
Table 2. Microarray datasets of the different induced pluripotent stem cells and the somatic cells were included in our study from GEO database
Microarray data were normalized and transformed and then subjected to two-sample testing to identify DEGs. The expression levels of 16,228 genes were significantly different between iPSCs and somatic cells (Supplementary ). Of these DEGs, the expression levels of 2,873 genes were increased and the expression levels of 2,273 genes were decreased in iPSCs compared to somatic cells (Supplementary ; Supplementary ).
GO analysis showed that among DEGs with increased expression, the most significant terms were M phase (GO: 0000279), cell cycle phase (GO: 0022403), organelle fission (GO:0048285), mitosis (GO: 0007067), and nuclear division (GO: 0000280) (). For the DEGs with decreased expression, significantly enriched GO terms included extracellular matrix organization (GO: 0030198), skeletal system morphogenesis (GO: 0048705), response to wounding (GO: 0009611), collagen fibril organization (GO: 0030199), and embryonic skeletal system development (GO: 0048706) ().
Figure 3. Total the identified up- (a) and down-regulated (b) differentially expressed genes that were identified between induced pluripotent stem cells and the somatic cells were categorized according to biological processes, molecular function, and cellular component. (c) Classification of DEGs in induced pluripotent stem cells were categorized by KEGG database
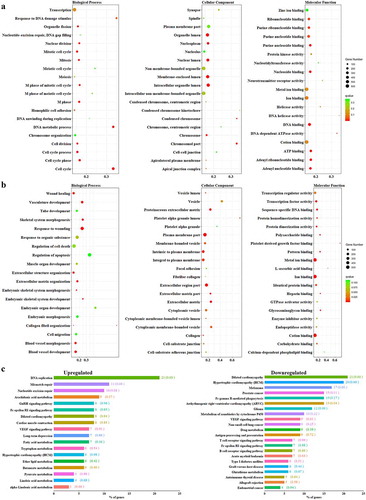
Using the KEGG database, we also identified 18 significant pathways relevant to increased DEG expression, the most significant of which were DNA replication (P = 3.96E-10) and mismatch repair (P = 1.68E-04). DEGs with decreased expression were enriched in dilated cardiomyopathy, hypertrophic cardiomyopathy, melanoma, and arrhythmogenic right ventricular cardiomyopathy ().
Commonalities and differences between tumorigenesis and somatic cell reprogramming
To further investigate the pathogenesis of BC, we sought out the commonalities and differences between tumorigenesis and somatic cell reprogramming. The 761 common DEGs (Figure S2) were again functionally annotated through GO terms and KEGG pathways.
A total of 290 DEGs were expressed at a higher level in both iPSCs and BC patients and might be associated with dedifferentiation (Table S3A). According to GO analysis, the most statistically overrepresented BP, CC, and MF terms were M phase, nuclear division, mitosis, cell cycle, and spindle (Figure S3A). The most significantly enriched KEGG pathways of the DEGs were cell cycle, DNA replication, oocyte meiosis, and progesterone-mediated oocyte maturation (Figure S3B).
We found 254 DEGs that were expressed at a lower level in both iPSCs and BC patients, which might be breast cell-specific genes (Table S3B). According to GO functional annotation, the most significant terms were biological adhesion, cell adhesion, lung development, angiogenesis, and extracellular region (Figure S4A). Significantly enriched KEGG pathways were related to regulation of the actin cytoskeleton (Figure S4B).
The expression level of 119 DEGs was increased in iPSCs compared with somatic cells, but decreased in BC patients compared with healthy controls, suggesting that these DEGs might be specific to reprogramming (Table S3C). These DEGs were significantly enriched in GO categories relating to response to endogenous stimulus, organic ether metabolic process, plasma membrane, and extracellular region (Figure S5), and were statistically overrepresented in KEGG pathways relating to PPAR and Wnt signaling.
The expression levels of 98 DEGs were increased between BC patients and healthy controls but decreased between iPSCs and somatic cells, which might be tumor-specific genes (Table S3D). The most significant GO categories of these DEGs were skeletal system development, defense response, chromatin assembly or disassembly, collagen fibril organization, and protein-DNA complex assembly (Figure S6A). Significantly enriched KEGG pathways included ECM-receptor interaction, systemic lupus erythematosus, and cytokine-cytokine receptor interaction (Figure S6B).
Clinical implications of common DEGs in BC based on TCGA
The relationship between DEG expression and BC prognosis was examined using TCGA data. After eliminating cases with incomplete clinicopathological parameters, only 455 BC patients were included. There were 678 genes in the above 761 DEGs that had mRNA expression values available. The clinicopathological features were shown in .
Table 3. The clinicopathological features in BC patients on TCGA data
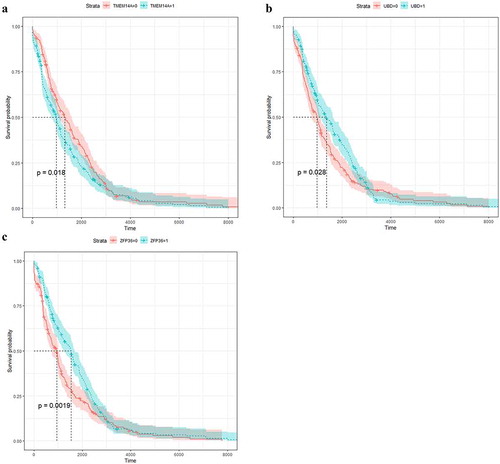
Nineteen of these DEGs showed a significant association with AJCC stage (), current molecular subtypes (), ER, PR, HER2, and pathological type but no significant association with survival prognosis. These 19 DEGs were C1orf106, CCNA2, CCNB2, CDC6, DLGAP5, DNMT3B, FAM72A, FAM72B, FAM83D, GGCT, KPNA2, MAML2, PTTG1, SKA3, TENC1, TPX2, TSPAN7, TTK, and UBE2C. Meanwhile, three DEGs were considered statistically significantly associated with AJCC stage, survival prognosis, and current molecular subtype (luminal A, luminal B, basal-like, HER2-enriched, and normal-like): TMEM14A (), UBD (), and ZFP36 (). Among these, the expression level of ZFP36 was also associated with pathological type (P = 0.006), UBD was significantly associated with ER (P = 0.000), and TMEM14A was associated with PR (P = 0.043) and pathological type (P = 0.006).
Figure 4. The relationship between the AJCC stage (a), current molecular subtypes (b) and 22 differentially expressed genes (DEGs) in BC patients on TCGA data, respectively. In both panels, the comparison groups were shown in the rows, whereas the DEGs were shown in the columns. The values in each box were P values that were obtained by Tukey multiple comparison tests. The background color of the red box indicated that DEGs were a significant difference in comparison group, that is, the P value is less than 0.05
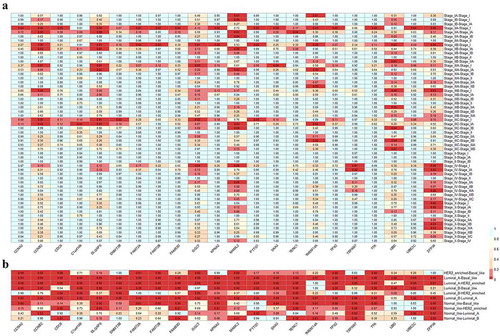
Figure 5. Kaplan-Meier survival analysis stratified according to low or high expression of TMEM14A (a), UBD (b), and ZFP36 (c) in breast cancer
The protein expression level of the common DEGs in Mcfips compared with Hips and MCFs
To explore the protein expression level of 22 of the above DEGs, we used the results of protein differential expression analysis in BC-iPSCs (Mcfips) compared with human iPSCs (Hips) and BC cells (MCFs) by using LC MS/MS iTRAQ technology. These results had already been published [Citation23]. SKA3 was up-regulated in BC patients and iPSCs, and its translated protein was down-regulated between Mcfips and Hips.
We also examined the protein levels of 761 DEGs of tumor cells, 7 of which were significantly altered. EEF1A2 and HN1L were up-regulated in BC patients compared with healthy controls and in iPSCs compared with somatic cells, and their translated proteins were up-regulated in Mcfips compared with Hips. AHCY, HELLS, and POLB were up-regulated in BC patients and iPSCs, and their translated proteins were down-regulated in Mcfips compared with Hips. ALPL was expressed at a higher level in reprogrammed somatic cells, but at a lower level in BC patients, and its translated protein was down-regulated in Mcfips compared with Hips. In contrast, the expression of S100A11 was decreased in iPSCs and increased in BC patients, and its translated protein was up-regulated in Mcfips compared with Hips. SORD was expressed at a higher level in both BC patients and iPSCs, and its translated protein was also up-regulated in Mcfips compared with MCFs. These DEGs were also significantly associated with several clinical variables, the results of which are shown in .
Table 4. The relationships between clinicopathological features and the differentially expressed genes (DEGs) whose translated proteins were differentially expressed in tumor stem cells
Enrichment analysis of DEGs that might offer novel biological markers for BC
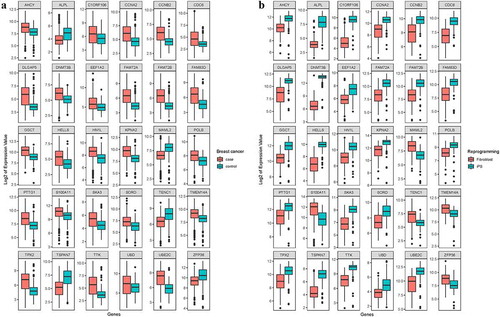
To obtain further evidence for 30 of the DEGs present in both tumors () and reprogramming () that might offer potential as biological markers of BC, gene functional analysis was used with GO enrichment. DEGs were significantly enriched in the BP GO categories of M phase (GO: 0000279), mitotic cell cycle (GO: 0000278), and cycle phase (GO: 0022403); and were also significantly enriched in the CC category of spindle (GO: 0005819) and microtubule cytoskeleton (GO: 0015630) (Supplementary ). KEGG pathway annotation further showed that these DEGs were predominantly enriched in the cell cycle (hsa04110).
Figure 6. Different expression levels of 30 genes in comparative groups of tumor (a) and reprogramming (b)
Discussion
BC is the most common cancer in females. Somatic cells could be reprogrammed into iPSCs with the hypodifferentiation process to achieve self-renewal ability, which was also present in the pathogenesis of cancer. Twelve percent of 290 DEGs that were up-regulated in both groups were related to chromosome function including DLGAP5, DNMT3B, HELLS, and SKA3. Thirty-six percent of the 254 significant DEGs that were down-regulated in both groups were associated with plasma membrane function (such as TENC1), and eleven percent of these DEGs were enriched in the regulation of RNA metabolic process function (MAML2 and ZFP36). Expression levels of 35% of 119 DEGs that were increased in iPSCs but decreased in tumor groups were also involved in plasma membrane function (ALPL and TSPAN7), and 3.9% of these DEGs were involved in be glucose metabolic process functions. 20% of 98 DEGs showing the reverse trend (i.e. decreased in iPSCs but increased in tumors) were enriched in ion binding function (S100A11), and 7% and 6% of 98 DEGs were associated with chromosomes and collagen, respectively. These functional annotation results suggested that chromosomes and collagen might play important roles in both biological processes. Changes in the pattern of gene expression played an important role in allowing cancer cells to acquire their hallmark characteristics, while genomic instability enables cells to acquire genetic alterations that promote oncogenesis [Citation24]. Chromatin was critical for the maintenance of genomic stability through modulation and maintenance of transcription patterns. Recent studies had identified frequent mutations in genes encoding chromatin regulatory factors and histone proteins that were required for cancer, development, stem cell maintenance, and differentiation [Citation25]. Collagen was a regulator of various signaling pathways and a key structural component of the extracellular matrix (ECM). When breast cells became cancerous, they would recruit surrounding cells, including cancerous-associated fibroblasts (CAFs), to reconstruct the ECM and promote cancer invasion and metastasis. Thus, a better understanding of ECM could lead to the identification of novel prognostic and diagnostic markers and therapeutic opportunities.
Some of 30 DEGs had been reported to be associated with BC. Among them, AHCY affected to G2/M arrest in BC cells (MCF7) and was an important regulator of cell proliferation through different mechanisms, such as p53 status in MCF7 and MCF7-ADR cells [Citation26]. EEF1A2, which was associated with estrogen-related receptor gamma signaling, may contribute to tamoxifen (TAM) resistance in the context of an active ERK/MAPK pathway in BC by combining with ESRRG and PPIF in a 3-gene signaling node [Citation27]. HELLS was identified as potentially involved in tumorigenesis and in the processes of tumor invasion and disease progression by integrative genomic and cross-species analysis of BC in Middle Eastern women in age-specific cohorts and in young women [Citation28]. HN1L was a targetable BC stem cell gene that was altered in 25% of whole BCs and significantly correlated with shorter overall or relapse-free survival in triple-negative BC patients [Citation29]. SKA3 was identified by whole-genome mate pair sequencing and RNA interference assays as a potential cancer gene with an impact on the growth and proliferation of BC cells [Citation30]. S100A11 was identified as a major differentially expressed calcium regulator by using bioinformatics data analysis and functional classification of proteins, which revealed a role of progesterone in calcium signaling in MCF7 cells [Citation31]. High S100A11 mRNA expression was found to be significantly correlated with worse outcomes, but was associated with better prognosis in all BC patients [Citation32].
The other genes were associated with other cancers, but not with BC. For example, SORD is related to cellular metabolism and androgen receptor (AR) is differentially expressed in tumor human prostate tissues [Citation33]. It interacted with hnRNP K, whose related signature that was associated with androgen sensitivity and PCa progression and might help clinicians better manage patients with castration-resistant prostate cancer [Citation34]. SORD was also associated with lung cancer (LC), and its mRNA expression level was down-regulated in A549 LC cells that were transfected with three transketolase-specific small interfering (si)RNAs compared with the negative control [Citation35], and was differentially expressed between early- and late-stage LC [Citation36]. However, recent research had highlighted that SORD and S100A11 were up-regulation in colorectal adenomas and/or adenocarcinomas compared with normal mucosa [Citation37]. POLB was expressed at a significantly higher-grade serous/endometrioid PDXs with TP53 mutations than in high-grade TP53 wild-type PDXs and its expression was positively correlated with the CDK12 mRNA expression levels in high-grade serous/endometrioid PDXs [Citation38]. The results of an association study showed that there was no association that was observed between SNPs in POLB and BC or healthy controls [Citation39].
ALPL was expressed at a higher level in reprogramming cells but at a lower level in tumor. Its encoded protein was down-regulated in Mcfips compared with Hips. ALPL encoded a tissue nonspecific alkaline phosphatase that is expressed in the liver, bone and kidney, and mutations in this gene had been reported to be related to hypophosphatasia (HPP), which was a rare inherited disorder characterized by hypercalcemia and skeletal defects [Citation40]. The latest research had shown that rare variants in ALPL were strongly associated with ovarian and uterine disorders [Citation41]. Its protein-protein interaction network in the STRING database (http://string.embl.de/) showed that ALPL was known to interact with COL4A1, COL4A2, COL4A3, COL4A4, COL4A5, COL4A6, ENPP1, GCH1, IBSP, and PTS. Previous studies suggested that overexpression of COL4A1 and COL4A2 was significantly associated with the progression and metastasis of BC [Citation42]. Another study indicated that COL4A2 siRNA significantly suppresses the migration and proliferation of triple-negative BC cells [Citation43]. Other research had indicated that established bone metastasis in BC patients was frequently incurable. Enpp1 was a potential facilitator of BC bone metastasis [Citation44], and was activated by loss of microRNA-27b which could promote the production of BC stem cells [Citation45]. Together, this evidence suggested that ALPL might be a useful biomarker for BC.
In conclusion, we compared the changes in gene expression that occur during the development of BC to those in the reprogramming of somatic cells. We found 30 DEGs related to clinical factors offering novel research targets to better understand the mechanisms underlying the pathogenesis and progression of BC.
Conflicts interest
The authors declare no conflict of interest.
Supplemental Material
Download Zip (16.2 MB)Disclosure statement
No potential conflict of interest was reported by the author(s).
Supplementary material
Supplemental data for this article can be accessed here.
Additional information
Funding
References
- Zoorob RJ, Salemi JL, Mejia De Grubb MC, et al. A nationwide study of breast cancer, depression, and multimorbidity among hospitalized women and men in the United States. Breast Cancer Res Treat. 2019;174(1):237–248.
- Fan L, Strasser-Weippl K, Li JJ, et al. Breast cancer in China. Lancet Oncol. 2014;15(7):e279–89.
- Zupunski L, Yaumenenka A, Ryzhov A, et al. Breast cancer incidence in the regions of Belarus and Ukraine most contaminated by the Chernobyl accident: 1978 to 2016. Int J Cancer. 2021;148(8):1839-1849.
- Lichtenstein P, Holm NV, Verkasalo PK, et al. Environmental and heritable factors in the causation of cancer--analyses of cohorts of twins from Sweden, Denmark, and Finland. N Engl J Med. 2000;343(2):78–85.
- Gradishar WJ, Anderson BO, Balassanian R, et al. Breast cancer, version 4.2017, NCCN clinical practice guidelines in oncology. J Natl Compr Canc Netw. 2018;16(3):310–320.
- Siegel RL, Miller KD, Jemal A. Cancer statistics, 2019. CA Cancer J Clin. 2019;69(1):7–34.
- Mihaly Z, Kormos M, Lanczky A, et al. A meta-analysis of gene expression-based biomarkers predicting outcome after tamoxifen treatment in breast cancer. Breast Cancer Res Treat. 2013;140(2):219–232.
- Yamanaka S. A fresh look at iPS cells. Cell. 2009;137(1):13–17.
- Riveiro AR, Brickman JM. From pluripotency to totipotency: an experimentalist’s guide to cellular potency. Development. 2020;147(16):dev189845.
- Brochard V, Beaujean N. Somatic reprograming by nuclear transfer. Methods Mol Biol. 2021;2214:109–123.
- Krizhanovsky V, Lowe SW. Stem cells: the promises and perils of p53. Nature. 2009;460(7259):1085–1086.
- Varum S, Rodrigues AS, Moura MB, et al. Energy metabolism in human pluripotent stem cells and their differentiated counterparts. PLoS One. 2011;6(6):e20914.
- Semi K, Matsuda Y, Ohnishi K, et al. Cellular reprogramming and cancer development. Int J Cancer. 2013;132(6):1240–1248.
- Beachy PA, Karhadkar SS, Berman DM. Tissue repair and stem cell renewal in carcinogenesis. Nature. 2004;432(7015):324–331.
- Goding CR, Pei D, Lu X. Cancer: pathological nuclear reprogramming? Nat Rev Cancer. 2014;14(8):568–573.
- Halley-Stott RP, Gurdon JB. Epigenetic memory in the context of nuclear reprogramming and cancer. Brief Funct Genomics. 2013;12(3):164–173.
- Reya T, Morrison SJ, Clarke MF, et al. Stem cells, cancer, and cancer stem cells. Nature. 2001;414(6859):105–111.
- Stingl J, Caldas C. Molecular heterogeneity of breast carcinomas and the cancer stem cell hypothesis. Nat Rev Cancer. 2007;7(10):791–799.
- Donovan PJ. High Oct-ane fuel powers the stem cell. Nat Genet. 2001;29(3):246–247.
- Nichols J, Zevnik B, Anastassiadis K, et al. Formation of pluripotent stem cells in the mammalian embryo depends on the POU transcription factor Oct4. Cell. 1998;95(3):379–391.
- Hochedlinger K, Yamada Y, Beard C, et al. Ectopic expression of Oct- 4blocks progenitor-cell differentiation and causes dysplasia in epithelial tissues. Cell. 2005;121(3):465–477.
- Dennis G Jr., Sherman BT, Hosack DA, et al. DAVID: database for annotation, visualization, and integrated discovery. Genome Biol. 2003;4(5): P3.
- Wang K, Shan Z, Duan L, et al. iTRAQ-based quantitative proteomic analysis of Yamanaka factors reprogrammed breast cancer cells. Oncotarget. 2017;8(21):34330–34339.
- Morgan MA, Shilatifard A. Chromatin signatures of cancer. Genes Dev. 2015;29(3):238–249.
- Laugesen A, Helin K. Chromatin repressive complexes in stem cells, development, and cancer. Cell Stem Cell. 2014;14(6):735–751.
- Park SJ, Kong HK, Kim YS, et al. Inhibition of S-adenosylhomocysteine hydrolase decreases cell mobility and cell proliferation through cell cycle arrest. Am J Cancer Res. 2015;5:2127–2138.
- Madhavan S, Gusev Y, Singh S, et al. ERRgamma target genes are poor prognostic factors in Tamoxifen-treated breast cancer. J Exp Clin Cancer Res. 2015;34(1):45.
- Colak D, Nofal A, Albakheet A, et al. Age-specific gene expression signatures for breast tumors and cross-species conserved potential cancer progression markers in young women. PLoS One. 2013;8(5):e63204.
- Liu Y, Choi DS, Sheng J, et al. HN1L promotes triple-negative breast cancer stem cells through LEPR-STAT3 pathway. Stem Cell Reports. 2018;10(1):212–227.
- Jiao X, Hooper SD, Djureinovic T, et al. Gene rearrangements in hormone receptor negative breast cancers revealed by mate pair sequencing. BMC Genomics. 2013;14(1):165.
- Azeez JM, Vini R, Remadevi V, et al. VDAC1 and SERCA3 mediate progesterone-triggered Ca2+ signaling in breast cancer cells. J Proteome Res. 2018;17(1):698–709.
- Zhang S, Wang Z, Liu W, et al. Distinct prognostic values of S100 mRNA expression in breast cancer. Sci Rep. 2017;7(1):39786.
- Szabo Z, Hamalainen J, Loikkanen I, et al. Sorbitol dehydrogenase expression is regulated by androgens in the human prostate. Oncol Rep. 2010;23:1233–1239.
- Capaia M, Granata I, Guarracino M, et al. A hnRNP K(-)AR-Related signature reflects progression toward castration-resistant prostate cancer. Int J Mol Sci. 2018;19(7):1920.
- Lu H, Zhu H. Effect of siRNA-mediated gene silencing of transketolase on A549 lung cancer cells. Oncol Lett. 2017;14:5906–5912.
- Lin CC, Chen LC, Tseng VS, et al. Malignant pleural effusion cells show aberrant glucose metabolism gene expression. Eur Respir J. 2011;37(6):1453–1465.
- Uzozie AC, Selevsek N, Wahlander A, et al. Targeted proteomics for multiplexed verification of markers of colorectal tumorigenesis. Mol Cell Proteomics. 2017;16(3):407–427.
- Guffanti F, Fratelli M, Ganzinelli M, et al. Platinum sensitivity and DNA repair in a recently established panel of patient-derived ovarian carcinoma xenografts. Oncotarget. 2018;9(37):24707–24717.
- Varadi V, Bevier M, Grzybowska E, et al. Genetic variation in genes encoding for polymerase zeta subunits associates with breast cancer risk, tumour characteristics and survival. Breast Cancer Res Treat. 2011;129(1):235–245.
- Xu L, Pang Q, Jiang Y, et al. Four novel mutations in the ALPL gene in Chinese patients with odonto, childhood, and adult hypophosphatasia. Biosci Rep. 2018;38(4). DOI:https://doi.org/10.1042/BSR20171377
- Dahir KM, Tilden DR, Warner JL, et al. Rare variants in the gene ALPL that cause hypophosphatasia are strongly associated with Ovarian and uterine disorders. J Clin Endocrinol Metab. 2018;103(6):2234–2243.
- Thangavelu PU, Krenacs T, Dray E, et al. In epithelial cancers, aberrant COL17A1 promoter methylation predicts its misexpression and increased invasion. Clin Epigenetics. 2016;8(1):120.
- JingSong H, Hong G, Yang J, et al. siRNA-mediated suppression of collagen type iv alpha 2 (COL4A2) mRNA inhibits triple-negative breast cancer cell proliferation and migration. Oncotarget. 2017;8(2):2585–2593.
- Lau WM, Doucet M, Stadel R, et al. Enpp1: a potential facilitator of breast cancer bone metastasis. PLoS One. 2013;8(7):e66752.
- Takahashi RU, Miyazaki H, Takeshita F, et al. Loss of microRNA-27b contributes to breast cancer stem cell generation by activating ENPP1. Nat Commun. 2015;6(1):7318.