
ABSTRACT
Prostate cancer is one of the most common cancer for men worldwide with advanced forms showing supernumerary or clustered centrosomes. Hematological and neurological expressed 1 (HN1) also known as Jupiter Microtubule Associated Homolog 1 (JPT1) belongs to a small poorly understood family of genes that are evolutionarily conserved across vertebrate species. The co-expression network of HN1 from the TCGA PRAD dataset indicates the putative role of HN1 in centrosome-related processes in the context of prostate cancer. HN1 expression is low in normal RWPE-1 cells as compared to cancerous androgen-responsive LNCaP and androgen insensitive PC-3 cells. HN1 overexpression resulted in differential response for cell proliferation and cell cycle changes in RWPE-1, LNCaP, and PC-3 cells. Since HN1 overexpression increased the proliferation rate in PC-3 cells, these cells were used for functional characterization of HN1 in advanced prostate carcinogenesis. Furthermore, alterations in HN expression led to an increase in abnormal to normal nuclei ratio and increased chromosomal aberrations in PC-3 cells. We observed the co-localization of HN1 with γ-tubulin foci in prostate cancer cells, further validated by immunoprecipitation. HN1 was observed as physically associated with γ-tubulin and its depletion led to increased γ-tubulin foci and disruption in microtubule spindle assembly. Higher HN1 expression was correlated with prostate cancer as compared to normal tissues. The restoration of HN1 expression after silencing suggested that it has a role in centrosome clustering, implicating a potential role of HN1 in cell division as well as in prostate carcinogenesis warranting further studies.
INTRODUCTION
Prostate cancer is one of the most significant and worldwide public health problems, characterized by neoplasms in men with 3rd most common cause of cancer-related deaths in Europe [Citation1]. Variation in incidence rates of prostate cancer has been associated with factors like race, geography, and ethnicity, which in part have been associated with exposure to risk factors associated with prostate cancer and accessibility to screening and treatment along with variability in molecular mechanisms that are involved in carcinogenesis of the prostate [Citation2]. Several studies have reported different proteins overexpressed in prostate cancer at different stages of carcinogenesis, leading to recognized and putative molecular markers for this disease [Citation3–7]. Centrosomes are key organelles in dividing animal cells that play important roles in the regulation of cellular processes including cell division, signal transduction, metabolic activities, and transport among others via their functionality as the major microtubule-organizing centers (MTOCs) inside cells [Citation8]. Centrosome dysfunction has long been recorded in cancer cells involving processes like impairment of centrosome duplication, regulation, centrosomal proteins, and phosphorylation states of centrosomal proteins [Citation9]. Cellular changes including genetic composition, architecture, and glandular organization are involved in the characterization of the progression of the prostatic tumor. Among these processes, genome stability and cellular architecture are largely regulated by centrosomes and the mitotic spindles originating from the centrosomes [Citation10]. Moreover, centrosome instabilities (either numerical or structural) have been known to contribute toward the increased genomic instability, loss of cellular architecture that leads to prostate cancer progression, and eventual lethality associated with the disease [Citation11].
Hematological and neurological expressed 1 (HN1) (154 amino acids) was first discovered from a cDNA library of a murine yolk sac, expressed in fetal and adult tissues including hematopoietic cells and fetal brain tissue [Citation12]. It is located on human chromosome position 17q25 encompasses several genes that are important in disorders including hereditary neuralgic amyotrophy and tylosis associated with esophageal cancer [Citation13] along with tumorigenesis of sporadic breast cancer and ovarian cancer [Citation14]. It has a homolog Hematological and neurological expressed 1 like (HN1L), having 30% sequence identity and 190 amino acids. 30 orthologues and paralogues of HN1 and HN1L have been reported across various invertebrates and vertebrates with their sequences being highly conserved in phylogeny. Therefore, the HN1 gene family term was established for being evolutionarily conserved and contained HN1, HN1lL, and their various pseudogenes as well [Citation15]. HN1 was one of the four genes that were 3-fold upregulated and distinguished tumor samples from normal ovarian surface epithelial cells [Citation16]. In murine glioma cell line (GL261) HN1 depletion did not affect cell proliferation, however, the tumors established from depleted HN1 GL261 cells were smaller in volume as compared to those with control cells [Citation17]. HN1 has been associated with castration-resistant prostate cancer (CRPC) as high expression of HN1 was detected along with 14 other genes that were associated with metastasis of prostate cancer [Citation18]. HN1 depletion in PC-3 cells resulted in prolongation of the G1 phase of the cell cycle and increased tetraploidy, while ectopic expression of HN1 showed reduced proliferation rate and accumulation of cells in G2/M. HN1 overexpression caused increased ubiquitination mediated degradation of androgen receptor (AR) in LNCaP cells (androgen responsive), while HN1 overexpression reduced colony formation and androgen-mediated (R1881) growth, however in androgen insensitive PC-3 and DU145, it increased the colony formation. The overexpression of HN1 altered the interactions between Cadherin and Catenin, which could be important in the context of tissue morphology, development, integrity as well as cellular polarity. This study was designed to determine its role in carcinogenesis-related pathways associated with advanced prostate cancer by characterizing HN1 in PC-3 cells [Citation19–21].
For studying the functions of genes that have not been well characterized, co-expression analysis data from datasets uploaded on Gene Expression Omnibus (GEO) database along with the cancer genome atlas (TCGA) program provides new insight and further databases have been constructed from the high-dimensional data from GEO and TCGA, including CoExpedia [Citation22] and GEPIA [Citation23]. We extracted HN1 co-expressed genes from CoExpedia and GEPIA and launched Gene Ontology (GO) enrichment analysis for cellular component (CC), molecular function (MF), and biological pathway (BP) by uploading the GO database on FunRich v3.1.1 software package [Citation24]. In light of the data collected from enrichment analysis, HN1 co-expressed genes were usually associated with chromosomal segregation and centrosome functions. Consequently, effects of HN1 aberrant expression on abnormal to normal nuclei ratio and chromosome numbers were observed in PC-3 cells. Furthermore, co-localization of HN1 at centrosomes was evaluated along with its role in centrosome functionality of formation of mitotic bipolar spindle assembly in prostate cancer cell lines. We further examined the cytoplasmic HN1 at different levels of prostate carcinogenesis including normal prostate epithelia, high-grade prostatic intraepithelial neoplasia [H-PIN], and adenocarcinoma tissues for the first time.
MATERIALS AND METHODS
Bioinformatics analysis of HN1
Gene Expression Profiling Interactive Analysis (GEPIA) containing gene expression data from The Cancer Genome Atlas (TCGA) was queried for Prostate Adenocarcinoma (PRAD). A box plot was generated with HN1 as a query gene for matching TCGA normal and The Genotype-Tissue Expression (GTEx) project data with |Log2FC| Cutoff as 1, p-value cutoff as 0.01, jitter size at 0.04, and log2(TPM + 1) for log scale [Citation23]. Survival plot for HN1 expression and its correlation with disease-free survival was constructed using group cutoff as median (high cutoff as 50% and low cutoff as 50%) and hazards ratio was calculated based on Cox PH model with 95% confidence interval shown by dotted lines on TCGA dataset from GEPIA database. In cBioportal database, JPT1 (HN1) was searched for prostate tissue-related data, and studies with mutation data available were found. The datasets available for mutations in HN1 in prostate cancer were screened with mutation minimum % altered cases as 1%, and for more stringent search a minimum number of total cases were set at 100. The co-expression database “CoExpedia” search platform was used to extract the co-expressed genes of HN1 from Gene Expression Omnibus (GEO) database[Citation22].HUGO Gene Nomenclature Committee (HGNC) Symbol of Hematological and Neurological Expressed 1, “HN1” was searched in Coexpedia through its online portal to collect all the co-expressed genes from the available human GEO datasets in CoExpedia database. Furthermore, HN1 co-expressed genes (479) were applied for enrichment analysis for Gene Ontology (GO) for molecular function (MF), biological process (BP), and cellular compartment (CC) by using FunRich version 3.1.3 [Citation24]. To narrow down the HN1 co-expression network in the context of prostate cancer, HN1 similar genes were detected from the TCGA PRAD expression dataset from the GEPIA database. Pearson correlation coefficient value greater than 0.5 was used as a threshold for implementing a stringent analysis on the HN1 co-expression pattern. 176 genes were identified and used for gene enrichment analysis using FunRich version 3.1.3 as described above.
Cell culture propagation and synchronization
RWPE-1 cells obtained from American Type Culture Collection (ATCC) were grown in specified media containing keratinocyte serum-free media (K-SFM) containing 5 ng/ml epidermal growth factor, 50 µg/ml bovine pituitary extract, and 1 % penicillin/ streptomycin/ amphotericin B. LNCaP cells (from ATCC) were grown in RPMI-1640 media containing 10% FBS, 1 % L-glutamine and 1% penicillin and streptomycin. PC-3 and MDA-MB231 (both p53-negative) cells were obtained from the American Type Culture Collection (ATCC; Manassas, VA) and were propagated as recommended in DMEM/F12 supplemented with 5 % fetal bovine serum (FBS), L-glutamine (2 mM), penicillin (100 U/ml) and streptomycin (100 µg/ml) at 37°C in a humidified atmosphere with 5% CO2. Cells were treated with cell cycle inhibitors to induce arrest at either S or G2/M using 1 µM aphidicolin (at 6 to 48 h, as appropriate) and/or 165 nM nocodazole (at 16 to 24 h), respectively. DU-145 cells were cultured in similar conditions as PC-3 cells as mentioned above and used for experiments to validate findings obtained in PC-3 cells.
HM-HN1 and siRNA transfections
The full-length open reading frame of HN1 cDNA was amplified using a forward primer, ATGACCACAACCACCAC, and a reverse primer, CTAACCCAAGACGAGGC (10 pmol each), which were designed using LightCycler Probe Design Software 2 (Roche, Germany). The PCR product was cloned into the pcDNA4-HM-TOPO vector (Invitrogen, UK) to have pcDNA4-HM-HN1 according to the manufacturer’s recommendations. The constructs were verified by PCR amplification before using in overexpression studies. Henceforth constructs will be named as HM vector or HM-HN1. The transfections were performed using the Fugene HD transfection reagent (Roche, Germany) according to the manufacturer’s recommendations. Briefly, cells were seeded into 60-mm plates 24 h before transfection. The following day, a transfection mixture was prepared by diluting 3 µl of transfection reagent in 100 µl of pre-warmed DMEM, incubating for 5 min, and adding 1 µg of plasmid DNA. The mixture was added to the cells dropwise after incubation for 15 min at room temperature (RT). The GFP-Centrin 1 and GFP-PLK4 plasmid constructs were kindly gifted by Michel Bornens (Institut Curie) and Dr. Ingrid Hofmann (Dana Farber Cancer Center) respectively.
PC-3 cells were transfected with HN1-specific (sc-93940) or scrambled siRNA purchased from Santa Cruz Biotechnology Inc. (Bergheimer, Germany). The HN1 siRNA (100 or 150 pmol where appropriate) was used to transfect cells with 10 µl of Fugene HD. The transfected cells were incubated for indicated periods for separate experiments. During the silencing experiments, siRNA transfections resulted in a substantial decrease (70–80%) in HN1 level for up to 72 h, a response that had been reported previously [Citation19,Citation21].
Cell proliferation and cell cycle distribution analysis
RWPE-1, LNCaP, and PC-3 cells were subjected to Trypan Blue Exclusion assay for determining the proliferation rate of the cells upon treatment with scrambled RNA, siRNA specific for HN1, pcDNA4-HisMax empty plasmid vector, and pcDNA4-HisMax-HN1 plasmid with Fugene HD transfection reagent at (DNA: Fugene HD as 1 µg: 3 µl). Viable cells were counted by hemocytometer. The cell cycle distribution of cells was determined by propidium iodide staining. Briefly, cells transfected with RNA and DNA were collected by trypsinization and washed with PBS solution. Cell pellet upon centrifugation was re-suspended in Triton-X100 (0.2%) containing PBS solution and incubated on a shaker for 5 minutes before centrifugation and resuspension in 20 µg/ml RNase A solution in PBS and incubation at 37°C for 30 minutes. After incubation, cells were centrifuged and re-suspended in 1 µg/ml PI solution in PBS and read on a flow cytometer (Accuri C5, Becton Dickinson). Flowjo v10 was used for cell cycle analysis and plotting phase-specific populations of cells used for analysis.
Giemsa staining of metaphase chromosomes and interphase nuclei
PC-3 cells in which HN1 was depleted or overexpressed were examined to determine the numbers of cells that were undergoing mitosis, that contained interphase nuclei with normal and abnormal morphologies and that exhibited altered chromosome numbers. Ratios were then calculated by comparing the results to those from control or vector-transfected cells. For this experiment, PC-3 cells were split into 25-cm2 flasks and transfected with scrambled siRNA, siHN1, HM vector, or HM-HN1 for 48 h. After transfection, the cells were exposed to 10 ng/ml colcemid for 4 h in a humidified chamber. The medium was collected and centrifuged at 200 g for 5 min. A hypotonic solution (1% sodium citrate) was added to the cell pellets, the cells were re-suspended and added to flasks, and the flasks were incubated at 37°C for 30 min. Following the incubation, the cells were scraped and washed at least 3 times with a mixture of methanol and glacial acetic acid (3:1) and centrifuged at 200 g for 5 min. After the last wash, the cell pellets were dropped onto coverslips and air-dried at RT. The dried coverslips were stained with Giemsa (10%), mounted on slides using a permanent mount, and evaluated using conventional microscopy (Nikon, Japan).
Antibodies
Antibodies against HN1 were either produced as previously described [Citation19] or purchased from Invitrogen (PA521779) or Sigma (Europe). Cyclin E (sc-377100), Cyclin A (sc-271682), Cyclin B (sc-166210), Cdk1 (sc-54), Cdk2 (sc-6248), PLK1 (Sigma Aldrich 05–844), Cdc20 (sc-13162), Cdh1/FZR1 (sc-56312) and Cdt1 (sc-365305) were used. Antibodies against Pericentrin, Centriolin, Centrin 2, CP110, pH3(S10), and γ-tubulin were purchased from Santa Cruz Biotechnology Inc. The β-tubulin antibody was purchased from BioVision (Mountain View, CA, USA) and β-actin antibodies were purchased from Sigma (Europe). Anti-mouse and anti-rabbit Alexa Fluor 405-, 488- and 594-conjugated antibodies were purchased from Invitrogen (Carlsbad, USA). The antibodies were used at concentrations of 0.2 to 1 µg/ml.
Centrosome duplication assay
Centrosome duplication assays were performed in PC-3, DU-145 and MDA-MB231 cells as previously described [Citation25]. Briefly, cells were transfected with scrambled or HN1 siRNA, and 16 h later, aphidicolin was added at a final concentration of 1 µM. The cells were fixed with ice-cold methanol 48 h later, labeled with anti-γ-tubulin antibody, and analyzed under a DMIL fluorescence microscope (Leica, Wetzlar, Germany).
Immunoprecipitations
Lysates were prepared as described above, and 0.5 mg of protein lysate was used for each immunoprecipitation (IP) experiment. Following 1-h preclearance of the lysates using 40 µl of IP matrix (Santa Cruz Biotechnology Inc), the lysates were divided into two aliquots and were incubated for 4 h with either a specific antibody or nonspecific IgG. Then, 40 µl of IP matrix was added to the lysate-antibody complex and incubated overnight to collect the complexes. The next day, the precipitates were washed twice with RIPA, denatured in 25 µl of Laemmli buffer at 95°C for 5 min, and immunoblotted.
Immunoblotting
GGCells were lysed with ice-cold RIPA buffer (1% Nonidet P-40, 50 mM Tris-HCl [pH7.4], 0.25 % Na-deoxycholate and 150 mM NaCl) containing 1 mM NaF, 1 mM EDTA, 1 mM Na3VO4 and complete protease and phosphatase inhibitors and cocktails (Roche), unless otherwise indicated. Proteins were separated on 10–15 % SDS-polyacrylamide gels and were transferred to PVDF membranes (Amersham, UK) using a wet transfer blotter. Briefly, the membranes were blocked using TBS-T (Tris-buffered saline containing 0.1% Tween-20) containing 5% skim milk (w/v). The antibody incubations were performed using TBS-T containing 0.5 % dry milk at RT for 1 h or at 4°C overnight. The membranes were developed using the ECL Plus reagent (Amersham, UK) for 5 min and were photographed using Kodak X-ray film in a dark room.
Immunofluorescence (IF) labeling and microscopy
Cells were grown on coverslips, and transfections were performed the next day. At the time of harvest, the cells on coverslips were rinsed with phosphate-buffered saline (PBS), fixed with cold methanol (−20°C) for 30 min, permeabilized with PBS containing 0.2 % Triton X-100 and blocked for 5 min using 1% bovine serum albumin (BSA) in PBS. Primary antibodies in PBS with 1% BSA were added to the cells, which were incubated in a humidified chamber for 1 h and washed four times with PBS. Secondary antibody incubations were performed at 37°C for 20 min using Alexa Fluor 594 (anti-mouse)- or Alexa Fluor 488 (anti-rabbit)-conjugated antibodies (Invitrogen, Carlsbad, CA). Finally, the cells were washed twice with PBS, mounted on slides with 30 % glycerol in PBS containing 0.5 µg/ml DAPI and analyzed immediately under a DM4000 LED B fluorescence microscope (Leica, Germany). Images were captured using 5.5-Mpix digital cameras and the Leica imaging software.
Lentiviral tet-ON system for HN1 in PC-3 cells
Briefly, HN1 ORF was digested from the aforementioned HM-HN1 construct using Sma1 and EcoRV, and cloned in pCW57.1 plasmid digested with Nhe1 and Sal1, obtained from Dr.Şerif Sentürk. The resulting pCW57.1-HM-HN1 plasmid was transfected along with packaging plasmids including pMD2G, pRSV-Rev, and pMDLg/pRRE into HEK293T cells with 1:3 (µg DNA: µl PEI) which were grown using DMEM/F12 media with 5% FBS in standard cell culture conditions. Chloroquine (25 µM) was given to cells 5 hours before transfection for boosting the transfection efficiency. The viral supernatant was collected 48 hr and 72 hr post-transfections and centrifuged at 16,000 g for 18 hours followed by resuspension in 100 µl PBS solution. Then, PC-3 cells were transduced with pCW57-HM-HN1 virus particles by using polybrene (10 µg/ml) and selected by puromycin (2 µg/ml) treatment for 6 days. PC-3 cells along with pCW57 empty vector and pCW57-HM-HN1 transduced were grown and HN1 induction by doxycycline (1 µg/ml) treatment for various time points in pCW57-HM-HN1 cells was validated by western blotting.
Immunohistochemistry
Tissue blocks containing the most representative areas from 12 radical prostatectomy specimens in hematoxylin and eosin (H&E)-stained tissue sections were chosen from each case (normal, high-grade prostatic intraepithelial neoplasia [H-PIN] and adenocarcinoma), and 5-mm sections were cut and placed on poly-L-lysine-coated slides for immunohistochemical staining. A standard streptavidin-biotin immunoperoxidase method was used with an HN1 antibody (GeneTex, dilution 1/100). Briefly, the tissue sections were deparaffinized in xylene, rehydrated in an alcohol series, and immersed in distilled water. The endogenous peroxidase activity was blocked with a 0.3% solution of hydrogen peroxide in PBS at RT for 10 min. The slides were then rinsed with Tris buffer (50 mM, pH 7.5). Primary antibodies were applied for 1 h at RT, and the slides were washed in Tris buffer. The secondary antibody and streptavidin-peroxidase complex (Invitrogen, Histostain Plus, 85–9043) were added consecutively for 10 min at RT, followed by washing. Peroxidase activity was visualized using 0.03% 3,3-diaminobenzidine tetrahydrochloride (DAB) (Sigma, UK), which was applied for 5 min. The sections were then washed in deionized water, counterstained with Mayer’s hematoxylin, and mounted. For the human samples, the appropriate consent was obtained and ethical guidelines were followed.
Statistical analysis
Images were analyzed with Image J software. Briefly, expression intensity measurements were performed for each cell using predefined boundaries of equal area and the following formulas: mean intensity = mean intensity (cell) – mean background (sample); fold difference (H-PIN or CaP) = mean intensity (H-PIN or CaP)/mean intensity (normal). The data values are presented as the means ± standard error of the mean (SEM). Differences in mean values between groups were analyzed using a two-tailed Student’s t-test. P < 0.05 was considered statistically significant.
RESULTS
HN1 co-expression network reveals its role in the centrosome, cell division, and microtubule related pathways
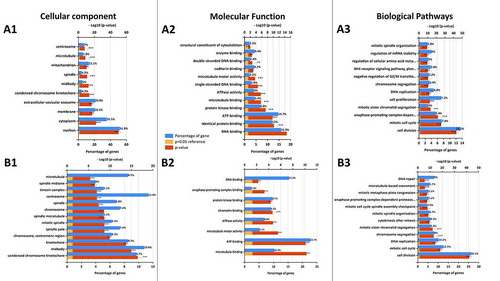
Using one of the latest co-expression database “CoExpedia”, co-expressions of the genes that could be functionally associated with HN1 were predicted and the number of genes that showed log-likelihood score (LLS) indicating the likelihood of co-functionality (LLS>1) was 479 as listed in the Supplementary Data 1. 42 of those genes reside on chromosome 17q in the human genome along with HN1. Enrichment analysis of HN1 co-expressed genes extracted from “CoExpedia” database using “FunRich v3.1.3” was carried out to determine Gene Ontology (GO) terms for Cellular Component (CC), Biological Process (BP), and Molecular Function (MF) in the Gene Ontology database for human (Taxon ID: 9606) (). GO CC analysis showed that almost half the number of genes were associated with cytosol, nucleoplasm, and nucleus. Meanwhile, other significantly associated cellular compartments with HN1 co-expressed genes include condensed chromosome kinetochore, midbody, spindle, and centrosome (A1). Molecular function (MF) analysis revealed that the HN1 co-expressed genes were significantly associated with protein, RNA, and kinase binding, ATPase activity, microtubule-binding, ATP binding, single-stranded DNA binding, and microtubule motor activity among others (A2). GO biological process analysis showed that the highest percentage of HN1 co-expressed genes were significantly involved in the processes of cell division, mitotic cell cycle, anaphase-promoting complex (APC/C) dependent proteasomal degradation, mitotic sister chromatid segregation, DNA replication, cell proliferation, chromosome segregation, and mitotic spindle organization among others (A3). HN1 co-expression network specific for prostate cancer obtained from TCGA PRAD data showed 176 genes with Pearson correlation co-efficient ≥ 0.5 (Supplementary Data 2) and most of the genes in the work were enriched for kinetochore, midbody, centromere, spindle pole, centrosome, and microtubule for CC terms (B1). The molecular function analysis for the same set of genes indicates microtubule binding, ATP binding, microtubule motor activity, ATPase activity, chromatin binding, protein kinase binding, and anaphase-promoting complex binding as functions for the co-expression network of HN1 (B2). The biological pathway terms associated with the HN1 network in the context of prostate cancer are cell division, mitotic cell cycle, DNA replication, chromosome segregation, mitotic sister chromatid segregation, cytokinesis, mitotic spindle organization, APC/C dependent proteasome degradation, mitotic metaphase plate congression, and microtubule-based movement (B3).
Figure 1. (a) Gene Ontology annotation of HN1 co-expressed genes. (A1) Cellular Component (CC), (A2) Molecular Function (MF), and (A3) Biological Pathway (BP) are shown with percentages of HN1 co-expressed genes extracted from the CoExpedia database. Data for CC, MF, and BP was on analysis in FunRich by uploading the “Gene Ontology” database by using Bonferroni corrected p-value for construction of graphs. For CC analysis, redundant terms like cytosol, nucleoplasm, and nucleolus were removed for broader analysis and cutoff values for gene percentage and – log10 (p-value) were 4 and 7 respectively. For MF analysis, cutoff values for gene percentage and – log10 (p-value) were 2 for each (the term “protein binding” was excluded as it indicated 74.9% genes being enriched), while BP analysis is shown for the top 12 entries revealed in the FunRich v3.1.1 software package. (b)Gene Ontology annotation of HN1 co-expressed genes in TCGA PRAD. (B1)Cellular Component (CC), (B2) Molecular Function (MF), and (B3) Biological Pathway (BP) are shown with percentages of HN1 co-expressed genes extracted from TCGA PRAD tumor expression dataset from the GEPIA database. Data for CC, MF, and BP was on analysis in FunRich as shown above. For CC analysis, redundant terms like cytosol, nucleoplasm, and nucleus were removed for broader analysis and cutoff values for gene percentage and – log10 (p- value) were 4 and 6 respectively. For MF analysis, cutoff values for gene percentage and – log10 (p-value) were 2 for each (the term “protein binding” was excluded as it indicated 81.3% genes being enriched), while BP analysis is shown for the top 12 entries revealed in the FunRich v3.1.1 software package
Aberrant HN1 expression alters the cell proliferation rate and cell cycle distribution differentially in different prostate cells
HN1 silencing led to a decrease in proliferation in LNCaP () and PC-3 cells (), while no change was observed in RWPE-1 cells (). Meanwhile, HN1 overexpression decreased proliferation in RWPE-1 () and LNCaP cells () and increased the number of viable PC-3 cells (). The effect of HN1 silencing in these cells indicated that the HN1 expression is required for growth of Prostate cancer cells that are androgen-responsive (LNCaP) and androgen insensitive (PC-3). However, when HN1 is overexpressed, only androgen insensitive prostate cancer cells (PC-3) can proliferate more as compared to control cells, suggesting that advanced prostate cancer cells require HN1 to show an aggressive phenotype ().
Figure 2. Effect of altered HN1 expression on cell proliferation and cell cycle in different prostate cell lines: Cell proliferation was measured by trypan blue exclusion assay for different treatments including transfections with scrambled control RNA, siRNA specific for HN1, empty His-Max vector, and HM-HN1 plasmids in (a) RWPE-1 cells, (b) LNCaP cells and (c) PC-3 cells showing * where p ˂ 0.05 and *** where p ˂ 0.001. The cells from (A), (B), and (C) were subjected to cell cycle phase distribution analysis by staining the cells with propidium iodide and read on a flow cytometer and analyzed on flowjo software v10 where asterisks represent significant differences among cellular populations in different conditions for (d) RWPE-1, (e) LNCaP and (f) PC-3 cells. (g) The western blotting was performed to determine the changes in specific protein levels when HN1 was overexpressed by transfecting cells with either HM-vector or HM-HN1. The ectopic band specific for HN1 shows the efficiency of transfection by Fugene HD transfection reagent. HN1 expression was determined to be negligible for normal (non- tumorigenic) prostate epithelial cells (RWPE-1) as compared to prostate cancer cells LNCaP and PC-3. The loading control for the western blotting was β-actin
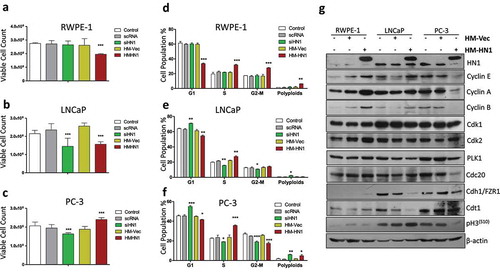
HN1 silencing increased the population of G1 cells in both LNCaP (62.5 ± 1.6 to 70.8 ±0.5) and PC-3 cells (45.2 ± 0.8 to 54.75 ± 0.7) () with no change in RWPE-1 cells as compared to control RNA transfected cells (). HN1 depletion also resulted in higher polyploidy cells in PC-3 (from 1.38 ± 0.2 to 6.00 ± 0.4). Furthermore, overexpression of HN1decreased G1 population in RWPE-1 (59.2 ± 0.81 to 33.605 ± 0.65), LNCaP (61.3 ± 1.7 to 54.49 ± 1.02) and PC-3 cells (44.87 ± 0.62 to 41.64 ± 0.36) (). The S-phase population was observed to be increased in all cell lines upon HN1 overexpression as compared to HM-vector transfected cells; from 21.64 ± 0.64 to 31.88 ± 0.52 for RWPE-1 cells from 22.14 ± 0.54 to 27.27 ± 0.97 for LNCaP and from 23.62 ± 2.37 to 35.69 ± 0.59 for PC-3 cells (). Since the proliferation of cells is reduced in HN1 overexpressed RWPE-1 and LNCaP (), it is inferred that the cells are arrested in S and G2 in RWPE-1 cells with increased polyploidy (from 1.88 ± 0.63 to 6.31 ± 0.1) () and arrested in S phase in LNCaP cells as G2-M population is not altered (). In the case of PC-3 cells, the proliferation rate is higher in HN1 overexpressed cells, therefore, the cell cycle is shortened with a large proportion of cells in the S phase with a slight increase in polyploid cells (from 1.78 ± 0.21 to 4.85 ± 1.13). These results show that HN1 functions differently in different prostate cells including androgen-sensitive LNCaP and androgen insensitive and advanced prostate cancer PC-3 cells (Figure S2A).
The effect of HN1 overexpression in aforementioned cells on different cell cycle-regulated proteins was determined by western blotting and densitometry analysis from is shown in Supplementary Information (Figure S2B). HN1 ectopic expression leads to an increase in Cyclin E, Cyclin A, Cyclin B, Cdk2, Cdc20, and PLK1 expression with no change in pH3(S10), Cdk1, and Cdh1 expression in RWPE-1 cells that show increased S, G2, and polyploidy populations. In LNCaP cells, HN1 overexpression led to an increase in pH3(S10) and Cyclin E, decrease in Cdk2, Cdk1, Cdt1, Cdh1, and PLK1 expression, while no change was observed in Cdc20, Cyclin B, and Cyclin A expression with cells showing increased S-phase arrested population. In PC-3 cells, HN1 overexpression by transfection caused an increase in Cdt1 expression, decrease in pH3(S10), Cyclin E, Cdc20, Cyclin B, Cyclin A, and PLK1 expression with no change in Cdk2, Cdk1, and Cdh1 in cells showing increased S phase and polyploidy populations as compared to control cells. Cyclin A, Cyclin B, Cdt1, Cdc20, and PLK1 are HN1 co-expressed genes determined from the TCGA PRAD dataset. HN1 overexpression led to an increase of Cyclin A in RWPE-1 and PC-3 cells, with no change in LNCaP cells. Cdc20 was increased in RWPE-1, decreased in PC-3 cells without changing expression in LNCaP cells when HN1 was overexpressed. PLK1 on the other hand was increased in RWPE-1 cells and decreased in both LNCaP and PC-3 cells. HN1 overexpression resulted in increased Cdt1 in RWPE-1 and PC-3 cells whereas decreased Cdt1 in LNCaP cells. Cyclin B however, was increased in RWPE-1 cells and decreased in PC-3 cells with no change in LNCaP cells when HN1 was overexpressed by plasmid transfections. Thus, HN1 expression is critically important for regulation of S phase progression at varying levels in prostate cell lines. DU-145 cells also showed an S-phase arrest when HN1 was overexpressed whereas silencing led to increased G1 and polyploid populations (supplementary figure S3).
HN1 level alterations lead to abnormal nuclear structures and chromosome numbers
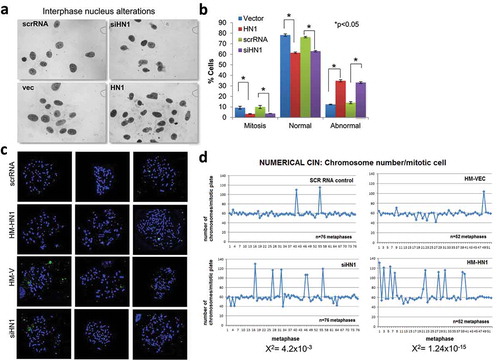
To examine the role of HN1 in the fidelity of chromosome segregation, HN1 was depleted or overexpressed in PC-3 cells and the cells were stained with Giemsa to evaluate alterations in nuclear shape and micronucleus formation (). The results showed that both HN1 depletion using siRNA and HN1 overexpression by HM-HN1 transfections significantly reduced the percentage of mitotic cells, resulted in abnormal nuclear morphology in interphase, and increased the frequency of abnormal to normal nuclei ratio along with micronucleus formation (). Because micronucleus formation has been associated with increased rates of genomic instability[Citation26], we used conventional cytogenetic methods to identify numerical and/or structural alterations in metaphase chromosomes (). Interestingly, in cells stained with inverted DAPI banding, both the depletion and overexpression of HN1 resulted in a significant increase in the frequency of spontaneous whole-genome duplication (polyploidization) (). In summary, variations in HN1 expression may influence the spindle assembly checkpoint (SAC) and are required for appropriate cell division while its abundance is tightly regulated in dividing cells highlighting the importance of stable HN1 expression in prostate cancer cell division processes.
Figure 3. HN1 influences the ratio of normal nuclei to abnormal nuclei with chromosomal abnormalities. (a) Nuclear abnormalities were observed in cells with alterations in HN1 expression caused by either ectopic expression or silencing. (b) The results obtained by counting the nuclei (n > 100 for mitosis; n > 250 for interphase; *P < 0.05). (c and d) Alterations in HN1 expression caused significant changes in chromosome number (the numbers of metaphases for scrRNA, siHN1, HM-Vector, and HM-HN1 were 76, 76, 52, and 52, respectively). The Chi- square test was applied to analyze degrees of freedom (χ2 = 4.2 × 10⁻³ for siHN1 and 1.24 × 10⁻¹⁵ for HM-HN1 independence)
HN1 localizes to centrosomes and physically associates with γ-tubulin
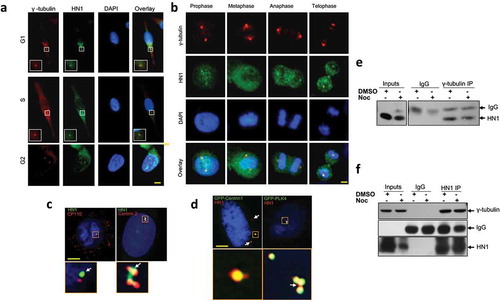
In a previous study [Citation19], HN1 was primarily found in a diffuse pattern in the cytoplasm of MCF7 and PC-3 cells, but it underwent a subcellular localization change that was dependent on epidermal growth factor (EGF) stimulation. In this study, for the first time, we show that HN1 accumulates in specific structures and forms foci in the cytoplasm of PC-3 cancer cells. To determine whether HN1 localization coincides with centrosomes, we examined the subcellular localization and the time of expression of HN1 in synchronized PC-3 cells. Nocodazole-treated and control cells were subsequently released from the nocodazole (a specific inhibitor of microtubule polarization) block at different times (0, 1, 4, or 8 h) to synchronize and enrich cell populations at different phases of the cell cycle. When these cells were immunolabeled for both γ-tubulin and cellular HN1, we observed that HN1 partially co-localized with γ-tubulin at centrosomes during all the phases of the cell cycle () and mitosis (). When these cells were also immunolabeled for Centrin 2, CP110, and cellular HN1 respectively, we found that HN1 also co-localized with these proteins () as well as overexpressed GFP-Centrin1 and GFP-PLK4 in PC-3 cells (). To ascertain whether these co-localizations involve a physical association, control, and nocodazole-treated PC-3 cell lysates were immunoprecipitated with γ-tubulin antibody and HN1 was detected by immunoblotting (). Reciprocal IP was also performed using the anti-HN1 antibody to confirm the association in PC-3 cells (). Taken together, the results demonstrate that HN1 associates spatially and biochemically with γ-tubulin in centrosomes either in cells treated with nocodazole or in control cells without inhibitors, further implying the role of HN1 in the centrosome regulation in prostate cancer cells. HN1 expression in TCGA PRAD dataset coincides with the centrosomal proteins listed in . HN1 was also observed to be co-localized with γ-tubulin in DU-145 cells as shown in supplementary figure S3.
Table 1. Centrosome pathway-related genes in HN1 co-expression network in TCGA PRAD with PCC association (p ˂ 0.05 *)
Figure 4. HN1 localizes to the centrosome. During (a) interphase and (b) mitosis HN1colocalized with γ-tubulin, (c) CP110, and Centrin 2. Immunostainings were visualized either using Alexa Fluor 488 (green) or Alexa Fluor 594 (red) where indicated. DNA was stained with DAPI (blue). (d) Also, ectopically expressed GFP-Centrin 1 and GFP-PLK4 colocalize with HN1 in centrioles. The physical association of HN1 with γ-tubulin was demonstrated using immunoprecipitation, in control and nocodazole-treated PC-3 cells using (e) anti-γ-tubulin and (f) anti-HN1 antibodies. Scale bars for immunofluorescence images: A. and B. 10 µm., C. and D. 5 µm. Lower squares represent centrosome images, digitally magnified more from the original image
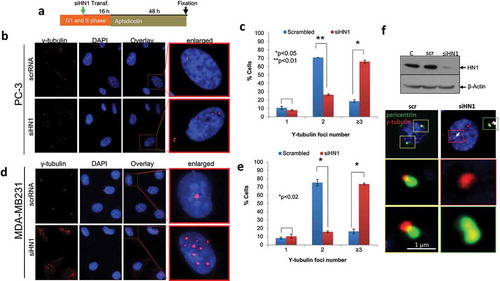
HN1 depletion causes an increase in the number of γ-tubulin foci
Several proteins that localize to MTOCs have previously been shown to play roles in centrosome duplication [Citation25,Citation27]. Since HN1 was observed to be localized to MTOCs (γ-tubulin) during all phases of the cell cycle, their role in centrosome functionality was evaluated. HN1 siRNA transfection was performed for HN1 depletion and the cells were treated with aphidicolin. Forty-eight hours later, the control and HN1-depleted cells were fixed and stained with γ-tubulin (). Aphidicolin treatment was used to block DNA replication and the progression of the cell cycle beyond the S phase [Citation28]. Because this treatment does not affect centrosome duplication, we then used IF microscopy to quantify the proportions of cells with 1, 2, or more MTOCs. Our results revealed that 10.7 ± 1.82% control PC-3 prostate cancer cells exhibited single, 70.7 ± 0.12% exhibited two and 18.63 ± 1.69% exhibited three or more γ-tubulin foci whereas HN1 depletion caused a dramatic increase in the numbers of PC-3 cells with amplified foci (7.6 ± 0.66% cells with one, 26.3 ± 1.06% with two and 65.9 ± 1.73% with three or more γ-tubulin foci) (). Similar results were obtained in MDA-MB231 cells (a control cell line), of which 8.3 ± 1.12% exhibited one, 75.3 ± 3.81% exhibited two, and 16.4 ± 2.68% exhibited three or more γ-tubulin foci in the control cells. However, upon HN1 depletion, the proportions of cells with amplified MTOCs increased significantly (10.6 ± 2.48% single, 15.8 ± 1.36% two and 73.6 ± 1.11% three or more γ-tubulin foci) (). To confirm whether the quantified foci were part of mature centrosome structures, pericentrin staining was performed in HN1-depleted cells. We found that pericentrin- and γ-tubulin-associated MTOCs were disrupted in HN1-depleted cells compared with the controls, in which both molecules were close to each other (). These results suggest that HN1 may contribute to the formation of intact centrosome structures. The γ-tubulin-associated MTOCs were significantly increased in number and failed to associate with pericentrin in the absence of HN1 in S/G2 cells. Thus, the expression level of HN1 might be critical for centrosome maturation. DU-145 cells were also silenced for HN1 expression and reveal increased γ-tubulin foci as compared to control cells (supplementary figure S3). However, the exact mechanism of HN1 playing its role in centrosome maturation needs further studies. This experimental approach provided an initial understanding of HN1 being a putative partial centrosomal protein, which might be required for centrosome processes including regulation of centrosome and even centrosome clustering in advanced carcinogenesis as it is observed to be increased in prostate cancer.
Figure 5. The HN1 expression level influences number of y-tubulin foci. (a) The experimental design. When HN1 was depleted and subsequently blocked at S phase with aphidicolin, an increased number of γ-tubulin cores were observed (b, c) in PC-3 cells (n ≥ 300; 944 *P < 0.05, **P < 0.001) and (d,e) in MDA-MB231 cells (n ≥ 200 and *P < 0.02). The γ-tubulin was visualized with Alexa Fluor 594 (red), and the DNA was stained with DAPI (blue). (f) When HN1 was depleted in S phase-arrested PC-3 cells, pericentrin and γ-tubulin did not colocalize. The γ-tubulin (long white arrow) and pericentrin (arrowheads) were visualized with Alexa Fluor 594 (red) and Alexa Fluor 488, respectively. The nuclei were stained with DAPI (blue). Arrowheads indicate centrosome structures involving pericentrin that were duplicated. Digitally magnified images of centrosomes are also shown. The scale bar represents 1 µm
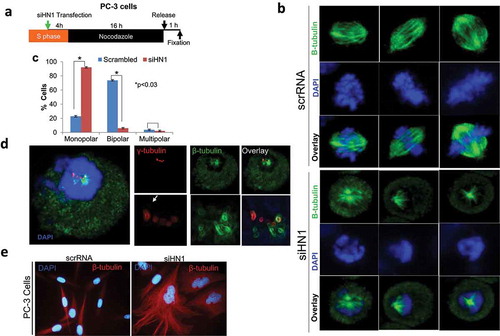
Effect of HN1 depletion on bipolar spindle assembly in PC-3 cells
To investigate the putative link between HN1 and the formation of multiple centrosomes, γ-tubulin structures, and spindle fiber formation, PC-3 cells were depleted for HN1 and blocked with nocodazole for 16 h. The cells were fixed and labeled with a ß-tubulin-specific antibody 1 h after being released from the nocodazole block (). Interestingly, monopolar spindles called mono-astral structures [Citation29,Citation30] were observed more frequently in the HN1-depleted cells than in the control cells (). When the dividing cells were counted (22.8 ± 4.6% of the control cells were monopolar, 73 ± 5.4% bipolar and 3.6 ± 0.8% multipolar) (), a significant increase in the frequency of monopolar centrosomes were observed in the HN1-depleted cells (91.9 ± 1.6% monopolar, 5.9 ± 1.8% bipolar and 2.1 ± 0.2% multipolar) (). Since monopolar spindle formation is a result of an abnormal series of events that usually occur in the absence of centrosome duplication or involve imbalanced activity of mitotic motors [Citation31], the data suggested that HN1 depletion might lead to abnormal spindle formation by abrogating the appropriate centrosome regulation. Indeed, co-staining of β- and γ-tubulins revealed abnormal β-tubulin nucleation in PC-3 cells depleted for HN1. Notably, despite the presence of multiple putative γ-tubulin MTOCs, most of the HN1-depleted dividing cells displayed single nucleation sites with spindles originating only from one of the multiple γ-tubulin cores (). Presumably, this result was due to the disruption of the association between γ-tubulin and pericentrin, which was previously observed in HN1-depleted S/G2 cells (). Consistently, these findings demonstrate that the depletion of HN1 causes multiple formations of scattered γ-tubulin foci, whereas microtubule nucleation occurs at only one of these putative MTOCs, perhaps at the intact mother centriole-containing centrosome. The HN1-depleted cells showed analogous distortions in the perinuclear pattern of β-tubulin, a remarkable enlargement of the cytoplasm in terms of microtubules, and the loss of spindle cell morphology together with bipolarity (). Upon HN1 silencing, DU-145 cells were released from nocodazole block to reach metaphase, also exhibited monopolar and pseudo-bipolar cells (supplementary figure S3). Overall, these results suggest that HN1 plays important role in cytoskeletal integrity, microtubule formation, and spindle assembly as presumed from the HN1 co-expression network in the context of advanced prostate cancer cell lines ().
Figure 6. HN1 plays a role in microtubule organization. The depletion of HN1 before the G2phase led to the disruption of MTOCs, causing an increased number of γ-tubulin particles to form. (a) The experimental design. (b, c) HN1 depletion before the G2/M transition caused the formation of monopolar spindles in PC-3 cells. (d) Most of the γ-tubulin centers that emerged after HN1 depletion could not nucleate β-tubulin. Extending the culture of the HN1-depleted cells from 24 to 48 h resulted in irregular microtubules and deformed nuclear structures. In the lower panels of the image, a “glowing edges” filter was used to show the boundaries of the emerging structures and the sites of co-localization of γ- and β-tubulin. (e) Anti-β-tubulin was added to synchronized but HN1-depleted to PC-3 cells. Secondary antibodies were labeled with Alexa Fluor 594 (red) in PC-3 cells. The DNA was stained with DAPI (blue)
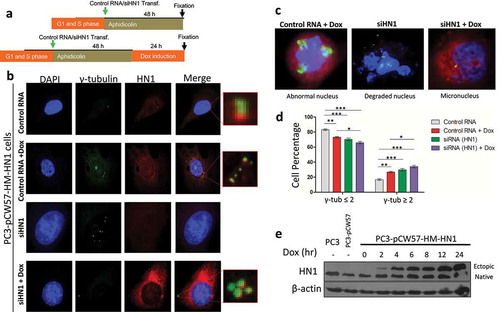
Restoration of HN1 expression in HN1-depleted cells lead to clustering-like phenotype for γ-tubulin
Since HN1 depletion led to a cellular phenotype of centrosome amplification, the overexpression of HN1 should also result in centrosome-related changes; therefore, HN1 expression was restored in HN1 depleted cells (). For generating a doxycycline-inducible cell line for HN1 expression, PC-3 cells were transduced with pCW57-HM-HN1 particles and selected with puromycin. Centrosome duplication assay was repeated in these cells and HN1 expression was induced by doxycycline either after HN1 depletion by siRNA or control RNA transfection. After fixation, cells were stained with anti-HN1 and anti-γ-tubulin antibodies, and were examined using immunofluorescence microscopy. HN1 depletion resulted in a similar phenotype as observed in , however, HN1 overexpression showed γ-tubulin foci to be positioned appropriately but still amplified (not much as compared to HN1 depleted cells). The results showed that cells transfected only with control RNA exhibited γ-tubulin ≤ 2 population as 83.23 ± 1.03% and γ-tubulin ≥ 2 population as 16.75 ± 1.04%, while HN1 overexpressed cells exhibited lower γ-tubulin ≤ 2 population as 71.11 ± 1.0% and a higher γ-tubulin ≥ 2 population as 26.88 ± 1.0%. When HN1 was depleted, it led the cells to a decrease in γ-tubulin ≤ 2 population as 70.28 ± 1.68% and an increase in γ-tubulin ≥ 2 population as 29.71 ± 1.4% as compared to control RNA treated cells. When rescued after silencing by doxycycline treatment, HN1 expression led to again a decrease in γ-tubulin ≤ 2 population as 65.86 ± 1.69% and an increase in γ-tubulin ≥ 2 population as 34.14 ± 1.03% as compared to cells with unaltered HN1 levels (). The amplified and scattered γ-tubulin foci were observed mostly in HN1 silenced cells, while γ-tubulin foci became clustered in HN1 rescued cells (overexpressed after silencing), implicating that HN1 is a centrosome clustering protein.
Figure 7. HN1 expression rescue by Tet-ON inducible expression system and its effect on γ-tubulin foci number and nuclear morphology: (a) Experimental design for centrosome duplication assay. (b) PC-3 cells stably transduced with pCW57-HM-HN1 particles and selected by 2 µg/ml puromycin were plated in 6-well plates and given scrRNA or siHN1 and induced with doxycycline (1 µg/ml) for HN1 expression. After cell fixation in methanol, cells were stained with anti-HN1 and anti-γ-tubulin antibodies as primary antibodies and Alexa Fluor-488 (green) and Alexa Fluor-594 (red) as secondary antibodies and counterstained with DAPI (0.25 µg/ml). (c) Phenotypically abnormal nuclei arising as a result of altered HN1 expression in prostate cancer cells are highlighted. (d) The statistical analysis of the observations from the HN1 restored expression is shown where n ≥ 100; *P < 0.05, **P < 0.01 and ***P < 0.001. When induced with doxycycline HN1 overexpression leads to a higher population of cells with γ-tubulin ≥ 3 (**), while silencing HN1 also converges to a similar but more significant result (***). When HN1 expression is restored in HN1 depleted cells, the population of cells with γ- tubulin ≥ 3 also increased. However, most of the cells showed clustered centrosomes as seen in (B). (e) The inducible expression of HN1 was validated by western blotting using HN1 antibody showing distinct ectopic bands and native expression of HN1 in stable PC-3 cells given doxycycline for indicated periods
Cytoplasmic localization and mRNA levels of HN1 in prostate cancer
To examine HN1 expression level in in vivo, adjacent sections of 12 radical prostatectomy specimens from different stages of prostatic neoplasia (H-PIN and carcinoma), including normal boundaries, were analyzed. The HN1 staining in the cytoplasm of H-PIN and prostate cancer (CaP) samples was uniform and increased by 1.57- and 1.42-fold, respectively, compared with normal prostate epithelial cells. The results revealed that cytoplasmic HN1 expression was significantly increased in H-PIN (P = 0.0014) and CaP (P = 4.9 × 10⁻⁵) compared with normal epithelia (). Thus, an increase in the expression of HN1 is strongly associated with H-PIN formation and the progression of prostate cancer to an advanced stage. Since HN1 expression was correlated with prostate cancer, the survival plot was generated and it revealed that although higher HN1 expression shows a hazards ratio of 1.7; however, it is not considered as a prognostic marker for prostate cancer (). Furthermore, the c-Bioportal database was searched for HN1 mutations and it revealed that there are five publically available prostate cancer datasets with ˃100 samples showing ˃1% mutation rate for HN1 in prostate cancer patients (). Moreover, mRNA expression of HN1 in the PRAD dataset analyzed in the GEPIA database also showed a significant increase (P < 0.01) in prostate adenocarcinoma (n = 492) as compared to normal tissue samples (n = 152) (). These changes in the expression of HN1 could represent early events in the carcinogenesis of the prostate.
Figure 8. HN1 expression in normal prostate and prostate cancer samples. (a) Normal, H-PIN, and PCa regions were excised from 12 radical prostatectomy specimens for analysis. The sections were stained with hematoxylin-eosin (H&E) dye, and an anti-HN1 antibody was used to examine expression changes. Adjacent sections were cut in parallel and were stained with either H&E (a, b and c) or an anti-HN1 antibody (d, e, and f). Representative images from prostate H- PIN lesions (b, e, and h) and adenocarcinomas (c, f, and j) are shown. (b) A representative graph was created for a more accurate evaluation of the difference. The cells from normal prostate glands exhibited very low levels of HN1 expression; however, the H-PIN and CaP regions showed significantly higher levels of HN1 expression (P = 0.0014 and 4.9 × 10⁻⁵[Citation5], respectively). Images (a-f) were obtained with a 20x objective lens and were (g-j) digitally magnified (3.2x). (c) The survival plot for describing the HN1 expression and its correlation with the prognosis of prostate cancer was constructed by showing the disease-free survival analysis on the TCGA PRAD tumor dataset using GEPIA, where the hazards ratio was calculated using the Cox PH model. (d) The studies/datasets confirming that HN1 is mutated in prostate cancer were screened using the c-Bioportal database. (e) A box plot was generated in GEPIA with HN1 as a query gene for matching prostate adenocarcinoma (PRAD) TCGA normal and The Genotype-Tissue Expression (GTEx) project data with |Log2FC| Cutoff as 1, p-value cutoff as 0.01, jitter size at 0.04 and log2(TPM + 1) for log scale. Num(t) represents the number of tumor samples, while num (n) represents the number of normal prostate samples
![Figure 8. HN1 expression in normal prostate and prostate cancer samples. (a) Normal, H-PIN, and PCa regions were excised from 12 radical prostatectomy specimens for analysis. The sections were stained with hematoxylin-eosin (H&E) dye, and an anti-HN1 antibody was used to examine expression changes. Adjacent sections were cut in parallel and were stained with either H&E (a, b and c) or an anti-HN1 antibody (d, e, and f). Representative images from prostate H- PIN lesions (b, e, and h) and adenocarcinomas (c, f, and j) are shown. (b) A representative graph was created for a more accurate evaluation of the difference. The cells from normal prostate glands exhibited very low levels of HN1 expression; however, the H-PIN and CaP regions showed significantly higher levels of HN1 expression (P = 0.0014 and 4.9 × 10⁻⁵[Citation5], respectively). Images (a-f) were obtained with a 20x objective lens and were (g-j) digitally magnified (3.2x). (c) The survival plot for describing the HN1 expression and its correlation with the prognosis of prostate cancer was constructed by showing the disease-free survival analysis on the TCGA PRAD tumor dataset using GEPIA, where the hazards ratio was calculated using the Cox PH model. (d) The studies/datasets confirming that HN1 is mutated in prostate cancer were screened using the c-Bioportal database. (e) A box plot was generated in GEPIA with HN1 as a query gene for matching prostate adenocarcinoma (PRAD) TCGA normal and The Genotype-Tissue Expression (GTEx) project data with |Log2FC| Cutoff as 1, p-value cutoff as 0.01, jitter size at 0.04 and log2(TPM + 1) for log scale. Num(t) represents the number of tumor samples, while num (n) represents the number of normal prostate samples](/cms/asset/55f2f10f-f877-4dd4-b78a-261cf7e24073/kccy_a_1962624_f0008_oc.jpg)
DISCUSSION
Since there is a huge amount of high-throughput expression data available in the Gene Expression Omnibus (GEO) database, it provides us with immense opportunity to determine gene functions based on co-expression analysis. CoExpedia is one of the recent co-expression databases, which comprises approximately 8 million co-expressions obtained from hundreds of GEO series [Citation22]. We used CoExpedia and TCGA PRAD dataset to extract all the significant HN1 co-expressed (479) genes and (176), respectively, and applied gene ontology enrichment analysis using the FunRich software package, which is one of the recent open-access functional enrichment and interaction network analysis tool [Citation24]. Enriched cellular component (CC) terms significantly associated with HN1 co-expressed genes apart from obvious (cytoplasm, nucleus, and membrane) ones were condensed chromosome kinetochore, midbody, microtubule, spindle, and centrosome. The experimental validation of HN1 localization at the centrosome was performed by immunofluorescence staining in PC-3 cells. It was shown that HN1 was involved in regulating chromosome segregation as its depletion caused changes in the number of centrosomes and increased micronuclei formation and aneuploidy ( and ). GO molecular function (MF) analysis revealed that HN1 co-expression network was enriched for protein, RNA and ATP binding along with microtubule binding and motor activity and structural component of cytoskeleton. Furthermore, HN1 co-expressed genes were enriched in biological processes of mitotic cell division, anaphase promoting complex (APC/C) processes, sister chromatid separation, and mitotic spindle organization. HN1 is predicted as an intrinsically disordered protein lacking any fixed tertiary structure along with the enrichment of disorder promoting residues in the protein sequence (Supplementary information Figure S1). Intrinsically disordered proteins have been associated with the regulation of cell cycle previously [Citation32].
DNA content analysis data by PI staining and flowcytometry show that HN1 overexpression indeed leads to an increase in polyploid population in normal prostate epithelial cells (RWPE-1) () along with an increase in S phase population. Furthermore, both HN1 depletion and overexpression in PC-3 cells increased the polyploid population as compared to control cells, implying the role of HN1 in carcinogenesis being maintained at expression level (). Important cell cycle-regulated proteins were investigated to determine the impact of HN1 overexpression in RWPE-1, LNCaP, and PC-3 cells. HN1 overexpression causing an increase of Cyclin A in RWPE-1 and PC-3 cells with no significant change in LNCaP cells showed a differential role of HN1 in these cells (Table S2). When HN1 was overexpressed in LNCaP cells, Cdc20, functional cofactor of APC/C at G2-M phases of cell cycle and spindle assembly checkpoint was increased in RWPE-1, whereas decreased in PC-3 cells. These data imply that HN1 is a cell cycle-regulated protein (Table S2). PLK1 being a centrosome maturation factor, on the other hand, was increased in RWPE-1 cells and decreased in both LNCaP and PC-3 cells show that HN1 might function in regulating the centrosome cycle differently in varying cells especially normal and cancer (). HN1 overexpression resulted in increased Cdt1 in RWPE-1 and PC-3 cells and decreased Cdt1 in LNCaP cells, indicating that HN1 is a cell cycle player in these cells as Cdt1 expression determines the replication firing at the S phase of the cell cycle (Table S2). Cyclin B however function in G2-M transition and spindle assembly checkpoint was increased in RWPE-1 cells and decreased in PC-3 cells with no clear change in LNCaP cells by HN1 overexpression (Table S2). This data shows that HN1 functions in both key checkpoints G1-S and G2-M during the cell cycle. Therefore, stabilized HN1 in these cells is required for cell cycle-related events ().
The micronucleus assay is usually performed for the detection of aneugenic events in a cell population [Citation33]. Micronuclei are formed by the nuclear exclusion of chromosomal fragments, whole chromosomes, or chromatids that lag in anaphase due to genotoxic stress, tubulin misattachment, kinetochore failure, or cytokinesis errors [Citation34]. Indeed, micronucleus formation was repeatedly more pronounced in both HN1-depleted and HN1-overexpressing cells ( and ), suggesting that the HN1 expression level is critical for the maintenance of mitotic fidelity by preventing aneuploidy due to chromosome loss. Furthermore, both HN1 depletion and overexpression resulted in highly increased rates of spontaneous polyploidization by whole-genome reduplication. However, the mechanisms of polyploidy generation might be different in these two opposing contexts of HN1 expression. The depletion of HN1 presumably leads to polyploidization via the formation of mono-polar mitoses, whole-genome chromosome nondisjunction, reentry into the S phase, and endoreplication [Citation35], whereas excess amounts of HN1 might affect the progression of the cell cycle and may lead to endo-reduplication in the absence of mitosis (endo-mitosis) [Citation36]. The microtubule motor proteins including kinesins are also linked with centrosome and microtubule structure alterations and are observed to be enriched in the HN1 co-expression network in the TCGA PRAD dataset (Supplementary Information Table S3).
Centrosomes have well-established functions in microtubule nucleation and cellular polarization [Citation37]. In other words, by providing the polarization required for cell division, centrosomes are responsible for the formation of cellular bipolarity. Many studies have reported mitotic abnormalities caused by impaired centrosome function, indicating the critical roles of centrosomes in cell cycle control, the completion of cytokinesis, and cellular stress responses [Citation38,Citation39]. It is now well established that the centrosome is composed of many proteins and contains several protein-binding regions [Citation40]. Although many of the proteins that bind to the centrosome constitutively or during certain phases of the cell cycle have been defined, unidentified factors are still thought to exist [Citation41].Previous studies have shown that the microtubules associated with centrosome structures and with other centrosomal components do not dissociate from the centrosome in response to microtubule-depolarizing agents, including nocodazole and detergents [Citation42]. The present study also shows that HN1 is present at centrosomes at different expression/stabilization levels during different phases of the cell cycle. Cell cycle-related proteins were also found in the co-expression network of HN1 in TCGA PRAD (Supplementary Information Table S2). We used spatial co-localization and IP assays to confirm that HN1 is a component of the centrosome structure, and we concluded that HN1 might function in regulating the processes that lead to formation of mature centrosomes. The interaction network obtained from HN1 co-expression data in the context of prostate cancer also show that the mitosis and cell division related bigger cluster in the center, while a G1 and S phase related cluster on the side as well (Supplementary Information Figure S4). Keeping in view the chromosome and centrosome irregularities that could promote the carcinogenesis, PC-3 cells in response to HN1 overexpression show a tumorigenic phenotype as compared to RWPE-1 and LNCaP cells; therefore, HN1 silencing and its impact on an interaction partner (γ-tubulin) in PC-3 cells is shown in this investigation.
Similar to DNA, centrosomes are copied once every cell cycle, and the proper execution of this duplication process is crucial for the correct polarization of the bipolar spindle assembly during mitosis [Citation43]. If centrosome duplication is impaired, cells with a replicated genomic content may reenter the S phase without prior cell division, undergo whole-genome endo-replication, and ultimately become polyploid [Citation10]. Additionally, if a centrosome is duplicated more than once during a given cell cycle, aneuploidy may occur due to the unequal distribution of chromatids to the daughter cells during mitosis [Citation44]. Both poly- and aneuploidy contribute to the well-established genomic instability of cancer cells, which likely provide selective advantages that trigger aggressive neoplastic cellular proliferation [Citation45]. Agents such as hydroxyurea and aphidicolin, which stop DNA replication but do not affect centrosome replication, are usually used to study factors that affect centrosome duplication [Citation46,Citation47]. This study showed that HN1 depletion resulted in the multiplication of γ-tubulin foci, which might be accounted as supernumerary centrosome formation in aphidicolin-treated breast and prostate cancer cells. Thus, HN1 might have a role in the regulation of centrosome duplication. Many cancer-related studies have shown that aberrant centrosome amplification may disrupt the spindle fiber structure [Citation48–50].
The mechanism for HN1’s role in prostate carcinogenesis could be its involvement in the centrosome cycle or cell cycle regulation. The stabilized expression is required for either of these processes. HN1 being a putative disordered protein and lacking clear protein domains makes it difficult to explore the function of the protein; however, the systems biology approach of co-expression network does implicate HN1 in the aforementioned mechanisms of cellular processes. In a previous study (Varisli et al., 2012), it was observed that HN1 overexpression leads to proteasomal degradation of Androgen Receptor (AR) along with downregulation of AR-mediated transactivation in Androgen-sensitive LNCaP cells. This study explored HN1 role in PC-3 cells modeling aggressive carcinogenesis of prostate cancer. However, further studies are required to investigate HN1’s hierarchal role in signaling pathways. Here, we report that HN1 expression is minimal in normal prostate epithelial cells (RWPE-1) as compared to higher expression in androgen-sensitive (LNCaP) and androgen insensitive and advanced prostate cancer cells (PC-3) (). Over expression of HN1 causing decreased proliferation rate in RWPE-1 and LNCaP cells to indicate that in the earlier process of carcinogenesis, HN1 is not functional (as it is overexpressed in prostate tumor tissues (). Furthermore, HN1 overexpression caused cell cycle arrest in these cells with an accumulation of cells in S phase () implicating its role in S phase events with increased Cdk2 and Cyclin E expression in RWPE-1 and LNCaP cells (). In PC-3 cells, however, HN1 overexpression led to a decrease in pH3(S10) expression as compared to other cells, indicating lesser amounts of mitotic cells even though the proliferation rate is higher as observed in and needs further studies.
Previously, it has been shown that HN1 depletion resulted in the increased phosphorylation of AKT(S473)[Citation19]. The activation of the PI3K/AKT pathway augmented centrosome reduplication and caused chromosomal instability. Silencing AKT with siRNA suppressed this phenotype [Citation51]. Besides, both p-AKT(S473) and p-GSK3β(S9) were found to localize to centrosomes during mitosis. The AKT-mediated inhibition of unphosphorylated, spindle fiber-bound GSK3β (the active form) caused abnormalities in the alignment of microtubules and the formation of mono-polar spindles [Citation52]. These events were observed in this study when HN1 was depleted at pro-metaphase during the nocodazole-mediated arrest. When the stability of β-catenin is prevented by GSK3β-mediated phosphorylations and leading to its proteasomal degradation,the structures composed of centrosomal proteins, including γ-tubulin and centrin, cannot nucleate bipolar microtubules [Citation53]. Intriguingly, decreased β-catenin levels also have been shown to induce the formation of monopolar spindles consistent with centrosomal segregation errors [Citation54]. HN1 depletion leads to the accumulation of cytoplasmic β-catenin by relieving the inhibitory phosphorylation of GSK3β(S9), which is mediated by the AKT kinase and contributes to the formation of immature, nucleation-deficient centrosome structures [Citation19]. In contrast, the β-catenin stabilization resulting from HN1 depletion in unsynchronized cells is thought to cause abnormal microtubule formation and to enable the emergence of scattered multi- and micronucleated cells by changing the polarization of cellular tubulin structures. This phenomenon might be related to different levels of APC/C accumulation via cell cycle phases, also requires further studies. Furthermore, HN1 might be a target for different kinases including Nek2, Plk1 and Plk4 that play key roles in the centrosome duplication, maturation and separation pathways as predicted by in silico methods (Supplementary Information Table S4). Restoration of HN1 expression after depleting it in centrosome duplication assay revealed that the centrosome structures represented by γ-tubulin staining are clustered together (), implicating that HN1 plays a vital role in the survival promoting phenotype of centrosome clustering in advanced cancer cells.
HN1 expression is documented to be up-regulated in LNCaP (Androgen-sensitive) cells upon treatment with synthetic androgen (Varisli et al., 2012). The same study also reported that HN1 silencing leads to the stabilized Androgen receptor (AR) while its overexpression leads to proteasomal degradation of AR, implicating a negative feedback loop relationship between HN1 and AR. Since HN1 and AR have a negative correlation and it was explored in a previous study.
This study focused on Androgen-insensitive PC3 cells to explore HN1 in advanced prostate carcinogenesis as it is overexpressed in tumor cells indicated by TCGA prostate cancer data. We repeated the experiments in LNCaP cells but HN1 was not found clearly to be co-localized with γ-tubulin in androgen-sensitive LNCaP cells, further implicating HN1’s role in centrosome function in aggressive prostate cancer modeled by PC-3 and DU-145 cells. (The data for DU-145 can be seen in supplementary figure S3). Our data suggest that the progression of HN1 increases from normal prostate cells to an increased expression in tumor tissues either occur during the evolution of the cancer process or it presents after tumorigenesis to increase or maintain the tumorigenic profile of the cancer cells. The depletion of HN1 in PC-3 results in dysregulated and spatially disorganized γ-tubulin with numerical aberrations along with increased mono-polar spindles, implicating the role of HN1 in maintaining centrosome integrity, tubulin nucleation, and pathway. Overexpression of HN1 on the other hand in HN1 depleted cells led to clustered centrosomes, which is a mechanism that cancer cells utilize to survive the higher and lethal centrosome and genome instability. Microtubule polymerization studies for future studies can be suggested as recently HN1 was reported to have interaction with stathmin 1 which is a microtubule depolymerization protein and reduced alpha-acetylated tubulins to promote metastasis in thyroid carcinoma, therefore, HN1 could impact the microtubule polymerization as well [Citation55].
In summary, this is the first report of HN1, an evolutionarily conserved protein, which was overexpressed in clinical prostate cancer samples and localized partially to centrosomes in advanced prostate cancer cells. Altered expression either by siRNA depletion or overexpression by plasmid transfection resulted in cell cycle-related changes in prostate cells. Its depletion using siRNA resulted in multiplied γ-tubulin foci in those cells and caused deregulated centrosome functionality including the increased formation of mono-polar spindles. Overexpression of HN1 after silencing leads to centrosome clustering. Higher expression of HN1 in Prostate tumor samples coincide with the carcinogenic phenotype of centrosome clustering phenotype observed in HN1 overexpressed cells, implicating the role of HN1 in mediating the chromosomal instability and its tumorigenic potential. However, further studies are required to determine the mechanistic role(s) of HN1 in centrosome duplication, maturation, and bipolar spindle assembly formation.
Supplemental Material
Download Zip (2.5 MB)Acknowledgments
We thank Prof. Dr. Fahri Saatcioglu (University of Oslo, Institute of Biosciences, Oslo, Norway) for providing the rabbit polyclonal α-HN1 antibody, Dr. Ceyda Acilan Ayhan for critically reviewing the manuscript and for useful comments, and Dr. Erdinc Yuksel and Senay Celik for kindly helping with the chromosome preparations for cytogenetic analysis. This research was supported by TUBITAK grant 113Z083 to KSK.
Disclosure statement
No potential conflict of interest was reported by the author(s).
Supplementary material
Supplemental data for this article can be accessed here.
Additional information
Funding
References
- Bray F, Kiemeney LA Epidemiology of prostate cancer in Europe: patterns, trends and determinants. In: Management of Prostate Cancer: a Multidisciplinary Approach. Second Edition. 2017;1-27 Springer, Cham.
- Rebbeck TR Prostate cancer genetics: variation by race, ethnicity, and geography. Semin Radiat Oncol. 2017;(1). DOI:https://doi.org/10.1016/j.semradonc.2016.08.002.
- Day KC, Hiles GL, Kozminsky M, et al. HER2 and EGFR overexpression support metastatic progression of prostate cancer to bone. Cancer Res. 2017;(1). DOI:https://doi.org/10.1158/0008-5472.CAN-16-1656.
- Visakorpi T, Hyytinen E, Koivisto P, et al. In vivo amplification of the androgen receptor gene and progression of human prostate cancer. Nat Genet. 1995;4(9), 401-406
- Mehta PB, Jenkins BL, McCarthy L, et al. MEK5 overexpression is associated with metastatic prostate cancer, and stimulates proliferation, MMP-9 expression and invasion. Oncogene. 2003;(9). DOI:https://doi.org/10.1038/sj.onc.1206154.
- Gurel B, Iwata T, Koh CM, et al. Nuclear MYC protein overexpression is an early alteration in human prostate carcinogenesis. Mod Pathol. 2008;(9). DOI:https://doi.org/10.1038/modpathol.2008.111.
- Satelli A, Li S Vimentin in cancer and its potential as a molecular target for cancer therapy. Cell Mol Life Sci. 2011;(18). DOI:https://doi.org/10.1007/s00018-011-0735-1.
- Gönczy P Centrosomes and cancer: revisiting a long-standing relationship. Nat Rev Cancer. 2015;(11). DOI:https://doi.org/10.1038/nrc3995.
- Schatten H, Ripple MO The impact of centrosome pathologies on prostate cancer development and progression. In: Adv Exp Med Biol. 2018;67-81.
- Nigg EA, Schnerch D, Ganier O, et al. Impact of centrosome aberrations on chromosome segregation and tissue architecture in cancer. Cold Spring Harb Symp Quant Biol. 2018;(82) 137-144.
- Pihan GA, Purohit A, Wallace J, et al. Centrosome defects can account for cellular and genetic changes that characterize prostate cancer progression. Cancer Res. 2001;(61)5, 2212-2219.
- Tang W, Lai YH, Han XD, et al. Murine Hn1 on chromosome 11 is expressed in hemopoietic and brain tissues. Mammalian Genome. 1997;(9). DOI:https://doi.org/10.1007/s003359900540.
- Risk JM, Evans KE, Jones J, et al. Characterization of a 500 kb region on 17q25 and the exclusion of candidate genes as the familial tylosis oesophageal cancer (TOC) locus. Oncogene. 2002;(41). DOI:https://doi.org/10.1038/sj.onc.1205768.
- Kalikin LM, George RAV, Keller MP, et al. An integrated physical and gene map of human distal chromosome 17q24- proximal 17q25 encompassing multiple disease loci. Genomics. 1999;(1). DOI:https://doi.org/10.1006/geno.1998.5740.
- Zhou G, Wang J, Zhang Y, et al. Cloning, expression and subcellular localization of HN1 and HN1L genes, as well as characterization of their orthologs, defining an evolutionarily conserved gene family. Gene. 2004. DOI:https://doi.org/10.1016/j.gene.2004.02.025.
- Lu KH, Patterson AP, Wang L, et al. Selection of potential markers for epithelial ovarian cancer with gene expression arrays and recursive descent partition analysis. Clin Cancer Res. 2004;(10). DOI:https://doi.org/10.1158/1078-0432.CCR-03-0409.
- Laughlin KM, Luo D, Liu C, et al. Hematopoietic- and neurologic-expressed sequence 1 expression in the murine GL261 and high-grade human gliomas. Pathol Oncol Res. 2009; 15:437–444. 3
- Romanuik TL, Wang G, Morozova O, et al. LNCaP atlas: gene expression associated with in vivo progression to castration-recurrent prostate cancer. BMC Med Genomics. 2010;(1). DOI:https://doi.org/10.1186/1755-8794-3-43.
- Varisli L, Gonen-Korkmaz C, Debelec-Butuner B, et al. Ubiquitously expressed hematological and neurological expressed 1 downregulates Akt-mediated GSK3β signaling, and its knockdown results in deregulated G2/M transition in prostate cells. DNA Cell Biol. 2011; 30(6):419–429.
- Varisli L, Ozturk BE, Akyuz GK, et al. HN1 negatively influences the β-catenin/E-cadherin interaction, and contributes to migration in prostate cells. J Cell Biochem. 2015;(1). DOI:https://doi.org/10.1002/jcb.24956.
- Varisli L, Gonen-Korkmaz C, Syed HM, et al. Androgen regulated HN1 leads proteosomal degradation of androgen receptor (AR) and negatively influences AR mediated transactivation in prostate cells. Mol Cell Endocrinol. 2012;(1). DOI:https://doi.org/10.1016/j.mce.2011.11.027.
- Yang S, Kim CY, Hwang S, et al. COEXPEDIA: exploring biomedical hypotheses via co-expressions associated with medical subject headings (MeSH). Nucleic Acids Res. 2017;(D1). DOI:https://doi.org/10.1093/nar/gkw868.
- Tang Z, Li C, Kang B, et al. GEPIA: a web server for cancer and normal gene expression profiling and interactive analyses. Nucleic Acids Res. 2017;45(W1):W98–102.
- Pathan M, Keerthikumar S, Ang CS, et al. FunRich: an open access standalone functional enrichment and interaction network analysis tool. Proteomics. 2015;(15). DOI:https://doi.org/10.1002/pmic.201400515.
- Cizmecioglu O, Warnke S, Arnold M, et al. Plk2 regulated centriole duplication is dependent on its localization to the centrioles and a functional polo-box domain. Cell Cycle. 2008;(22). DOI:https://doi.org/10.4161/cc.7.22.7071.
- Stopper H, Schmitt E, Gregor C, et al. Increased cell proliferation is associated with genomic instability: elevated micronuclei frequencies in estradiol-treated human ovarian cancer cells. Mutagenesis. 2003;(3). DOI:https://doi.org/10.1093/mutage/18.3.243.
- Cizmecioglu O, Arnold M, Bahtz R, et al. Cep152 acts as a scaffold for recruitment of Plk4 and CPAP to the centrosome. J Cell Biol. 2010;(4). DOI:https://doi.org/10.1083/jcb.201007107.
- Matherly LH, Schuetz JD, Westin E, et al. A method for the synchronization of cultured cells with aphidicolin: application to the large-scale synchronization of L1210 cells and the study of the cell cycle regulation of thymidylate synthase and dihydrofolate reductase. Anal Biochem. 1989;(2). DOI:https://doi.org/10.1016/0003-2697(89)90605-2.
- Hinchcliffe EH, Sluder G “It takes two to tango”: understanding how centrosome duplication is regulated throughout the cell cycle. Genes Dev. 2001;15:1167–1181.
- Khodjakov A, Rieder CL Centrosomes enhance the fidelity of cytokinesis in vertebrates and are required for cell cycle progression. J Cell Biol. 2001;(1). DOI:https://doi.org/10.1083/jcb.153.1.237.
- Rghp V, Tanenbaum ME, Medema RH, et al. Balanced activity of three mitotic motors is required for bipolar spindle assembly and chromosome segregation. Cell Rep. 2014;4(8), 948-956.
- Mk Y, Dm M, Ou L, et al. Cell cycle regulation by the intrinsically disordered proteins p21 and p27. Biochem Soc Trans. 2012;5(40), 981-988.
- Elhajouji A, Lukamowicz M, Cammerer Z, et al. Potential thresholds for genotoxic effects by micronucleus scoring. Mutagenesis. 2011;(1). DOI:https://doi.org/10.1093/mutage/geq089.
- Bolt HM, Stewart JD, Hengstler JG et al. A comprehensive review about micronuclei: mechanisms of formation and practical aspects in genotoxicity testing. Arch Toxicol. 2011;(8). DOI:https://doi.org/10.1007/s00204-011-0738-6.
- Sorensen CS, Lukas C, Kramer ER, et al. Nonperiodic activity of the human anaphase-promoting complex-Cdh1 ubiquitin ligase results in continuous DNA synthesis uncoupled from mitosis. Mol Cell Biol. 2000;(20). DOI:https://doi.org/10.1128/MCB.20.20.7613-7623.2000.
- Giam M, Rancati G Aneuploidy and chromosomal instability in cancer: a jackpot to chaos. Cell Div. 2015;(1). DOI:https://doi.org/10.1186/s13008-015-0009-7.
- Zyss D, Gergely F Centrosome function in cancer: guilty or innocent?. Trends Cell Biol. 2009;(7). DOI:https://doi.org/10.1016/j.tcb.2009.04.001.
- Diviani D, Langeberg LK, Doxsey SJ, et al. Pericentrin anchors protein kinase A at the centrosome through a newly identified RII-binding domain. Curr Biol. 2000;(7). DOI:https://doi.org/10.1016/S0960-9822(00)00422-X.
- Fukasawa K. Aberrant activation of cell cycle regulators, centrosome amplification, and mitotic defects. Hormones and Cancer. 2011;(2). DOI:https://doi.org/10.1007/s12672-010-0060-4.
- Lukinavičius G, Lavogina D, Orpinell M, et al. Selective chemical crosslinking reveals a Cep57-Cep63-Cep152 centrosomal complex. Curr Biol. 2013;(3). DOI:https://doi.org/10.1016/j.cub.2012.12.030.
- Kumar A, Rajendran V, Sethumadhavan R, et al. CEP proteins: the knights of centrosome dynasty. Protoplasma. 2013;(5). DOI:https://doi.org/10.1007/s00709-013-0488-9.
- Bobinnec Y, Khodjakov A, Mir LM, et al. Centriole disassembly in vivo and its effect on centrosome structure and function in vertebrate cells. J Cell Biol. 1998;(6). DOI:https://doi.org/10.1083/jcb.143.6.1575.
- Pellman D Causes and consequences of centrosome abnormalities in cancer. Philosophical transactions of the royal society of London series B. Biol Sci. 2014;1650(369), 20130467.
- Ganem NJ, Godinho SA, Pellman D, et al. A mechanism linking extra centrosomes to chromosomal instability. Nature. 2009;(7252). DOI:https://doi.org/10.1038/nature08136.
- Pihan GA Centrosome dysfunction contributes to chromosome instability, chromoanagenesis, and genome reprograming in cancer. Front Oncol. 2013. DOI:https://doi.org/10.3389/fonc.2013.00277.
- Balczon R, Bao L, Zimmer WE, et al. Dissociation of centrosome replication events from cycles of DNA synthesis and mitotic division in hydroxyurea-arrested Chinese hamster ovary cells. J Cell Biol. 1995;1(130), 105-115.
- Tarapore P, Fukasawa K Loss of p53 and centrosome hyperamplification. Oncogene. 2002;(40). DOI:https://doi.org/10.1038/sj.onc.1205707.
- Ghadimi BM, Ried T, Schr□ck E, et al. Centrosome amplification and instability occurs exclusively in aneuploid, but not in diploid colorectal cancer cell lines, and correlates with numerical chromosomal aberrations. Genes Chromosomes Cancer. 2004;2(27), 183-190.
- Boeneman K, Whitehead CM, Negron VC, et al. Centrosome amplification drives chromosomal instability in breast tumor development. Proceedings of the National Academy of Sciences, 2002.
- Chan JY A clinical overview of centrosome amplification in human cancers. Int J Biol Sci. 2011;(8). DOI:https://doi.org/10.7150/ijbs.7.1122.
- Nam HJ, Chae S, Jang SH, et al. The PI3K-Akt mediates oncogenic met-induced centrosome amplification and chromosome instability. Carcinogenesis. 2010;(9). DOI:https://doi.org/10.1093/carcin/bgq133.
- Wakefield JG A role for glycogen synthase kinase-3 in mitotic spindle dynamics and chromosome alignment. J Cell Sci. 2003;(4). DOI:https://doi.org/10.1242/jcs.00273.
- Bahmanyar S, Guiney EL, Hatch EM, et al. Formation of extra centrosomal structures is dependent on beta-catenin. J Cell Sci. 2010;(18). DOI:https://doi.org/10.1242/jcs.064782.
- Bahmanyar S, Kaplan DD, DeLuca JG, et al. β-catenin is a Nek2 substrate involved in centrosome separation. Genes Dev. 2008;(1). DOI:https://doi.org/10.1101/gad.1596308.
- Pan Z, Fang Q, Li L, et al. HN1 promotes tumor growth and metastasis of anaplastic thyroid carcinoma by interacting with STMN1. Cancer Lett. 2021;501, 31-42.
- Yang S, Liu X, Yin Y, et al. Tastin is required for bipolar spindle assembly and centrosome integrity during mitosis. FASEB J. 2008;6(22), 1960-1972.
- Yang YF, Zhang MF, Tian QH, et al. SPAG5 interacts with CEP55 and exerts oncogenic activities via PI3K/AKT pathway in hepatocellular carcinoma. Mol Cancer. 2018;(1). DOI:https://doi.org/10.1186/s12943-018-0872-3.
- Saito T, Hama S, Izumi H, et al. Centrosome amplification induced by survivin suppression enhances both chromosome instability and radiosensitivity in glioma cells. Br J Cancer. 2008;(2). DOI:https://doi.org/10.1038/sj.bjc.6604160.
- Kishi K, MATM VV, Okamoto K, et al. Functional dynamics of polo-like kinase 1 at the centrosome. Mol Cell Biol. 2009;(11). DOI:https://doi.org/10.1128/MCB.01663-08.
- De Luca M, Lavia P, Guarguaglini G, et al. A functional interplay between Aurora-A, Plk1 and TPX2 at spindle poles: plk1 controls centrosomal localization of Aurora-A and TPX2 spindle association. Cell Cycle. 2006;3(5), 296-303.
- Fu J, Bian M, Jiang Q, et al. Roles of aurora kinases in mitosis and tumorigenesis. Mol Cancer Res. 2007;(1). DOI:https://doi.org/10.1158/1541-7786.MCR-06-0208.
- Nikonova AS, Astsaturov I, Serebriiskii IG, et al. Aurora A kinase (AURKA) in normal and pathological cell division. Cell Mol Life Sci. 2013;(70)4, 661-687.
- Venoux M, Tait X, Hames RS, et al. Poc1A and Poc1B act together in human cells to ensure centriole integrity. J Cell Sci. 2013;1(126), 163-175.
- Wang J, Liu X, Dou Z, et al. Mitotic regulator Mis18β interacts with and specifies the centromeric assembly of molecular chaperone holliday junction recognition protein (HJURP). J Biol Chem. 2014;12(289), 8326-8336.
- Lee M-Y, Moreno CS, Saavedra HI, et al. E2F activators signal and maintain centrosome amplification in breast cancer cells. Mol Cell Biol. 2014;(14). DOI:https://doi.org/10.1128/MCB.01688-13.
- Chou CH, Loh JK, Yang MC, et al. AIBp regulates mitotic entry and mitotic spindle assembly by controlling activation of both Aurora-A and Plk1. Cell Cycle. 2015;(17). DOI:https://doi.org/10.1080/15384101.2015.1066536.
- Qi W, Tang Z, Yu H, et al. Phosphorylation- and polo-box-dependent binding of Plk1 to Bub1 is required for the kinetochore localization of Plk1. Mol Biol Cell. 2006;(8). DOI:https://doi.org/10.1091/mbc.e06-03-0240.
- Zhong X, Liu L, Zhao A, et al. The abnormal spindle-like, microcephaly-associated (ASPM) gene encodes a centrosomal protein. Cell Cycle. 2005;(9). DOI:https://doi.org/10.4161/cc.4.9.2029.
- Mollinari C, Kleman JP, Jiang W, et al. PRC1 is a microtubule binding and bundling protein essential to maintain the mitotic spindle midzone. J Cell Biol. 2002;(7). DOI:https://doi.org/10.1083/jcb.200111052.
- Gangisetty O, Lauffart B, Sondarva GV, et al. The transforming acidic coiled coil proteins interact with nuclear histone acetyltransferases. Oncogene. 2004;(14). DOI:https://doi.org/10.1038/sj.onc.1207424.
- Wang X, Yang Y, Duan Q, et al. sSgo1, a major splice variant of Sgo1, functions in centriole cohesion where it is regulated by Plk1. Dev Cell. 2008;(3). DOI:https://doi.org/10.1016/j.devcel.2007.12.007.
- Ringhoff DN, Cassimeris L Stathmin regulates centrosomal nucleation of microtubules and tubulin dimer/polymer partitioning. Mol Biol Cell. 2009;15(20), 3451-3458.