
ABSTRACT
Objective
Long non-coding RNAs (lncRNAs) and microRNAs (miRNAs) participate in tumor progression, while the role of PROX1-antisense RNA1 (PROX1-AS1) sponging miR-519d-3p in retinoblastoma (RB) remains largely unknown. We aim to explore the effect of the PROX1-AS1/miR-519d-3p/sex determining region Y-box 2 (SOX2) in chemosensitivity of RB cells.
Methods
Expression of PROX1-AS1, miR-519d-3p and SOX2 in RB tissues and cells was determined. The drug-resistant cell lines were established and respectively intervened with PROX1-AS1 or miR-519d-3p expression to explore their roles in drug resistance and malignant behaviors of the drug-resistant cells. The binding relationships between PROX1-AS1 and miR-519d-3p, and between miR-519d-3p and SOX2 were evaluated.
Results
PROX1-AS1 and SOX2 were upregulated while miR-519d-3p was downregulated in RB tissues and cells, especially in drug-resistant cells. The PROX1-AS1 inhibition or miR-519d-3p elevation suppressed the drug resistance, proliferation, migration and invasion, and promoted apoptosis of the drug-resistant RB cells. Moreover, PROX1-AS1 sponged miR-519d-3p and miR-519d-3p targeted SOX2.
Conclusion
PROX1-AS1 knockdown upregulates miR-519d-3p to promote chemosensitivity of RB cells via targeting SOX2.
Introduction
As a pediatric malignancy of the developing retina, retinoblastoma (RB) is a prototypical genetic cancer and inherited retinal disease. RB is usually diagnosed among children aged < 3 years [Citation1] and about 5,000–8,000 new cases are diagnosed all over the world each year [Citation2]. At present, since most children have entered late-stage RB that represented high chance of ocular extraction, the treatment and early diagnosis for RB become quite essential [Citation3]. In order to save the visual function of patients with RB, different therapeutic methods were used for different degrees of RB. Among these strategies, radiotherapy causes facial deformity and retinoblastoma relapse in the patients, and the chemotherapy combined with adjuvant therapy has gradually become the preferred treatment [Citation2,Citation4]. The effectiveness of cisplatin (DDP) during the cancer treatment has been well established, and carboplatin (CPB) is known as the main alternative to DDP [Citation5]. In view of the broad use of the drugs, it is urgent to reduce the drug resistance to achieve better efficacy.
Long non-coding RNA (lncRNA) is a type of RNA longer than 200 nt in length with limited protein-coding capacity [Citation6], and it has been revealed that lncRNAs were involved in the tumorigenesis of RB. For instance, metastasis-associated lung adenocarcinoma transcript 1 inhibition has been identified to suppress the malignant episodes of RB cells [Citation7], and a study has revealed that nuclear paraspeckle assembly transcript 1 promoted the growth of human RB cells [Citation8]. As one of the lncRNAs, PROX1-antisense RNA1 (PROX1-AS1) has been reported to participate in the progression of various cancers, such as ovarian cancer [Citation9] and prostate cancer [Citation10]. Moreover, PROX1 AS1 can promote the proliferation and metastasis of gastric cancer and thyroid cancer via sponging miRNAs [Citation11,Citation12]. Nevertheless, its role in RB remains seldom studied. LncRNAs are known to act as molecular sponges to compete microRNAs (MiRNAs) [Citation13]. MiRNAs are short single-stranded RNAs binding to mRNAs and are able to suppress gene expression by mRNA degradation and translational repression [Citation14]. Some miRNAs such as miR-99a [Citation15] and miR-613 [Citation3] have been elucidated to participate in the development of RB. It has been verified that miR-519d-3p suppresses malignant behaviors and DDP resistance of non-small cell lung cancer (NSCLC) cells [Citation16], and could regulate the development of various tumors [Citation17,Citation18]. However, the role of miR-519d-3p in the drug resistance in RB cells, as well as the spongy relationship between PROX1-AS1 and miR-519d-3p remains largely unknown. Sex determining region Y-box 2 (SOX2) is a transcription factor which has been reported to be involved in the tumorigenesis [Citation19]. As previously reported, SOX2 exhibits an increased expression level in RB tissues and peripheral blood [Citation20].
We aim to investigate the effect of the PROX1-AS1/miR-519d-3p/SOX2 axis on biological functions and drug resistance of RB cells, and we speculated that PROX1-AS1 may sponge miR-519d-3p to affect RB progression via targeting SOX2.
Materials and methods
Ethics statement
Written informed consents were acquired from all patients before this study. The protocol of this study was confirmed by the Ethic Committee of The First Hospital of Jilin University and based on the ethical principles for medical research involving human subjects of the Helsinki Declaration.
Study subjects
Sixty RB samples were harvested from 60 patients (aged 9–110 months with a mean age of 4.5 years) accepted treatment in The First Hospital of Jilin University between 2018 and 2019, and the human normal retina tissues were collected from donors dead from other cancers. Patients didn’t accept radio- or chemotherapy before the surgery. After the resection, the tissues were frozen in liquid nitrogen and the diagnosis of all cases were confirmed by pathologists in The First Hospital of Jilin University.
Cell culture
Human retinal pigment epithelial (RPE) cells (American Type Culture Collection [ATCC], VA, USA) were cultured in Dulbecco’s modified Eagle medium (DMEM)/F-12 medium containing 20% fetal bovine serum (FBS) and 100 U/mL penicillin-streptomycin (P/S) (Gibco, CA, USA). Human RB cell lines SO-Rb50, Y79 and hxo-rb44 (ATCC) were cultured in Roswell Park Memorial 1640 (RPMI1640, Gibco) supplemented with 10% FBS and 100 U/mL P/S (Gibco) [Citation21].
Establishment of drug-resistant RB cell models
Drug-resistant cells were induced by increasing the dose gradually. SO-Rb50 of human retinoblastoma cells in logarithmic growth phase was inoculated into 250 mL culture flask. When the cells confluence reached 85%, the concentration of cells was adjusted to 2 × 10⁶/mL, and the cells were exposed to gradually increased doses of CPB and DDP to generate anti-CBP SO-Rb50 (SO-Rb50/CBP) and anti-DDP SO-Rb50 (SO-Rb50/DDP). SO-Rb50/CBP and SO-Rb50/DDP were added with 1.0 mg/mL CBP and 1.0 mg/mL DDP to maintain drug resistance [Citation22].
Cell transfection and grouping
Cells at passage 3 were trypsinized and seeded at 24-well plates (2 × 10⁶ cells/well). When the cell confluence reached 75%, the medium was discarded and the cells were transfected and grouped as follows: blank group, small interfering RNA (si)-PROX1-AS1-NC group (transfected with PROX1-AS1 unrelated sequence), si-PROX1-AS1 group (transfected with PROX1-AS1 interfering sequence), mimic-negative control (NC) group (transfected with mimic NC), miR-519d-3p mimic group (transfected with miR-519d-3p mimic), si-PROX1-AS1 NC + inhibitor NC group (transfected with PROX1-AS1 unrelated sequence and inhibitor NC), si-PROX1-AS1 + inhibitor NC group (transfected with PROX1-AS1 interfering sequence and inhibitor NC), si-PROX1-AS1 + miR-519d-3p inhibitor (transfected with PROX1-AS1 interfering sequence and miR-519d-3p inhibitor). The oligonucleotides or siRNA were constructed by Sangon Biotechnology Co., Ltd. (Shanghai, China) and the transfection was conducted based on the instruction of Lipofectamine 2000 reagent (Invitrogen Inc., CA, USA) [Citation17].
3-(4,5-dimethyl-2-thiazolyl)-2,5-diphenyl-2-H-tetrazolium bromide (MTT) assay
Cells were seeded and incubated with different concentrations of vincristine, CBP and DDP (Sigma-Aldrich, CA, USA), as well as 5-fluorouracil (5-Fu, Sigma) for 48 h. The cell viability was detected.The drug resistance index (RI) was calculated. RI = IC50 (cell/drug resistance)/IC50 (cell/blank).
Cells were seeded and cultured, and then the optical density (OD) value (492 nm) at 0, 24, 48 and 72 h was determined using MTT assay to evaluate the viability of the cells [Citation17].
Transwell assay
After transfection for 48 h, cells were resuspended with 200 μL serum-free RPMI1640 (Gibco). For migration determination, the Transwell chamber (Costar, Shanghai, China) was placed in a 24-well plate and the cell suspension was loaded into the upper chamber while the lower chamber was contained with 400 μL RPMI 1640 (Gibco) supplemented with 20% FBS (Hyclone, State of Utah, USA). The Transwell system was incubated for 48 h. For invasion determination, the chamber was incubated with Matrigel: RPMI 1640 (1:9) overnight at room temperature, and then precoated with Matrigel (BD Biosciences, Mountain View, CA, USA). Cells that migrated on the lower surface or invading cells were then fixed with 4% paraformaldehyde for 15 min and stained with 0.25% crystal violet at room temperature for 20 min. Finally, the migrating and invasive cells were observed under a microscope and five randomly selected visual fields were captured [Citation16].
Colony formation assay
SO-Rb50/CBP and SO-Rb50/DDP cells were seeded into 6-well plates at 400 cells/well for 14 d, and then the cells were fixed and stained with 0.4% crystal violet dye for 20 min. Five visual fields were randomly selected under the fluorescence microscope to count the number of cell clones formed (> 50 clones were effective clones) [Citation12].
Flow cytometry
Flow cytometry was performed to assess the apoptosis of cells as previously described [Citation23]. Annexin V-FTIC/PI apoptosis detection kit (KeyGen, Nanjing, China) were used for staining and the FACS-Calibur system (BD Biosciences, NJ, USA) was used for analysis.
Reverse transcription quantitative polymerase chain reaction (RT-qPCR)
Total RNA in tissues and cells was extracted using TRIzol kits (Invitrogen) and the complementary DNA (cDNA) was synthesized. The PCR was conducted using cDNA, primers, SYBR Green Mix kits (Thermo Fisher) and 7900 real-time PCR system (Applied Biosystems 7900, Thermo Fisher). The primers () were designed by Genechem Co., Ltd. (Shanghai, China). U6 was set as the endogenous reference of miR-519d-3p and glyceraldehyde phosphate dehydrogenase (GAPDH) was set as the endogenous reference of PROX1-AS1 and SOX2. Data were analyzed using 2−ΔΔCt method.
Table 1. Primer sequence
Western blot analysis
Total protein in tissues and cells was extracted with the protein concentration determination. The proteins were separated by 10% polyacrylamide gel electrophoresis (Boster Biological Technology Co., Ltd., Hubei, China), transferred onto membranes, blocked with 5% bovine serum albumin for 1 h and incubated with primary antibodies SOX2 (1: 1,000, Abcam Inc., MA, USA) and GAPDH (1: 2,000, Jackson Immuno Research, PA, USA) at 4°C for 24–48 h. Then, the proteins were incubated with relative secondary antibody (1: 500, Jackson Immuno Research) for 1 h. The images were obtained using the Odyssey dual color infrared fluorescence scanning imaging system and the gray value of the protein bands was determined by the Quantity One image analysis system [Citation16].
Fluorescence in situ hybridization (FISH) assay
The subcellular localization of PROX1-AS1 was predicted at a bioinformatic website (http://lncatlas.crg.eu/) and its subcellular localization in SO-Rb50 cells was evaluated by FISH assay using the RiboTMlncRNA FISH Probe Mix kits (Guangzhou RiboBio Co., Ltd., Guangdong, China). This assay was performed as the description in a previous study [Citation24] and the cells were observed and photographed under a fluorescent microscope.
Dual luciferase reporter gene assay
Binding sites between PROX1-AS1 and miR-519d-3p, and between miR-519d-3p and SOX2 were predicted at https://cm.jefferson.edu/rna22/Precomputed/. The wild type (WT) plasmids (SOX2-WT and PROX1-AS1-WT) were constructed, based on which the binding site was mutated to establish the mutant type (MUT) plasmids (SOX2-MUT and PROX1-AS1-MUT) using plasmid extraction kits (Promega, WI, USA). The sequenced WT and MUT plasmids were co-transfected with mimic NC and miR-519d-3p mimic into SO-Rb50 cells for 48 h. The luciferase activity was determined [Citation17].
RNA immunoprecipitation (RIP) assay
The assay was performed with Magna RIP immunoprecipitation kit (Bersinbio, Guangzhou, China). Cells were lysed in RIP lysate, and the lysate was respectively combined with 5 μg human anti-AGO2 antibody (Millipore, Billerica, MA, USA) and nonspecific antibody IgG (Millipore), and incubated overnight at 4°C. Then, the cell lysate was added to the magnetic beads and incubated at 4°C for 1 h. The samples were mixed with protease K at 55°C for 1 h, and then RNA was extracted and RT-qPCR was performed to detect the purified RNA expression level [Citation25].
RNA pull-down assay
The biotinylated miR-519d-3p WT and MUT plasmids (50 nM each) were used for this assay, which was performed as previously described [Citation26]. Non-biotinylated miRNA probes were set as the negative blank. RT-qPCR was used for determining PROX1-AS1 expression. In addition, biotin-labeled PROX1-AS1-WEIGHT and PROX1-AS1-MUT were transcribed with the Biotin RNA Labeling Mix (Roche, Indianapolis, USA) and T7 RNA polymerase (Roche). . After 48-hour transfection, cells transfected with biotin-labeled PROX1-AS1 were collected and sonicated. Then, microbeads were added to the cell lysate and incubated for 2 hours. RNA levels in collected materials were further analyzed by RT-qPCR [Citation27].
Statistical analysis
All data analyses were conducted using SPSS 21.0 software (IBM Corp. Armonk, NY, USA). The measurement data were expressed as mean ± standard deviation. The unpaired t-test was performed for comparisons between two groups and one-way analysis of variance (ANOVA) was used for comparisons among multiple groups, followed by Tukey’s post hoc test. P value < 0.05 was indicative of statistically significant difference.
Results
PROX1-AS1 and SOX2 are upregulated whereas miR-519d-3p is downregulated in RB tissues
PROX1-AS1 and SOX2 have been identified to participate in multiple cancer progression via targeting miRNA [Citation10,Citation12] and miR-519d-3p has been clarified to regulate chemosensitivity of cancer cells [Citation16,Citation28]. Thus, we detected PROX1-AS1, SOX2 and miR-519d-3p expression in RB tissues, and we found that PROX1-AS1 and SOX2 were upregulated whereas miR-519d-3p was downregulated in RB tissues (-c).
Figure 1. PROX1-AS1 and SOX2 are upregulated whereas miR-519d-3p is downregulated in RB tissues. A, PROX1-AS1 expression in RB tissues and normal retina tissues; B, miR-519d-3p expression in RB tissues and normal retina tissues; C, SOX2 expression in RB tissues and normal retina tissues; n = 60; the measurement data were expressed as mean ± standard deviation and the unpaired t-test was performed for comparisons between two groups
PROX1-AS1 and SOX2 are upregulated whereas miR-519d-3p is downregulated in RB cells
PROX1-AS1, SOX2 and miR-519d-3p expression in RPE, SO-Rb50, Y79 and HXO-Rb44 cells was detected and it was found that PROX1-AS1 and SOX2 were upregulated whereas miR-519d-3p was downregulated in RB cells. Among the RB cells, SO-Rb50 cells had the highest expression of PROX1-AS1 and SOX2, as well as the lowest expression of miR-519d-3p (-d), thus SO-Rb50 cells were selected.
Figure 2. PROX1-AS1 and SOX2 are upregulated whereas miR-519d-3p is downregulated in RB cells. A, PROX1-AS1 expression in each cell line; B, miR-519d-3p expression in each cell line; C, SOX2 mRNA expression in each cell line; D, SOX2 protein expression in each cell line * P < 0.05 vs. the RPE cells; N = 3; the measurement data were expressed as mean ± standard deviation, one-way ANOVA was used for comparisons among multiple groups and Tukey’s post hoc test was used for pairwise comparisons after one-way ANOVA
PROX1-AS1 knockdown represses drug resistance of RB cells
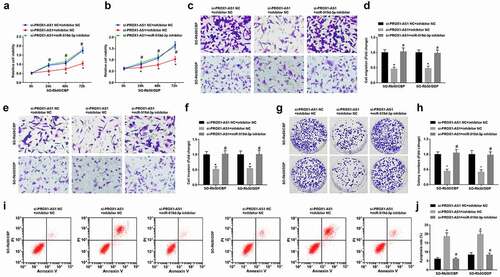
The drug resistance of drug-resistant and parent cells was calculated and the results showed that the drug resistance of the two drug-resistant cell lines was greater than 15, which met the standard of high drug resistance () [Citation29]. The PROX1-AS1 expression in SO-Rb50/CBP and SO-Rb50/DDP cells, as well as in parent cells was detected. The results showed that PROX1-AS1 expression was increased in SO-Rb50/CBP and SO-Rb50/DDP cells (). In order to further explore the potential role of PROX1-AS1 in the chemotherapeutic response of RB cells, we knocked PROX1-AS1 down and detected its expression using RT-qPCR. It was found that si-PROX1-AS1 decreased PROX1-AS1 expression in SO-Rb50/CBP and SO-Rb50/DDP cells (). Next, the PROX1-AS1-deficient drug-resistant cell lines were treated with different drugs and the cell growth curve was graphed. We found that PROX1-AS1 knockdown suppressed the drug-resistance and viability of drug-resistant cells (-g). The results of Transwell assay, colony formation assay and flow cytometry validated that PROX1-AS1 downregulation suppressed migration, invasion and viability, as well as promoted apoptosis of RB cells (-o).
Figure 3. PROX1-AS1 knockdown represses drug resistance of RB cells. A, RI of SO-Rb50/CBP and SO-Rb50/DDP under treatment of different concentrations of drug; B, PROX1-AS1 expression in SO-Rb50, SO-Rb50/CBP and SO-Rb50/DDP cells; C, PROX1-AS1 expression in SO-Rb50, SO-Rb50/CBP and SO-Rb50/DDP cells after transfection of si-PROX1-AS1; D-E, RI of drug-resistant RB cells under treatment of different concentrations of drug after transfection of si-PROX1-AS1; F-G, the survival curve of drug-resistant RB cell lines; H-K, invasion and migration of drug-resistant RB cells detected using Transwell assay; L-M, colony formation ability of drug-resistant RB cells detected using colony formation assay; N, apoptosis of drug-resistant RB cells detected using flow cytometry; # P < 0.05 vs. the SO-Rb50 cells, ^ P < 0.05 vs. the si-PROX1-AS1 NC group, * P < 0.05 vs. the blank group; N = 3; the measurement data were expressed as mean ± standard deviation, unpaired t-test was performed for comparisons between two groups, one-way ANOVA was used for comparisons among multiple groups and Tukey’s post hoc test was used for pairwise comparisons after one-way ANOVA
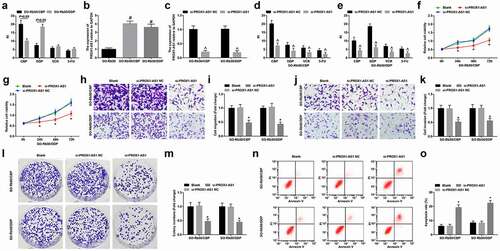
These data indicated that PROX1-AS1 was related to the RB tumorigenesis, and PROX1-AS1 knockdown effectively repressed the malignant phenotypes and drug resistance of RB cells.
MiR-519d-3p represses drug resistance of RB cells
MiR-519d-3p expression was assessed as well and it was observed that miR-519d-3p was downregulated in SO-Rb50/CBP and SO-Rb50/DDP cells (). Then, SO-Rb50/CBP and SO-Rb50/DDP cells were transfected with miR-519d-3p mimic to upregulate miR-519d-3p expression (). Subsequently, the drug-resistant cells transfected with miR-519d-3p mimic were treated with different drugs to determine the drug resistance, and we discovered that miR-519d-3p mimic decreased the drug resistance ( C, D). The cell growth curve showed that the overexpression of miR-519d-3p repressed the growth of drug-resistant cells ( E, F). Moreover, the outcomes of a series assays in our research indicated that miR-519d-3p upregulation suppressed migration, invasion and viability, and promoted apoptosis of RB cells (-n).
Figure 4. MiR-519d-3p represses drug resistance of RB cells. A, miR-519d-3p expression in parent and drug-resistant cells; B, miR-519d-3p expression in drug-resistant cells detected using RT-qPCR; C-D, RI of drug-resistant RB cells under treatment of different concentrations of drug; E-F, viability of drug-resistant cells detected using MTT assay; G-J, invasion and migration of drug-resistant cells detected using Transwell assay; K-L, colony formation ability of drug-resistant cells detected using colony formation assay; M-N, apoptosis of drug-resistant cells detected using flow cytometry; # P < 0.05 vs the SO-Rb50 cells, ^ P < 0.05 vs the mimic NC group, * P < 0.05 vs the blank cells; N = 3; the measurement data were expressed as mean ± standard deviation, unpaired t-test was performed for comparisons between two groups, one-way ANOVA was used for comparisons among multiple groups and Tukey’s post hoc test was used for pairwise comparisons after one-way ANOVA
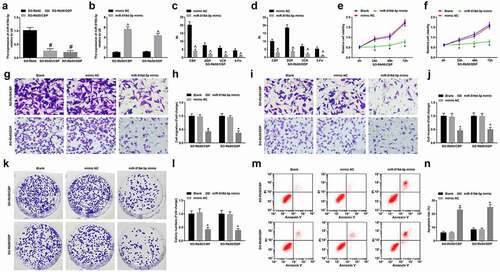
The above data implied that miR-519d-3p upregulation could repress the drug resistance of drug-resistant RB cells.
MiR-519d-3p inhibition reverses the effect of PROX1-AS1 knockdown on RB cells
The cells were transfected with si-PROX1-AS1 and miR-519d-3p inhibitor to explore the correlation among PROX1-AS1, miR-519d-3p and the drug resistance of drug-resistant RB cells. The results of our experiments indicated that miR-519d-3p inhibitor reversed the impact of si-PROX1-AS1 on the colony formation ability, viability, invasion, migration, apoptosis of drug-resistant RB cells (-jn).
Figure 5. MiR-519d-3p inhibition reverses the effect of PROX1-AS1 knockdown on RB cells. A-B, viability of drug-resistant cells detected using MTT assay; C-F, invasion and migration of drug-resistant cells detected using Transwell assay; G-H, colony formation ability of drug-resistant cells detected using colony formation assay; I-J, apoptosis of drug-resistant cells detected using flow cytometry; * P < 0.05 vs. the si-PROX1-AS1 NC + inhibitor NC group, # P < 0.05 vs. the si-PROX1-AS1 + inhibitor NC group; N = 3; the measurement data were expressed as mean ± standard deviation, one-way ANOVA was used for comparisons among multiple groups and Tukey’s post hoc test was used for pairwise comparisons after one-way ANOVA
PROX1-AS1 binds to miR-519d-3p
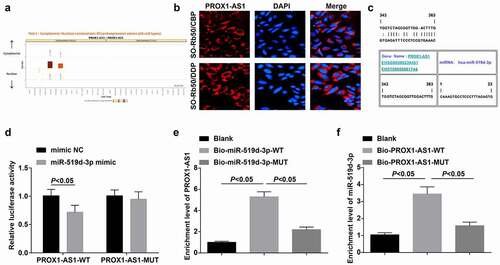
The subcellular localization of PROX1-AS1 was detected and it showed that PROX1-AS1 mainly distributed in the cytoplasm (), and this finding was confirmed by FISH assay, indicating that PROX1-AS1 may function in cytoplasm (). It was predicted that there existed binding regions between sequence of PROX1-AS1 and miR-519d-3p (). It was further confirmed that the co-transfection of miR-519d-3p mimic and PROX1-AS1-WT suppressed the luciferase activity, which that of miR-519d-3p mimic and PROX1-AS1-MUT didn’t affect the luciferase activity, suggesting a binding relationship between PROX1-AS1 and miR-519d-3p (). The binding relationship between miR-519d-3p and PROX1-AS1 was detected by RNA pulldown assay and the results verified that the enrichment level of PROX1-AS1 was increased in cells transfected with Bio-miR-519d-3p-WT, and the concentration of miR-519d-3p was also elevated in cells transfected with Bio-PROX1-AS1-WT (, f). The outcomes above demonstrated that miR-519d-3p and PROX1-AS1 could bind to each other.
Figure 6. PROX1-AS1 binds to miR-519d-3p. A, subcellular localization of PROX1-AS1 predicted at a bioinformatic website; B, subcellular localization of PROX1-AS1 confirmed using FISH assay; C, binding sites between PROX1-AS1 and miR-519d-3p predicted at a bioinformatic website; D, binding relationship between PROX1-AS1 and miR-519d-3p confirmed using dual luciferase reporter gene assay; E/F, binding relationship between PROX1-AS1 and miR-519d-3p confirmed using RNA pull-down assay; N = 3; the measurement data were expressed as mean ± standard deviation, unpaired t-test was performed for comparisons between two groups, one-way ANOVA was used for comparisons among multiple groups and Tukey’s post hoc test was used for pairwise comparisons after one-way ANOVA
SOX2 is high-expressed in drug-resistant RB cells and miR-519d-3p targets SOX2
SOX2 is high-expressed in drug-resistant RB cells [Citation30]. SOX2 expression in cells of each group was determined and it was found that SOX2 was elevated in the drug-resistant cells (-c); si-PROX1-AS1 or miR-519d-3p mimic could downregulate SOX2, and the alteration of SOX2 expression induced by si-PROX1-AS1 was reserved by miR-519d-3p inhibitor (, e).
Figure 7. SOX2 is high-expressed in drug-resistant RB cells and miR-519d-3p targets SOX2. A-C, mRNA and protein expression of SOX2 in parent and drug-resistant cells; D-E, mRNA and protein expression of SOX2 in each drug-resistant cell lines; F, binding sites between miR-519d-3p and SOX2 predicted at a bioinformatic website; G, targeting relationship between miR-519d-3p and SOX2 confirmed using dual luciferase reporter gene assay; H, the binding relationship between miR-519d-3p and SOX2 was validated by RIP assay. * P < 0.05 vs. the SO-Rb50 cells, a P < 0.05 vs. the si-PROX1-AS1 NC group, b P < 0.05 vs the mimic NC group, c P < 0.05 vs. the si-PROX1-AS1 + inhibitor NC group; N = 3; the measurement data were expressed as mean ± standard deviation, unpaired t-test was performed for comparisons between two groups, one-way ANOVA was used for comparisons among multiple groups and Tukey’s post hoc test was used for pairwise comparisons after one-way ANOVA
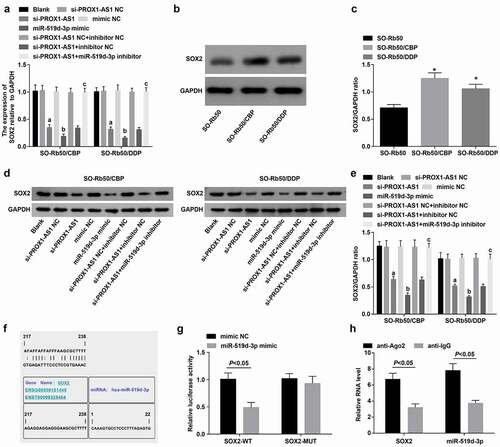
It was predicted at https://cm.jefferson.edu/rna22/Precomputed/ that there existed a targeting relationship between miR-519d-3p and SOX2 (), and it was confirmed that the co-transfection of SOX2-WT and miR-519d-3p mimic into the drug-resistant cells suppressed the luciferase activity, while that of SOX2-MUT and miR-519d-3p-mimic didn’t influence the luciferase activity (), and AGO2 antibody could enrich SOX2 and miR-519d-3p at the same time by RIP assay (), suggesting SOX2 was the direct target gene of miR-519d-3p.
Discussion
As a deadly pediatric eye cancer, RB is the most common intraocular tumor among children. In order to promote the therapeutic outcome of RB patients, it is urgent to further explore the biology and molecular mechanism of RB and identify the biomarkers related to the drug resistance and RB progression [Citation31]. We aim to investigate the role of the PROX1-AS1/miR-519d-3p/SOX2 axis during the progression of RB, and we found that PROX1-AS1 inhibition could upregulate miR-519d-3p to repress the malignant behaviors and drug resistance of RB cells through reducing SOX2.
We determined the expression of PROX1-AS1 in tissues and cells to identify its impact, and the results showed that PROX1-AS1 was enriched in RB tissues and cells, respectively versus the human normal retina tissues and RPE cells, and it was especially upregulated in the drug-resistant RB cell lines. Similarly, Zhao et al. have identified that PROX1-AS1 is highly expressed in ovarian cancer tissues and cell lines [Citation32], and it has been elucidated that the expression level of PROX1-AS1 is markedly higher in prostate cancer tissue samples and cell lines [Citation10]. In order to explore the role of PROX1-AS1 in the RB cell growth as well as the drug resistance, we knocked PROX1-AS1 down in drug-resistant RB cell lines, and the results of our experiments indicated that the inhibition of PROX1-AS1 suppressed the drug resistance, viability, migration, invasion and colony formation ability, and promoted cell cycle transition and apoptosis in the RB cells. Consistent with our findings, a publication has validated that PROX1-AS1 promotes the proliferation and migration of gastric cancer cells [Citation33]. Shen et al. have indicated that PROX1-AS1 facilitates the proliferation, invasion, and migration in papillary thyroid carcinoma [Citation12], and it has also been demonstrated that PROX1-AS1 knockdown inhibits the ovarian cancer cell proliferation and metastasis [Citation32]. Moreover, PROX1-AS1 has been validated to sponge miR-647 in prostate cancer [Citation10] and gastric cancer [Citation11]. However, the spongy relationship between PROX1-AS1 and miR-519d-3p remained to be further explored.
The expression of miR-519d-3p in tissues and cells was assessed as well, and we found that miR-519d-3p was downregulated in RB tissues and cell lines, especially drug-resistant cell lines. Consistently, Jin et al. have reported that miR-519d-3p restricts cell growth, metastasis and DDP resistance, and promotes apoptosis in gastric cancer [Citation28], and it has been unraveled miR-519d-3p suppresses proliferation, migration, invasion and DDP resistance of NSCLC cells [Citation16]. In addition, a publication has suggested that miR-519d-3p inhibites cell proliferation and cell cycle G1/S transition in glioma [Citation34]. We observed through the bioinformatic prediction and dual luciferase reporter gene assay that there existed a targeting relationship between miR-519d-3p and SOX2 in RB. Nevertheless, this targeting relationship remained to be further investigated. Based on our above findings, the expression of SOX2 was assessed, and it was revealed that SOX2 expression was increased in RB tissues and cells. Similar to this finding, a study has implied that the expression of SOX2 mRNA is upregulated in breast cancer tissues and cells [Citation35], and it has been unveiled that SOX2 expression is enhanced in RB tissues and peripheral blood from RB patients [Citation20]. These data were helpful to further the understanding of the PROX1-AS1/miR-519d-3p/SOX2 axis in RB.
In conclusion, we found that the reduction of PROX1-AS1 could upregulate miR-519d-3p to restrain the malignant behaviors and drug resistance of RB cells via silencing SOX2. Thus study may provide novel targets for therapeutic strategies of RB, while more efforts are still needed for further investigations.
Acknowledgments
We would like to acknowledge the reviewers for their helpful comments on this paper.
Disclosure statement
No potential conflict of interest was reported by the author(s).
References
- Gudiseva Harini V., Berry Jesse L., Polski Ashley., Tummina Santa J., O'Brien Joan M. Next-Generation Technologies and Strategies for the Management of Retinoblastoma. Genes (Basel).
- Pritchard EM, Dyer MA, Guy RK. Progress in Small Molecule Therapeutics for the Treatment of Retinoblastoma. Mini Rev Med Chem. 2016;16(6):430–454.
- Yang, G., Fu, Y., Lu, X., Wang, M., Dong, H., & Li, Q. LncRNA HOTAIR/miR-613/c-met axis modulated epithelial-mesenchymal transition of retinoblastoma cells. J Cell Mol Med. 2018;22(10):5083–5096.
- Kaliki S, Shields CL. Retinoblastoma: achieving new standards with methods of chemotherapy. Indian J Ophthalmol. 2015;63(2):103–109.
- Couillard-Montminy V, Gagnon PY, Fortin S, Côté J. Effectiveness of adjuvant carboplatin-based chemotherapy compared to cisplatin in non-small cell lung cancer. J Oncol Pharm Pract. 2019;25(1):44–51.
- Yu H, Peng S, Chen X, Han S, Luo J. Long non-coding RNA NEAT1 serves as a novel biomarker for treatment response and survival profiles via microRNA-125a in multiple myeloma. J Clin Lab Anal. 2020;34(9):e23399.
- Liu S, Yan G, Zhang J, Yu L. Knockdown of Long Noncoding RNA (lncRNA) Metastasis-Associated Lung Adenocarcinoma Transcript 1 (MALAT1) Inhibits Proliferation, Migration, and Invasion and Promotes Apoptosis by Targeting miR-124 in Retinoblastoma. Oncol Res. 2018;26(4):581–591.
- Zhong W, Yang J, Li M, Li L, Li A. Long noncoding RNA NEAT1 promotes the growth of human retinoblastoma cells via regulation of miR-204/CXCR4 axis. J Cell Physiol. 2019;234(7):11567–11576.
- Zhao L, Li JF, Tong XJ. Long noncoding RNA PROX1-AS1 promoted ovarian cancer cell proliferation and metastasis by suppressing KLF6. Eur Rev Med Pharmacol Sci. 2020;24(13):7220.
- Qian C, Liao CH, Tan BF, Chen YF, Dang BW, Chen JL, Liu CB. LncRNA PROX1-AS1 promotes proliferation, invasion, and migration in prostate cancer via targeting miR-647. Eur Rev Med Pharmacol Sci. 2020;24(6):2938–2944.
- Song X, Bi Y, Guo W. Long noncoding RNA PROX1-AS1 promotes tumor progression and aggressiveness by sponging miR-647 in gastric cancer. Minerva Med. 2021;112(3):421-423.
- Shen Y, Xia E, Bhandari A, Wang X, Guo G. LncRNA PROX1-AS1 promotes proliferation, invasion, and migration in papillary thyroid carcinoma. Biosci Rep. 2018;38(5) BSR20180862.
- Sun J, Zhang P, Yin T, Zhang F, Wang W. Upregulation of LncRNA PVT1 Facilitates Pancreatic Ductal Adenocarcinoma Cell Progression and Glycolysis by Regulating MiR-519d-3p and HIF-1A. J Cancer. 2020;11(9):2572–2579.
- Zhao L, Huang J, Zhu Y, Han S, Qing K, Wang J, Feng Y. miR-33-5p knockdown attenuates abdominal aortic aneurysm progression via promoting target adenosine triphosphate-binding cassette transporter A1 expression and activating the PI3K/Akt signaling pathway. Perfusion. 2020;35(1):57–65.
- Wang X, Zhang X, Han Y, Wang Q, Ren Y, Wang B, Hu J. Silence of lncRNA ANRIL represses cell growth and promotes apoptosis in retinoblastoma cells through regulating miR-99a and c-Myc. Artif Cells Nanomed Biotechnol. 2019;47(1):2265–2273.
- Ye Y, Zhao L, Li Q, Xi C, Li Y, Li Z. circ_0007385 served as competing endogenous RNA for miR-519d-3p to suppress malignant behaviors and cisplatin resistance of non-small cell lung cancer cells. Thorac Cancer. 2020;11(8):2196–2208.
- Li YY, Shao JP, Zhang SP, Xing GQ, Liu HJ. miR-519d-3p Inhibits Cell Proliferation and Invasion of Gastric Cancer by Downregulating B-Cell Lymphoma 6. Cytogenet Genome Res. 2018;154(1):12–19.
- Li D, Song H, Wu T, Xie D, Hu J, Zhao J, Shen Q, Fang L. MiR-519d-3p suppresses breast cancer cell growth and motility via targeting LIM domain kinase 1. Mol Cell Biochem. 2018;444(1–2):169–178.
- Dai WL, Yuan SX, Cao JP. The deubiquitinase USP34 stabilizes SOX2 and induces cell survival and drug resistance in laryngeal squamous cell carcinoma.
- Tong B, Zeng J, Wu Y, Xiong W. Enhanced SOX2 expression in retinoblastoma tissues and peripheral blood is associated with the clinicopathological characteristics of the disease. Oncol Lett. 2015;9(3):1244–1248.
- Ferrario A, Luna M, Rucker N, Wong S, Lederman A, Kim J, Gomer C. Targeting Survivin Enhances Chemosensitivity in Retinoblastoma Cells and Orthotopic Tumors. PLoS One. 2016;11(4):e0153011.
- Yuan XW, Yan TQ, Tong H. Effect of miR-515-5p on Proliferation and Drug Sensitivity of Retinoblastoma Cells. Cancer Manag Res. 2020;12:12087–12098.
- Ye X, Lv H. MicroRNA-519d-3p inhibits cell proliferation and migration by targeting TROAP in colorectal cancer. Biomed Pharmacother. 2018;105:879–886.
- Huang X, Li Z, Zhang Q, Wang W, Li B, Wang L, Xu Z, Zeng A, Zhang X, Zhang X, He Z, Li Q, Sun G, Wang S, Li Q, Wang L, Zhang L, Xu H, Xu Z. Circular RNA AKT3 upregulates PIK3R1 to enhance cisplatin resistance in gastric cancer via miR-198 suppression. Mol Cancer. 2019;18(1):71.
- Xu L, Feng X, Hao X, Wang P, Zhang Y, Zheng X, Li L, Ren S, Zhang M, Xu M. CircSETD3 (Hsa_circ_0000567) acts as a sponge for microRNA-421 inhibiting hepatocellular carcinoma growth. J Exp Clin Cancer Res. 2019;38(1):98.
- Sun Q, Li Q, Xie F. LncRNA-MALAT1 regulates proliferation and apoptosis of ovarian cancer cells by targeting miR-503-5p. Onco Targets Ther. 2019;12:6297–6307.
- Wang Y, Liu N, Li MY, Du MF. Long non-coding RNA ZEB2-AS1 regulates osteosarcoma progression by acting as a molecular sponge of miR-107 to modulate SALL4 expression. Am J Transl Res. 2021;13(3):1140–1154.
- Jin W, Zhang H, Li M, Lin S. Long Noncoding RNA Regulator of Reprogramming Regulates Cell Growth, Metastasis, and Cisplatin Resistance in Gastric Cancer via miR-519d-3p/HMGA2 Axis. Cancer Biother Radiopharm
- Gu L, Zhang G, Zhang Y. A novel method to establish glucocorticoid resistant acute lymphoblastic leukemia cell lines. J Exp Clin Cancer Res. 2019;38(1):269.
- Balaji S, Santhi R, Kim U, Muthukkaruppan V, Priya CG, Vanniarajan A. Cancer Stem Cells with Overexpression of Neuronal Markers Enhance Chemoresistance and Invasion in Retinoblastoma. Curr Cancer Drug Targets. 2020;20(9):710–719.
- Wu X, Zeng Y, Wu S, Zhong J, Wang Y, Xu J. MiR-204, down-regulated in retinoblastoma, regulates proliferation and invasion of human retinoblastoma cells by targeting CyclinD2 and MMP-9. FEBS Lett. 2015;589(5):645–650.
- Zhao L, Li JF, Tong XJ. Long noncoding RNA PROX1-AS1 promoted ovarian cancer cell proliferation and metastasis by suppressing KLF6. Eur Rev Med Pharmacol Sci. 2020;24(12):6561–6568.
- Jiang W, Meng K, Yang T. Long non-coding RNA PROX1-AS1 promotes the proliferation and migration in gastric cancer by epigenetically activating FGFR1.
- Ma L, Li J. MicroRNA-519d-3p inhibits cell proliferation and cell cycle G1/S transition in glioma by targeting CCND1. Biosci Biotechnol Biochem. 2020;84(2):297–304.
- Meng Y, Xu Q, Chen L, Wang L, Hu X. The function of SOX2 in breast cancer and relevant signaling pathway. Pathol Res Pract. 2020;216(8):153023.