
ABSTRACT
Magnesium transporter subtype 1 (MAGT1) is known to participate in animal development and cell differentiation. Thus far, MAGT1 studies have mainly focused on its role in cardiomyocyte regulation and differentiation; only a few studies have demonstrated its role in cell proliferation. To investigate the underlying mechanism of MAGT1 in cell proliferation, HeLa and SiHa cells were transiently knocked down with different siRNAs. We showed that cell proliferation was substantially restricted by S-phase arrest and apoptosis in the MAGT1-knocked down cells, which was further confirmed by the increased expression of p21, cyclin-A1, and cyclin-B1, as well as the decreased expression of MYC, cyclin-D1, cyclin-E1, and CDK2. MAGT1 knockdown also resulted in significant changes in the transcriptional expression of 1,598 genes that were analyzed by RNA sequencing. Bioinformatics analysis showed that MAGT1 was related to the MAPK signaling pathway. Western blot analysis confirmed that the phosphorylation of extracellular signal-related protein kinase 1/2 (ERK1/2) and p38 was remarkably reduced in MAGT1 down-regulated groups. Additionally, MAGT1 was required for the function of viral proteins E6/E7 during cell proliferation and G1/S cell-cycle progression. Therefore, MAGT1 plays a crucial role in the proliferation of HPV-positive cervical cancer cells, S-phase progression, and the ERK/p38 MAPK signaling pathway. These results indicate the potential of MAGT1 as a novel target for anticancer research.
Abbreviations: MAGT1: Magnesium transporter subtype 1; MAPK: Mitogen-activated protein kinase; XMEN: X-linked immunodeficiency with Magnesium defect, Epstein-Barr virus infection and Neoplasia; BMMSCs: Bone Marrow Mesenchymal Stem Cells; Dpp: Decapentaplegic; CDKIs: CDK inhibitors; GPCR: G-protein coupled receptor; GO: Gene Ontology; KEGG: Kyoto Encyclopedia of Genes and Genomes; RTK: Receptor Tyrosine Kinase; PTK: Protein Tyrosine Kinase; FGFR: Fibroblast Growth Factor Receptor; BMP: Bone Morphogenetic Protein; HPV18 E6/E7: Human Papillomavirus 18 Early protein 6/ early protein 7; FACS: Fluorescence Activated Cell Sorting; PI: Propidium Iodide
KEYWORDS:
Introduction
Magnesium transporter subtype 1 (MAGT1) has been identified in human epithelial cells as an evolutionarily conserved magnesium transporter [Citation1,Citation2]. MAGT1 mutations are associated with several human diseases, including X-linked immunodeficiency with magnesium defects, Epstein-Barr virus infection and neoplasia (XMEN) [Citation3,Citation4], glycosylation disorder [Citation5], and other genetic syndromes [Citation6,Citation7]. Several studies have reported the vital role of MAGT1 in immune responses [Citation4], glycosylation [Citation8], and cell differentiation [Citation9], however the function of MAGT1 in cell proliferation is unclear.
MAGT1 is necessary for the growth and osteogenic differentiation of mesenchymal stem cells (MSCs) [Citation9,Citation10]. Our previous work also found a close relationship between Drosophila MAGT1 and fly development by tuning the Wingless (Wnt) and Decapentaplegic (Dpp) signaling pathways [Citation11], suggesting that MAGT1 may have a role in cell proliferation or differentiation by signaling pathway regulation. MAGT1 was also reported to regulate the odontogenic differentiation of bone marrow MSCs via the ERK signaling pathway [Citation12]. Furthermore, MAGT1 was highly expressed in several cancers, including colorectal cancer and hepatocellular carcinoma [Citation13,Citation14]. However, the molecular mechanism is not fully understood. Thus, it is probable that MAGT1 may also be a key participant in cancer cell proliferation.
Normal cell cycle progression and cell division are ensured by a series of complicated regulatory mechanisms. It is generally acknowledged that cyclin-D forms a complex with CDK4/6 and cyclin-E with CDK2 to regulate the G1/S transition [Citation15,Citation16]. Cyclin-A accumulates in the S-phase and forms a complex with CDK2 to regulate the S/G2 transition [Citation17,Citation18]. The CIP/KIP family members of cyclin-dependent kinase inhibitors (CDKIs) are also involved in cell-cycle regulation. For instance, many studies have shown that p21 can induce cell-cycle arrest in both of the G1/S and S/G2 transitions by inhibiting CDK4/6/cyclin-D and CDK2/cyclin-E [Citation19–21]. Considering that p53 and MYC are the upstream regulatory factors of p21 [Citation22–25], it is reasonable to believe that the regulation of p53 and MYC might also influence cell cycle progression in different cells.
For MYC activity, mitogen-activated protein kinase (MAPK) is a common upstream signaling pathway that is associated with several diseases [Citation26–30]. The MAPK signaling pathway is mainly regulated by the mutual antagonism between MAP kinase phosphatases (MKPs) and MAP kinases, including ERK1/2, p38, and JNK [Citation31–34]. Therefore, the level of MKPs and the activity of MAP kinases could be indicators of the MAPK signaling pathway, from which cell-cycle progression could be further analyzed.
In this study, we transiently knocked down MAGT1 in HeLa cells and observed a substantial reduction in the cell number. We further found that the decreased cell number was accompanied with the induced S-phase arrest and increased apoptosis. The expression of the cyclins are differentially regulated. We observed the up-regulation of p21 and down-regulation of the upstream regulator MYC in MAGT1-knocked down cells. Besides, we also observed the decrease of the ERK1/2 and p38 MAPK signaling pathways through RNA sequencing and bioinformatics analyses, confirmed by western blot analysis. Above all, these results indicate that MAGT1 was indispensable for cervical cancer cell proliferation by regulating the expression of p21 and MYC, as well as the ERK/p38 MAPK signaling pathway.
Materials and methods
Cell culture and reagents
Cervical cancer cell lines, HPV-positive HeLa (HPV18) and SiHa (HPV16) cells were obtained from American Type Culture Collection (ATCC), and were cultured in DMEM medium (Thermo Fisher Scientific, USA) supplemented with 10% fetal bovine serum (Invitrogen, USA), streptomycin (100 μg/mL; Sigma‑Aldrich, USA) and penicillin (100 U/mL; Sigma‑Aldrich, USA). Cells were incubated at 37°C in a humidified incubator containing 5% CO2.
siRNA transfection
HeLa and SiHa cells were transfected with siRNAs while plated onto 6-well plates using Lipofectamine 2000 (Invitrogen, USA) according to the manufacturer’s instructions. RNA or protein was harvested for further analyses.
Target sequences of siRNAs were 5′-GCUAUGACAUCUGGUCAAATT-3′ (SiMAGT1-1), 5′-CCGACAGAACUGAUGUCAATT-3′ (SiMAGT1-2) and 5′-GGACUUGUGUAUCUUCGAATT-3′ (SiMAGT1-3) (Qiagen, Germany) for MAGT1. 5′-CAUUUACCAGCCCGACGAGTT-3′ (SiE6/E7) (Qiagen, Germany) for the viral proteins E6/E7. Negative control siRNAs did not target any human genes (SiCtrl, the Negative Control siRNA, Qiagen, Germany).
Quantitative Real-time PCR (qPCR)
HeLa and SiHa cells were grown in 6-well plates and were treated with siRNAs for 48 h. Total RNA was extracted according to the manufacturer’s instructions. Briefly, cells were lysed in 500 μL TRIzol® (Invitrogen, USA) and 100 μL of chloroform was added to each lysate. The lysate was centrifuged at 12,000 rpm for 15 min at 4°C. Upper aqueous phase was collected in a fresh tube and RNA was precipitated with equal volume of isopropanol. Tubes were centrifuged again at 10,000 rpm for 10 min at 4°C. The pellet was washed twice with 75% ethanol at 7500 rpm for 5 min at 4°C. Total RNA was transcribed into cDNA using a Prime Script™ RT Reagent Kit (Takara, Japan). Quantitative Real-Time PCR was performed with 1 μL cDNA template using SYBR Green master mix (Applied Biosystems, USA) on Applied BioSystems RT PCR machine. QPCR analysis was carried out using a SYBR Green Master Mix (Applied Biosystems, USA) on a Bio-Rad CFX96 real-time PCR detection system (Bio-Rad, USA) according to the manufacturer’s instructions. The thermocycling conditions were as follows: Stage 1, 95°C for 30 s; stage 2, 95°C for 5 s and 60°C for 30 sec for 40 cycles. The 2−ΔΔCt method was used to determine the relative expression of the genes normalized to GAPDH, and the experiments were repeated three times independently.
The following primers were used for qPCR analysis: MAGT1, forward 5′-CTCAGCCTCTGCCCAAAGAA-3′ and reverse 5′-CACAAGGCGACGGAACTTGT −3′; CCNA1, forward 5′-GAGGTCCCGATGCTTGTCAG-3′ and reverse 5′-GTT AGCAGCCCTAGCACTGTC-3′; CCNB1, forward 5′-AATAAGGCGAAGATCAAC ATGGC-3′ and reverse 5′- TTTGTTACCAATGTCCCCAAGAG-3′; CCND1, forward 5′-GCTCCTGTGCTGCGAAGT-3′ and reverse 5′- TGTTCCTCGCAGACCTCCAG-3′; CCNE1, forward 5′-GCCAGCCTTGGGACAATAATG-3′ and reverse 5′-CTTGCACGTTGAGTTTGGGT-3′; CDK2, forward 5′-AGGCATGAGGAATCTGG GAG-3′ and reverse 5′-GAGGTGGACGTCAGAGGAAA-3′; CDK4, forward 5′-TCTCTGAGGCTATGGAGGGT-3′ and reverse 5′-GGGAAAGGGACAAGAGGG AA-3′; CDKN1A, forward 5′-CGATGGAACTTCGACTTTGTCA-3′ and reverse 5′-GCACAAGGGTACAAGACAGTG-3′; CDKN2A, forward 5′-GGGTTTTCGTGGT TCACATCC-3′ and reverse 5′-CTAGACGCTGGCTCCTCAGTA-3′; MYC, forward 5′-TCAAGAGGCGAACACACAAC-3′ and reverse 5′-GGCCTTTTCATTGTT TTCCA-3′; TP53, forward 5′-GAGGTTGGCTCTGACTGTACC-3′ and reverse 5′-TCCGTCCCAGTAGATTACCAC-3′ and GAPDH, forward 5′-GCACCGT CAAGGCTGAGAAC-3′ and reverse 5′-ATGGTGGTGAAGACGCCAGT-3′.
RNA sequencing (RNA-seq) and data analysis
A total amount of 1 μg RNA per sample was used as input material for the RNA sample preparations. Sequencing libraries were generated using NEBNext® UltraTM RNA Library Prep Kit for Illumina® (NEB, USA) following manufacturer’s recommendations and index codes were added to attribute sequences to each sample.
The clustering of the index-coded samples was performed on a cBot Cluster Generation System using TruSeq PE Cluster Kit v3-cBot-HS (Illumina) according to the manufacturer’s instructions. After cluster generation, the library preparations were sequenced on an Illumina Novaseq platform and 150 bp paired-end reads were generated. RNA-Seq data were deposited in Gene Expression Omnibus (GEO; accession # GSE166084). Feature Counts v1.5.0-p3 was used to count the reads numbers mapped to each gene. FPKM of each gene was calculated based on the length of the gene and reads count mapped to this gene. Differential expression analysis of two conditions was performed using the edgeR R package (3.18.1). The P values were adjusted using the Benjamini & Hochberg method. Corrected P-value of 0.05 and absolute fold change of two were set as the threshold for significantly differential expression.
Gene Ontology (GO) and Kyoto Encyclopedia of Genes and Genomes (KEGG) pathway analyses of differentially expressed genes were implemented by the cluster Profiler R package to detect molecular functions, biological processes, and pathways associated with the differential expression signature. GO terms with corrected P value less than 0.05 were considered significantly enriched by differential expressed genes.
Cell cycle analysis
For cell cycle analysis with propidium iodide (PI) staining, cells (1 × 10⁵) were seeded in 6-well plates and treated with siRNAs for 48 h or 72 h. Then, cells were harvested and washed twice with ice cold PBS and fixed in 70% cold ethanol at 4°C overnight. The fixed cells were treated with 2 μg/mL RNase (Sigma, USA) and 50 μg/mL PI at 1 × 10⁶ cells/mL (Sigma, USA). The cells were then analyzed by flow cytometry on a FACS Calibur Flow Cytometer (BD Biosciences, USA). The percentage of cells at each phase of the cell cycle was calculated using the Mod-Fit LT software.
DNA synthesis was assessed by incorporation of 10 μM 5-ethynyl-2ʹ-deoxyuridine (EdU, Sigma, USA) for 2 h in pulse-labeled experiments, cells were trypsinized and fixed in cold 70% ethanol at 4°C overnight. Then cells were washed and incubated in 0.1 mL 0.5% Triton X-100 for 20 min at room temperature, and incubated with YF® 488 Azide (US Everbright, China) for 30 min at room temperature. Before being analyzed on a BD Fortessa flow cytometer, cells were stained with 1 μg/mL of 7-Aminoactinomycin D (7-AAD, BD Biosciences, USA) at room temperature for 15 min. The data were analyzed by the FlowJo VX software (FlowJo, LLC).
Cell apoptosis analysis
For cell apoptosis analysis, cells were washed twice with ice cold PBS and stained with FITC-conjugated Annexin V (BD Biosciences, USA) on ice for 15 min, and then stained with 1 μg/mL of PI at room temperature for 15 min. The cells were analyzed on a BD Fortessa flow cytometer. The data were analyzed by the FlowJo VX software (FlowJo, LLC).
Western blot analysis
Cells seeded at 1.5 × 10⁵ per well in 6-well plates were treated with siRNAs for 48 h. Then cells were washed twice with ice cold PBS and lysed with RIPA lysis buffer containing protease inhibitors (Sigma‑Aldrich, USA) for 30 min on ice. Lysates were centrifuged at 12,000 g for 15 min at 4°C. Whole-cell extracts were analyzed by Western blot analysis. The protein concentration was determined using a BCA protein assay kit (Pierce, USA). Total protein (10 μg) was subjected to 10% SDS-PAGE and transferred onto polyvinylidene difluoride (PVDF) membrane (Millipore, USA). Membranes were blocked with 5% skimmed milk dissolved in TBST for 1 h, incubated with primary antibodies at 4°C overnight and with horseradish peroxidase‑conjugated secondary antibodies at room temperature for 1 h. The primary antibodies anti-MAGT1 (PA5-44,929, 1:500, rabbit polyclonal antibody) and anti-cyclin-A1 (PA5-109,491, 1:1,000, rabbit polyclonal antibody) were obtained from Thermo Fisher Scientific. Anti-ERK1/2 (1:2000), anti-p-ERK1/2 (1:1,000), anti-p-p38 (1:500), anti-p-JNK (1:2,000), anti-cyclin-B1 (1:1,500), anti-cyclin-D1 (1:2,000), anti-cyclin-E1 (1:1,000), anti-CDK2 (1:2,000) and anti-CDK4 (1:2,000) were all rabbit polyclonal antibodies obtained from the Cell Signaling Technology. Anti-α Tubulin (cat. no. ab7291; 1:5,000) was obtained from Abcam. The secondary antibodies goat anti‑mouse (cat. no. ab205719; 1:10,000) and goat anti‑rabbit (cat. no. ab6721; 1:10,000) obtained from Abcam were labeled with horseradish peroxidase (GE healthcare, USA) and detected with the ECL Western Blotting Substrate (Thermo Fisher Scientific, USA). The western blots were repeated at least three times.
Statistical analysis
For statistical analysis, all experiments were performed independently and repeated at least three times. Data were analyzed using GraphPad Prism 6.0 (GraphPad Software, USA). Unpaired Student’s t‑test and paired t‑test were carried out to evaluate statistical differences between two groups. Statistically significant differences between more than two groups were determined using one-way analysis of variance (ANOVA) followed by Bonferroni’s multiple comparison tests. Data was presented as the means ± standard deviation (SD). Significance was generally defined in each figure legend.
Results
MAGT1 knockdown induces cell proliferation inhibition through inducing S-phase arrest and apoptosis in HeLa cells
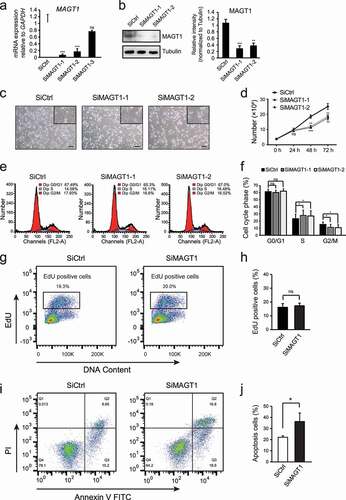
We transfected three different MAGT1 siRNAs into HeLa cells to transiently knockdown MAGT1 and found that only two of these demonstrated observable differences compared to the negative-control treatment ()). Thus, we chose the two efficient MAGT1 siRNAs (SiMAGT1-1 and SiMAGT1-2) for further analyses. Western blot analysis showed that the protein levels of MAGT1 were also significantly decreased in the two efficient MAGT1 siRNAs treated cells ()). MAGT1 regulates the proliferation of several different cells. To test whether MAGT1 is also required for HeLa cell growth, we treated the cells with different siRNAs, harvested and quantified the number of cells using a cell counter. We found that MAGT1 knockdown significantly reduced the cell number after 48 and 72 h (,d)). To further explore the mechanism of MAGT1 on cell growth, we stained the RNAi-treated cells with propidium iodide (PI) and performed FACS analysis. The results showed that the number of cells was significantly accumulated in the S phase and reduced in the G2/M phase after treatment with SiMAGT1 for 72 h compared with the negative control (,f)). To further explore whether the increased number of cells in the S phase was induced by S-phase arrest or the increase in proliferation, we performed EdU-pulse labeling experiments. No significant changes of the EdU positive cells were observed in different treated groups (,h)), indicating that the S-phase accumulation was not due to the increased proliferation of the cells. Hence, MAGT1 knockdown induced a significant S-phase arrest in HeLa cells and induced significant apoptosis (,j)), resulting in a decreased number of cells. These results demonstrated that MAGT1 is required for HeLa cell growth by regulating the S-phase progression and apoptosis of the cells.
Figure 1. Knock down of MAGT1 inhibits proliferation and induces S-phase arrest and apoptosis in HeLa cells
MAGT1 downregulation is associated with an increase in expression of p21 and S-phase genes and a decrease in G1-phase genes
To investigate the molecular mechanism of MAGT1 in cell cycle regulation, we examined the expression of the cell-cycle regulation genes, particularly cyclin-associated genes. MAGT1 was significantly decreased in the SiMAGT1-treated HPV positive HeLa and SiHa cells ()). The levels of cyclin-A1, cyclin-B1, cyclin-D1, and cyclin-E1, as well as the cyclin-dependent kinases CDK2 and CDK4, were quantified using qPCR and western blot analyses. The results showed that both the S-phase-associated factors, cyclin-A1 and cyclin-B1, were significantly increased in the HeLa cells (, d)). Moreover, the expression of cyclin-B1 was also significantly increased in the SiHa cells (,d)). Interestingly, both the mRNA and protein levels of the G1-phase-associated factor, cyclin-D1, were significantly decreased in the MAGT1-knocked down cells compared with the negative control (,d)). The levels of cyclin-E1 and CDK2 were significantly decreased in the HeLa cells (,d)). Additionally, although shown a decreasing trend, no significant decrease of CDK4 in both MAGT1 knockdown cells was detected (,d)). These results indicated that MAGT1 is involved in cyclin-related gene regulation.
Figure 2. MAGT1 regulates several cell cycle related gene expressions
The upstream cell cycle regulators, such as p21 and p16, are involved in cell cycle regulation [Citation19,Citation24]; thus, we examined the transcriptional levels of these regulator genes after different RNAi treatments, followed by qPCR. Surprisingly, only CDKN1A, the p21 gene, was dramatically increased in both HeLa and SiHa cells after MAGT1 RNAi treatment. As shown in ), the expression of CDKN1A in cells transfected with MAGT1 siRNA was approximately 2.5-fold more than that of the negative control in HeLa cells. The upstream regulatory factors p53 and MYC regulate the expression of p21 [Citation35]. Thus, we also tested the transcription levels of p53 and MYC in cells treated with different siRNAs. The results showed that the expression of MYC was significantly reduced in the MAGT1 RNAi group of the SiHa cells, while the expression of p53 was not affected ()). Above all, these results indicated that MAGT1 is involved in the expression of several cell cycle-related genes, which are required for S-phase progression. We concluded that the upregulation of p21, through the downregulation of MYC might be the main mechanism of S-phase arrest induced by the downregulation of MAGT1.
MAGT1 regulates groups of the signaling pathway-related genes transcription
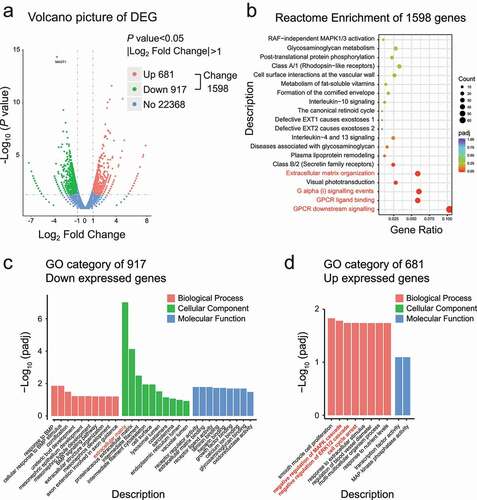
To further explore the role of MAGT1, we extracted RNA from HeLa cells transfected with different siRNAs treatments for 48 h and conducted RNA sequencing and bioinformatics analyses. Genes with significant expression changes (i.e. a twofold increase) were selected for further analyses ()). As expected, the knockdown of MAGT1 induced substantial transcriptional expression changes in 1,598 genes (indicated as Change 1,598, )), of which, 681 upregulated (Up 681) and 917 downregulated (Down 917). The reactome enrichment showed that MAGT1 might regulate the G-protein coupled receptor (GPCR) signaling pathway and may be involved in extracellular matrix organization ()). Gene Ontology (GO) analysis of all the 1,598 changed genes provided lots of information, such as receptor-ligand activity, receptor regulatory activity, extracellular matrix, cell proliferation, and epithelial cell differentiation, indicating that MAGT1 might involve in signal transduction, cell proliferation, and differentiation. To further investigate the function of MAGT1-regulated genes, we conducted GO analysis for the 681 upregulated and 917 downregulated genes respectively. The biological process results showed that the downregulated genes were involved in the bone morphogenetic protein (BMP) signaling pathway and development ()), indicating that MAGT1 might be involved in development through the BMP signaling pathway, which was consistent with our previous study in Drosophila [Citation11]. Interestingly, the biological processes of the upregulated genes were mainly involved in cell proliferation and cell-cycle arrest ()), which was consistent with our previous observation of a decrease in the number of cells and S-phase arrest in MAGT1 down-regulated cells (). The biological process of the upregulated genes also indicated the negative regulation of the MAPK signaling pathway, especially the ERK1/2 cascade ()); thus, the inhibition of cell proliferation might be due to the negative regulation of the ERK/MAPK signaling pathway. The results of the molecular function analyses were similar to those of the biological process analysis, indicating that MAGT1 is mainly involved in MAPK and BMP signaling pathways. The cellular component analysis of the upregulated genes was not significant, while the down-expressed genes are mainly extracellular matrix on the cell surface (,d)), indicating that the extracellular components of the signaling pathways were regulated by MAGT1. Together, MAGT1 might regulate the transcription of batches of signaling pathway-related genes, which might function in cell proliferation, and differentiation.
Figure 3. MAGT1 regulates a large batch of target gene expression
Downregulation of MAGT1 inhibits the activation of ERK and p38, but not the JNK MAPK signaling pathway
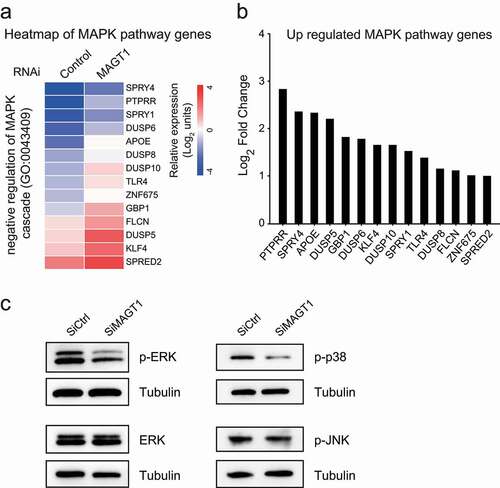
Considering our previous results on cell proliferation, we focused on the 917 upregulated genes. Through GO combined with Kyoto Encyclopedia of Genes and Genomes (KEGG) analyses, we found that 14 genes of MAPK negative regulators were significantly upregulated in MAGT1 siRNA-treated cells (,b)), nine of which negatively regulated MAP kinase activity. Therefore, MAGT1 might participate in the positive regulation of the MAPK signaling pathway through MAP kinase regulation. To confirm our hypothesis, we performed western blot analysis to detect the phosphorylation of ERK, p38, and JNK, the three core MAP kinases of the MAPK signaling pathway. The results showed that the protein level of total ERK did not change in the siRNA-treated cells and the phosphorylation levels of the ERK protein were significantly reduced in MAGT1-RNAi-treated cells ()), which was consistent with the previous GO analysis ()). The phosphorylation of p38 was also reduced in MAGT1-knocked down cells, but not the phosphorylated JNK ()), indicating that MAGT1-RNAi decreased the ERK/p38 MAPK signaling pathway, but not JNK. Taking these findings into consideration, MAGT1 might be involved in the ERK/p38 MAPK signaling pathway by upregulating the MAPK negative regulator genes.
Figure 4. Downregulation of MAGT1 causes the reduction of ERK/p38 MAPK signaling pathways
MAGT1 antagonizes HPV18 E6/7 viral proteins during G1/S progression
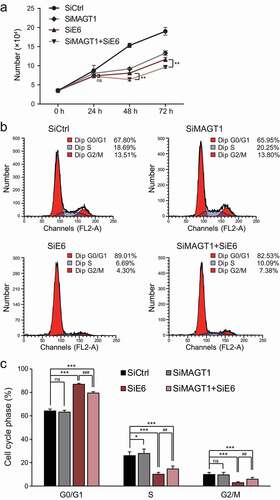
HPV18 E6/E7 viral proteins are reported to sustain the proliferation of immortalized cells through the G1/S transition [Citation36]. The proteins are cervical cancer hallmarks and are vital targets for cancer therapy [Citation37]. Thus, research on discovering new regulatory factors for star molecules is extremely urgent. Our previous results revealed a new cell cycle regulation role of MAGT1 in promoting HeLa cell proliferation (), which drew our attention to the association between MAGT1 and E6/E7. The siRNAs targeting the two viral proteins are vital anti-cancer drugs in cancer therapy [Citation38]. Therefore, to confirm the effect of MAGT1 in cancer therapy, we transfected cells with different siRNAs and counted the cell number at different time points using the cell counter, and the cell cycle profile was determined by FACS. As shown in ), MAGT1 RNAi alone reduced the cell number after 48 h and 72 h, which is consistent with our previous results. In addition, compared with the negative control, the number of E6/E7 RNAi cells was remarkably reduced at 48 h and 72 h, consistent with a previous report [Citation37]. Importantly, the cell number was significantly reduced at 48 h and 72 h when MAGT1 and E6/E7 were introduced simultaneously RNAi, which is much less than E6/E7 single RNAi, suggesting that the viral protein E6/E7 requires MAGT1 to promote proliferation. The FACS data showed that the S-phase cells accumulated in the MAGT1 single RNAi group, consistent with our previous results (). Conversely, the number of S-phase cells was remarkably decreased in the E6/E7 RNAi group, while the decrease was alleviated by MAGT1 RNAi (,c)), indicating that MAGT1 antagonizes the viral proteins E6/E7 during G1/S progression. Taken together, these results demonstrate that MAGT1 antagonizes the function of E6/E7 viral proteins through G1/S phase progression, indicating a promising anti-cancer role of MAGT1 in cervical cancer therapy.
Figure 5. MAGT1 is required for E6/E7 proliferation regulation and G1/S transition
Discussion
In this study, we efficiently silenced MAGT1 using specific siRNAs and observed a remarkable downregulation in two cervical cancer cells. As Mg2+ and its transporters are implicated in the regulation of cell proliferation [Citation39], it is relevant to note that after 48 h and 72 h of MAGT1 silencing, we detected approximately 50% growth retardation in HeLa cells, which was accompanied with S-phase arrest (). Therefore, our data confirmed the critical role of MAGT1 in cell proliferation.
The cell cycle is finely modulated by the sequential expression of cyclins and associated CDKs. It is well documented that cell proliferation depends on four distinct phases, which include G0/G1, S, G2, and M, that are regulated by several cyclin-dependent kinases (CDKs) [Citation15]. Thus, the dysregulation of the cell cycle is regarded as a promising target for cancer therapy. Using FACS analysis, we found that MAGT1 knockdown significantly induced S-phase arrest in HeLa cells (,f)). Cell cycle assessments showed that cyclin-A/CDK2 and cyclin-E/CDK2 complexes are involved in the proper entry into, and progression through the S-phase of the cell cycle. To confirm that S-phase arrest was induced by the loss of MAGT1, the expression levels of the three S-phase related genes were analyzed using RT-qPCR and western blot analyses in RNAi-treated-MAGT1 and control cells. We found that cyclin-E and CDK2, but not cyclin-A, were downregulated in MAGT1-knocked down HeLa cells (–d)). This suggests that the accumulation phenomenon in the S phase when MAGT1 knockdown occurs in cells might be due to the suppression of cyclin-E and CDK2 levels. Although we also observed a decrease in cyclin-D1 in both MAGT1-knocked down cells, there were no significant decrease in CDK4 in either SiMGAT1 treated HeLa or SiHa cells, which might explain why the G1-phase was not significantly affected in the siRNA-treated cells.
Considering the obvious influence of p21, an inhibitor of CDKs which blocks the cell cycle by binding to and inhibiting their kinase activities in S-phase arrest [Citation19], similar treatments have also been used for the detection of p21 transcription. The results showed a remarkable increase in p21 in MAGT1-downregulated cells ()). Therefore, we concluded that the upregulation of p21 might be another mechanism of S-phase arrest induced by MAGT1 downregulation.
p21 is regulated by a variety of upstream regulators, the most studied of which is p53 [Citation24]. Additionally, many proteins interact with these transcription factors and affect their role in regulating the expression of p21, including the well-known tumorigenic factor MYC [Citation22,Citation23]. MYC binds to p53 and inhibits the enrichment of p53 at the promoter region of CDKN1A, thereby inhibiting the transcription of CDKN1A [Citation35]. Thus, the mRNA levels of p21-related regulatory genes were screened by RT-qPCR, and the results showed that although the level of p53 remained constant, its antagonist MYC was downregulated in the MAGT1 siRNA-treated cells ()), which may induce the expression of p21 and finally lead to S-phase arrest in HeLa cells.
MAPK is considered as one of the typical signals in several cancers [Citation30,Citation33]. Furthermore, the MAPK pathway promotes the stability of oncogenic MYC proteins to enhance the inhibitory effects on p21 expression [Citation27,Citation29]. We previously found a positive correlation between MAGT1 and MYC expression through a qPCR experiment in HeLa and SiHa cells ()). On the other hand, our genome-wide RNA-Seq and bioinformatics analyses revealed that MAGT1 knockdown considerably altered the expression of MAPK-related genes () and ,b). Thus, we speculated that MAGT1 might modulate the stability of MYC through the MAPK signaling pathway, which is one of the two main mechanisms by which MYC regulates p21 expression under MAGT1. The other is the transcription level of MYC, as we have previously shown ()). As the MAPK pathway regulates the expression of MYC in the nucleus, it is reasonable to suppose that MAGT1 regulates the expression of MYC through the MAPK pathway, which ultimately mediates cell cycle regulation in HeLa cells. Consistent with our speculation, MAGT1 knockdown attenuated the phosphorylation of ERK1/2 and p38 (the two core factors of the MAPK pathway) in HeLa cells ()), demonstrating the proliferative effects of MAGT1 via the MAPK-MYC axis. Similarly, Zheng et al. reported that MAGT1 increased the phosphorylation of the ERK MAPK pathway in odontogenic differentiation of mesenchymal stem cells [Citation12]. Taken together, knockdown of MAGT1 restrained the proliferation of HeLa cells as well as the ERK/p38 MAPK/MYC cascade, exhibiting a tumor inhibitory effect.
Due to the cell cycle regulation of MAGT1 in the HPV18 positive HeLa cells (), we also studied the functional correlation between MAGT1 and the HPV18 proteins E6 and E7. The viral proteins E6/E7 are required for cell proliferation by regulating the G1/S phase progression [Citation40,Citation41]. The intention was to determine whether MAGT1 regulates the function of E6/E7 in cell cycle regulation, and the results showed that MAGT1 antagonized the viral proteins E6/E7 in G1/S phase progression (), indicating a promising anti-cancer role of MAGT1. Moreover, the molecular mechanisms of these genes require further exploration.
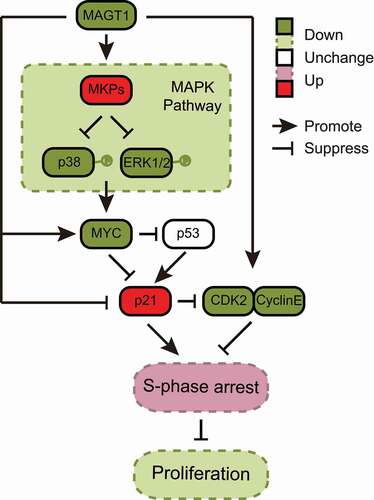
In conclusion, our research revealed that knockdown of MAGT1-induced S-phase arrest, attenuated the expression of cyclin-E, CDK2, and MYC, increased p21 expression, and decreased the phosphorylation of ERK1/2 and p38 in the MAPK signaling pathway in HeLa cells. The full principle of this mechanism is illustrated in . Taken together, our findings provide insights into the antitumor effects of MAGT1 via p21-mediated S-phase arrest and the inhibition of the ERK/p38 MAPK/MYC cascade, as well as the antagonism of the viral proteins E6/E7 in G1/S phase progression, indicating that MAGT1 might be a potent anticancer candidate.
Figure 6. Molecular mechanism of MAGT1 in HeLa cell proliferation
Author contributions
C.B., W.L., and H.S. designed the study and wrote the paper. C.B., X.Z., Y.C., Y.D., Y.S., Y.L., D.L. and X.C. performed experiments, data analyses, and interpretation. All authors reviewed and approved the manuscript. The authors thank Dr Haibo Sun for critical reading and comments on the paper.
Data availability statement
The GEO accession number for the RNA-seq data is GSE166084. The data that support the findings of this study are available from the corresponding author upon reasonable request. https://www.ncbi.nlm.nih.gov/geo/query/acc.cgi?acc=GSE166084
Disclosure statement
No potential conflict of interest was reported by the author(s).
Additional information
Funding
References
- Goytain A, Quamme GA. Identification and characterization of a novel mammalian Mg2+ transporter with channel-like properties. BMC Genomics. 2005;6:48.
- Quamme GA. Molecular identification of ancient and modern mammalian magnesium transporters. Am J Physiol Cell Physiol. 2010;298(3):C407–429.
- Brigida I, Chiriaco M, Di Cesare S, et al. Large deletion of MAGT1 gene in a patient with classic kaposi sarcoma, CD4 lymphopenia, and EBV infection. J Clin Immunol. 2017;37(1):32–35.
- Li FY, Lenardo MJ, Chaigne-Delalande B. Loss of MAGT1 abrogates the Mg2+ flux required for T cell signaling and leads to a novel human primary immunodeficiency. Magnes Res. 2011;24(3):S109–114.
- Blommaert E, Peanne R, Cherepanova NA, et al. Mutations in MAGT1 lead to a glycosylation disorder with a variable phenotype. Proc Natl Acad Sci U S A. 2019;116(20):9865–9870.
- Trapani V, Shomer N, Rajcan-Separovic E. The role of MAGT1 in genetic syndromes. Magnes Res. 2015;28(2):46–55.
- Qiao Y, Mondal K, Trapani V, et al. Variant ATRX syndrome with dysfunction of ATRX and MAGT1 genes. Hum Mutat. 2014;35(1):58–62.
- Matsuda-Lennikov M, Biancalana M, Zou J, et al. Magnesium transporter 1 (MAGT1) deficiency causes selective defects in N-linked glycosylation and expression of immune-response genes. J Biol Chem. 2019;294(37):13638–13656.
- Zheng J, Mao X, Ling J, et al. Role of magnesium transporter subtype 1 (MagT1) in the osteogenic differentiation of rat bone marrow stem cells. Biol Trace Elem Res. 2016;171(1):131–137.
- Castiglioni S, Romeo V, Locatelli L, et al. The simultaneous downregulation of TRPM7 and MagT1 in human mesenchymal stem cells in vitro: effects on growth and osteogenic differentiation. Biochem Biophys Res Commun. 2019;513(1):159–165.
- Xun Q, Bi C, Cui X, et al. MagT1 is essential for Drosophila development through the shaping of Wingless and Decapentaplegic signaling pathways. Biochem Biophys Res Commun. 2018;503(2):1148–1153.
- Zheng JM, Kong YY, Li YY, et al. MagT1 regulated the odontogenic differentiation of BMMSCs induced byTGC-CM via ERK signaling pathway. Stem Cell Res Ther. 2019;10(1):48.
- Zheng K, Yang Q, Xie L, et al. Overexpression of MAGT1 is associated with aggressiveness and poor prognosis of colorectal cancer. Oncol Lett. 2019;18(4):3857–3862.
- Molee P, Adisakwattana P, Reamtong O, et al. Up-regulation of AKAP13 and MAGT1 on cytoplasmic membrane in progressive hepatocellular carcinoma: a novel target for prognosis. Int J Clin Exp Pathol. 2015;8(9):9796–9811.
- Malumbres M, Barbacid M. Cell cycle, CDKs and cancer: a changing paradigm. Nat Rev Cancer. 2009;9(3):153–166.
- Aleem E, Kiyokawa H, Kaldis P. Cdc2-cyclin E complexes regulate the G1/S phase transition. Nat Cell Biol. 2005;7(8):831–U893.
- Pagano M, Pepperkok R, Verde F, et al. Cyclin A is required at two points in the human cell cycle. EMBO J. 1992;11(3):961–971.
- Girard F, Strausfeld U, Fernandez A, et al. Cyclin A is required for the onset of DNA replication in mammalian fibroblasts. Cell. 1991;67(6):1169–1179.
- Radhakrishnan SK, Feliciano CS, Najmabadi F, et al. Constitutive expression of E2F-1 leads to p21-dependent cell cycle arrest in S phase of the cell cycle. Oncogene. 2004;23(23):4173–4176.
- Bunz F, Dutriaux A, Lengauer C, et al. Requirement for p53 and p21 to sustain G2 arrest after DNA damage. Science. 1998;282(5393):1497–1501.
- Bertoli C, Skotheim JM, De Bruin RA. Control of cell cycle transcription during G1 and S phases. Nat Rev Mol Cell Biol. 2013;14(8):518–528.
- Gartel AL, Shchors K. Mechanisms of c-myc-mediated transcriptional repression of growth arrest genes. Exp Cell Res. 2003;283(1):17–21.
- Gartel AL, Ye X, Goufman E, et al. Myc represses the p21(WAF1/CIP1) promoter and interacts with Sp1/Sp3. Proc Natl Acad Sci U S A. 2001;98(8):4510–4515.
- Macleod KF, Sherry N, Hannon G, et al. p53-dependent and independent expression of p21 during cell growth, differentiation, and DNA damage. Genes Dev. 1995;9(8):935–944.
- El-deiry WS, Tokino T, Velculescu VE, et al. WAF1, a potential mediator of p53 tumor suppression. Cell. 1993;75(4):817–825.
- Sun Y, Liu WZ, Liu T, et al. Signaling pathway of MAPK/ERK in cell proliferation, differentiation, migration, senescence and apoptosis. J Recept Signal Transduct Res. 2015;35(6):600–604.
- Gramling MW, Eischen CM. Suppression of Ras/Mapk pathway signaling inhibits Myc-induced lymphomagenesis. Cell Death Differ. 2012;19(7):1220–1227.
- Roux PP, Blenis J. ERK and p38 MAPK-activated protein kinases: a family of protein kinases with diverse biological functions. Microbiol Mol Biol Rev. 2004;68(2):320–344.
- Sears R, Nuckolls F, Haura E, et al. Multiple Ras-dependent phosphorylation pathways regulate Myc protein stability. Genes Dev. 2000;14(19):2501–2514.
- Kim EK, Choi EJ. Pathological roles of MAPK signaling pathways in human diseases. Biochim Biophys Acta. 2010;1802(4):396–405.
- Caunt CJ, Keyse SM. Dual-specificity MAP kinase phosphatases (MKPs): shaping the outcome of MAP kinase signalling. FEBS J. 2013;280(2):489–504.
- Johnson GL, Lapadat R. Mitogen-activated protein kinase pathways mediated by ERK, JNK, and p38 protein kinases. Science. 2002;298(5600):1911–1912.
- Chang L, Karin M. Mammalian MAP kinase signalling cascades. Nature. 2001;410(6824):37–40.
- Bhalla US, Ram PT, Iyengar R. MAP kinase phosphatase as a locus of flexibility in a mitogen-activated protein kinase signaling network. Science. 2002;297(5583):1018–1023.
- Ceballos E, Delgado MD, Gutierrez P, et al. c-Myc antagonizes the effect of p53 on apoptosis and p21WAF1 transactivation in K562 leukemia cells. Oncogene. 2000;19(18):2194–2204.
- Gu W, Putral L, Hengst K, et al. Inhibition of cervical cancer cell growth in vitro and in vivo with lentiviral-vector delivered short hairpin RNA targeting human papillomavirus E6 and E7 oncogenes. Cancer Gene Ther. 2006;13(11):1023–1032.
- Pal A, Kundu R. Human papillomavirus E6 and E7: the cervical cancer hallmarks and targets for therapy. Front Microbiol. 2019;10:3116.
- Nishida H, Matsumoto Y, Kawana K, et al. Systemic delivery of siRNA by actively targeted polyion complex micelles for silencing the E6 and E7 human papillomavirus oncogenes. J Control Release. 2016;231:29–37.
- de Baaij JH, Hoenderop JG, Bindels RJ. Magnesium in man: implications for health and disease. Physiol Rev. 2015;95(1):1–46.
- Malanchi I, Caldeira S, Krutzfeldt M, et al. Identification of a novel activity of human papillomavirus type 16 E6 protein in deregulating the G1/S transition. Oncogene. 2002;21(37):5665–5672.
- Martin LG, Demers GW, Galloway DA. Disruption of the G1/S transition in human papillomavirus type 16 E7-expressing human cells is associated with altered regulation of cyclin E. J Virol. 1998;72(2):975–985.