
ABSTRACT
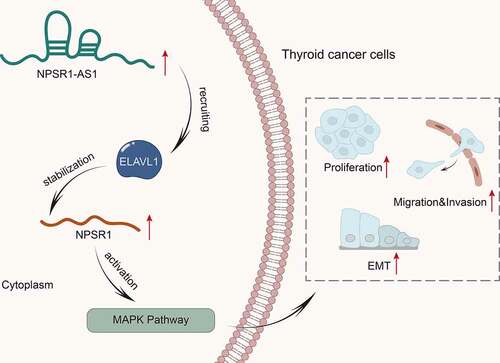
Thyroid cancer (TC) is a prevailing malignant disease in endocrine system. Recent reports have demonstrated that long non-coding RNAs (lncRNAs) are crucial participators in TC progression. In our study, we majorly investigated the molecular mechanism of neuropeptide S receptor 1 antisense RNA 1 (NPSR1-AS1) in TC. Western blot and qPCR analyses were applied for the measurement of protein and RNA expressions in TC cells. Colony formation, EdU, and transwell assays, supported by western blot analyses, were implemented for probing NPSR1-AS1 impacts on TC cell malignant phenotype. Moreover, bioinformatics prediction, RIP and Actinomycin D assays detected the downstream mechanism of NPSR1-AS1 in TC cells. In short, NPSR1-AS1 displayed high expression TC cells, and NPSR1-AS1 silence inhibited TC cell malignant behaviors. Additionally, NPSR1-AS1 positively regulated its nearby gene neuropeptide S receptor 1 (NPSR1). ELAV like RNA binding protein 1 (ELAVL1) served as the RNA-binding protein (RBP) to combine with NPSR1-AS1 and NPSR1. Silencing of ELAVL1 reduced the stability of NPSR1 mRNA. Moreover, NPSR1 could activate the mitogen-activated protein kinases (MAPK) pathway in TC cells. Collectively, our study elucidated the aspect of lncRNA-RBP-mRNA interaction which might be a novel sight for TC treatment.
KEYWORDS:
Introduction
Thyroid cancer (TC) is a frequent malignant tumor with high incidence rate in endocrine system [Citation1]. The pathologic types of TC include papillary carcinoma, follicular carcinoma, undifferentiated carcinoma and medullary carcinoma [Citation2]. Surgery, radiotherapy and chemotherapy are main therapeutic methods for TC [Citation3]. Recently, novel molecular targeted therapies have been brought into focus as promising treatment strategy [Citation4]. As a consequence, the identification of potential targets is important for effective treatment of TC.
Long non-coding RNAs (lncRNAs), a kind of RNAs with the transcripts more than 200 nucleotides in length and lack of the capacity of coding protein, have received more and more attention in investigation into occurrence and development of tumors [Citation5]. Accumulating studies have demonstrated that lncRNAs are implicated in the biological processes via regulating gene expression through a variety of mechanisms, including modulation of transcription, translation, protein modification as well as the formation of RNA-protein or protein-protein complexes [Citation6]. In recent years, a large number of lncRNAs have been identified to be oncogenes or tumor suppressors in the development of TC [Citation7]. LncRNA XIST is up-regulated in TC tissues and cells and facilitates the tumor growth of TC [Citation8]. LncRNA RPL34-AS1 is low expressed in papillary thyroid cancer, a subtype of TC, and represses cell proliferation and invasion [Citation9]. LncRNA neuropeptide S receptor 1 antisense RNA 1 (NPSR1-AS1), the antisense transcript of a protein encoded by NPSR1 gene, has been reported by Zi-Lin Huang et al. as a potential prognostic target for hepatocellular carcinoma [Citation10]. However, the function of NPSR1-AS1 in TC remains largely unclear.
RNA-binding proteins (RBPs) are responsible for the stability of mRNA at post-transcriptional levels [Citation11,Citation12]. ELAV like RNA binding protein 1 (ELAVL1), a member of the ELAV RBP family, binds to the AU-rich elements (AREs) in the 3ʹUTRs of its target mRNAs to modulate mRNA stability, which has been extensively involved in the development of cancers [Citation13]. Moreover, increased cytoplasmic ELAVL1 protein level has been discovered in many types of cancers [Citation14].
The involvement of signaling pathways including MAPK pathway has been raveled out in studying the potential regulatory mechanisms of lncRNAs in various malignancies. For instance, MARK pathway has been ascertained to be involved in the invasion of lung cancer cells modulated by lncRNA TUC338 [Citation15]. It is learnt from a recent study that lncRNA MEG3 mediates neuronal apoptosis in ischemic stroke via modulation of miR-424-5p expression and MARK signaling pathway activation [Citation16]. Moreover, hypoxia-inducible NPSR1-AS1 promotes the proliferation and glycolysis of hepatocellular carcinoma cells, possibly by regulating the MAPK/ERK pathway [Citation17]. Therefore, we wondered whether MARK signaling pathway was a potential participant in the regulatory mechanism of NPSR1-AS1 in TC.
In our study, we focused on investigating the molecular mechanism of NPSR1-AS1 in TC. We assessed NPSR1-AS1 expression in TC cells and the impacts of NPSR1-AS1 on TC cell proliferation, migration, invasion and epithelial–mesenchymal transition (EMT). Moreover, we investigated the regulatory mechanism between NPSR1-AS1 and its nearby gene, and exposed the relation between NPSR1-AS1 and RBP. Conclusively, our study elucidated the aspect of lncRNA-RBP-mRNA interaction which might be a novel sight for better understanding of TC.
Material and methods
Cell culture
TC cell line KTC-1 (derived from metastatic site) was purchased from Procell Company (Wuhan, China). TC cell lines SW1736 (derived from thyroid gland anaplastic carcinoma) and KAT18 (derived from thyroid gland anaplastic carcinoma) were procured from the Chinese Academy of Sciences Tumor Cell Bank (Shanghai, China). TC cell line FTC133 (derived from thyroid gland follicular carcinoma) and human normal thyroid cell line Nthy-ori 3–1 were purchased from Shanghai Huzhen Biotechnology Co., LTD (Shanghai, China). All cells were cultured in RPMI-1640 medium supplemented with 10% FBS in a humid atmosphere containing 5% CO2 at 37°C.
Cell transfection
Two shRNA targeting NPSR1-AS1 and negative control (sh-NC), sh-ELAVL1#1/2 and sh-NPSR1#1/2 were purchased from Gene-Pharma Cells Company. The NPSR1 sequence was sub-cloned into the pcDNA3.1 vector (Invitrogen) to enhance NPSR1 expression (pcDNA3.1-NPSR1) and empty vector (pcDNA3.1). The transfection was conducted using Lipofectamine 3000 (Invitrogen, USA) in line with supplier’s suggestions for 48 h.
Quantitative reverse transcription polymerase chain reaction (RT-qPCR)
Based on instructions, total RNA was extracted from cells (24 hours after successful transfection) using Trizol reagent (Invitrogen, USA). Then RNA was reversely transcribed to cDNA using M-MLV reverse transcriptase (Promega), followed by SYBR Primix Ex TaqTM II Kit for qPCR (Applied Biosystems, USA). GAPDH was used for internal reference [Citation18]. Primer sequences were listed in . The thermal program included: reverse transcription at 30°C for 10 min, predenaturation at 95°C for 30 sec, denature at 95°C for 15 sec, annealing and elongation at 55°C for 30 sec, repeated for 35 cycles. All results were calculated by 2−ΔΔCt method.
Table 1. Primer sequences used in RT-qPCR were listed
Colony formation
Cells with the density of 500 stably transfected cells per well were plated in 6-well plates for 10-day incubation, followed by the fixation process with 4% paraformaldehyde and the staining with 0.5% crystal violet solution. Colonies were eventually observed and counted manually.
5-Ethynyl-2ʹ-deoxyuridine (EdU)
The EdU (Ribobio) kit was used to detect cell proliferation conforming to supplier’s advice. Cells (48 hours after successful transfection) were seeded into 96-well plates, and 100 μl medium containing 50 μM EdU was added into each well for incubation at 37°C. Then cells were fixed and permeated, followed by Apollo reaction. DAPI was used to counterstain cells. Images were observed using a fluorescence microscopy (Nikon).
Transwell
Cell migration and invasion were measured using Transwell chambers with 8 µm pore size membrane inserts (BD Biosciences). Cells (48 hours after successful transfection) seeded into 100 µl serum-free medium were put into the upper chamber, while 600 µl medium containing 10% FBS was added to the lower chamber. After 48 h incubation, non-migrated cells in the upper chamber were wiped and the migrated cells in the lower chamber were fixed with 4% paraformaldehyde and stained with 0.5% crystal violet, followed by observation via an inverted microscope (Olympus). For cell invasion assay, the procedures were the same as cell migration assay, except the membranes were pre-coated with Matrigel.
Western blot
Total protein was extracted from cells (48–72 hours after successful transfection) using RIPA lysis (Thermo Fisher) The protein concentration was determined by BCA protein assay kit (Abcam, UK). Then protein was fractionated by 10% SDS-PAGE, and then transferred to PVDF membranes (Millipore, USA). Protein was sealed by 5% skim milk, followed by incubation with the primary antibody against E-cadherin (ab40772, Abcam, 1/10,000), Vimentin (ab92547, Abcam, 1/1000), N-cadherin (ab245117, Abcam, 1/1000), NPSR1 (ab92425, Abcam, 1 µg/ml), p-ERK1 (AF1015, Abcam, 1/1000), p-ERK2 (AF1014, Abcam, 1/1000), ERK1 (ab32537, Abcam, 1/1000), ERK2 (ab32081, Abcam, 1/1000), p-JNK (AF3320, Abcam, 1/1000), JNK (ab199380, Abcam, 1/1000) and GAPDH (ab8245, Abcam, 1/1000) overnight at 4°C, and then hatched with secondary antibodies for 1 hour. Blots were tested using Clarity Max western ECL substrate (Biorad, USA).
RNA immunoprecipitation (RIP)
RIP experiments were conducted with a Magna RIP™ RNA-Binding Protein Immunoprecipitation Kit (Millipore, Billerica, MA) in the light of provider’s suggestions. ELAVL1 antibody was used for RIP. Co-precipitated RNAs were measured by RT-qPCR.
Actinomycin D assay
Control and transfected cells were treated with Actinomycin D at a final concentration of 4 μM. The Actinomycin D was added to cells 0 h, 2 h, 4 h, 6 h or 8 h before RNA extraction. RT-qPCR analysis was then applied for the measurement of RNA levels.
Subcellular fractionation assay
Cytoplasmic and nuclear RNAs of KAT-18 and FTC133 cells were extracted and purified with the utilization of Cytoplasmic and Nuclear RNA Purification Kit (21,000, Norgenbiotek, Thorold, ON, Canada) according to the standard protocol. RNA levels of NPSR1-AS1, U6 (nuclear control) and GAPDH (cytoplasmic control) were measured via RT-qPCR.
Statistical analysis
Data were indicated as mean ± SD and all experiments were conducted in triplicate. The assessment of the difference within groups was conducted via the utilization of one-way analysis of variance or student’s t-test. Analysis was performed using GraphPad Prism software. P value less than 0.05 was recognized significantly.
Results
NPSR1-AS1 is highly expressed in TC cells
To investigate the relation between NPSR1-AS1 and TC, we first used GTEx (https://gtexportal.org/) database for analyzing NPSR1-AS1 expression in various kinds of normal tissues. implied that NPSR1-AS1 presented a low level in 323 cases of normal thyroid tissues. The same result was observed from NCBI (https://www.ncbi.nlm.nih.gov/) database (). Accordantly, we utilized RT-qPCR to detect NPSR1-AS1 expression in TC cells (KTC-1, SW1736, KAT-18 and FTC133) and human normal thyroid cells (Nthy-ori 3–1). Compared to Nthy-ori 3–1, NPSR1-AS1 expression was higher in TC cells, especially in KAT-18 and FTC133 cells (). Collectively, NPSR1-AS1 was highly expressed in TC cells.
Figure 1. NPSR1-AS1 displayed high expression in TC cells. A-B GTEx and NCBI databases analyzed NPSR1-AS1 expression in various kinds of normal tissues. C RT-qPCR quantified NPSR1-AS1 expression in TC cells (KTC-1, SW1736, KAT-18 and FTC133) and human normal thyroid cells (Nthy-ori 3–1). *P < 0.05, **P < 0.01.
NPSR1-AS1 knockdown inhibits TC cell malignant behaviors
Since KAT-18 and FTC133 cells exhibited the highest expression of NPSR1-AS1, we transfected two specific shRNAs targeting NPSR1-AS1 into KAT-18 and FTC133 cells, and found that NPSR1-AS1 expression obviously declined (). Then we assessed the influence of NPSR1-AS1 knockdown on TC cell biological behaviors. According to the experimental results of colony formation and EdU assays, an overt decline in colonies and EdU positive stained cells was discovered as a result of NPSR1-AS1 silence, reflecting that NPSR1-AS1 depletion impeded TC cell proliferation (-). Besides, the migration and invasion capacities of TC cells were discovered to be repressed in response to NPSR1-AS1 depletion (). Moreover, we also assessed the function of NPSR1-AS1 on the EMT process of TC cells. Through western blot, NPSR1-AS1 down-regulation was discovered to result in an overt decline in the protein levels of mesenchymal markers (N-cadherin and Vimentin) and meanwhile a marked augment in the level of epithelium marker (E-cadherin) in KAT-18 and FTC133 cells (). Totally, NPSR1-AS1 depletion impeded TC cell malignant behaviors.
Figure 2. NPSR1-AS1 knockdown inhibits TC cell malignant behaviors. A RT-qPCR was done for the measurement of NPSR1-AS1 expression in sh-NPSR1-AS1 transfected KAT-18 and FTC133 cells. B-C Colony formation and EdU assays were done for the evaluation of KAT-18 and FTC133 cell proliferation under the influence of NPSR1-AS1 depletion. D Transwell assays were done for analyzing the migration and invasion capacities of KAT-18 and FTC133 cells under the influence of NPSR1-AS1 silence. E Western blot analyzed the protein levels of mesenchymal markers (N-cadherin and Vimentin) and epithelium marker (E-cadherin) in NPSR1-AS1 silenced cells. **P < 0.01.
NPSR1-AS1 post-transcriptionally regulates NPSR1 expression in TC cells
LncRNAs have been widely reported to be capable of regulating the expression of their nearby genes [Citation19]. Likewise, our study also investigated the relation of NPSR1-AS1 and its nearby gene NPSR1. We first measured the expression of NPSR1 in TC cells and Nthy-ori 3–1, and found that NPSR1 was abnormally high expressed in TC cells (). Moreover, we found that NPSR1 expression at both mRNA level and protein level was significantly reduced in KAT-18 and FTC133 cells transfected with shRNAs targeting NPSR1-AS1 (). To further determine the detailed regulatory mechanism involving NPSR1-AS1 and NPSR1, subcellular fractionation assays was done for the verification of NPSR1-AS1 distribution in TC cells. The data showed that NPSR1-AS1 was mainly accumulated in the cytoplasmic part of cells, implying that NPSR1-AS1 post-transcriptionally regulated NPSR1 expression in TC cells (). Taken together, NPSR1-AS1 could modulate the expression of its nearby gene, NPSR1, in TC cells at a post-transcriptional level.
Figure 3. NPSR1-AS1 post-transcriptionally regulates NPSR1 expression in TC cells. A RT-qPCR analysis was done for the investigation into NPSR1 expression in different cell lines including TC cell lines (KTC-1, SW1736, KAT-18 and FTC133) and Nthy-ori 3–1. B the NPSR1 were measured by means of RT-qPCR and western blot in NPSR1-AS1 silenced cells. C Subcellular fractionation assays were done to illustrate the cellular distribution of NPSR1-AS1 in TC cells. *P < 0.05, **P < 0.01.
NPSR1-AS1 recruits ELAVL1 to stabilize NPSR1 mRNA
RBPs are pivotal players in post-transcriptional events [Citation11]. Based on starBase (http://starbase.sysu.edu.cn) database, we predicted 24 possible RBPs combining with NPSR1-AS1 and NPSR1 (). However, only 10 RBPs had the potential of coding proteins. We further inhibited the expression of these 10 RBPs in KAT-18 and FTC133 cells, which were with the highest NPSR1-AS1 and NPSR1 expressions. RT-qPCR was applied to test the knockdown efficiency of shRNAs targeting each RBP in KAT-18 and FTC133 cells (). Then, the expression of NPSR1 in cells transfected with specific shRNAs targeting these 10 RBPs respectively was also detected. The data of RT-qPCR manifested that NPSR1 mRNA level was only significantly reduced when ELAVL1 was silenced in cells (). Additionally, western blot further confirmed that ELAVL1 silence led to a notable decline in the protein level of NPSR1 (). To determine the interaction among NPSR1-AS1, ELAVL1 and NPSR1, RIP assays were conducted. Based on the experimental results, NPSR1-AS1 and NPSR1 were highly precipitated in anti-ELAVL1 (), whereas NPSR1-AS1 deletion could obstruct the combination of NPSR1 and ELAVL1 (). Moreover, we treated Actinomycin D into KAT-18 and FTC133 cells to assess the stability of NPSR1 mRNA. The data indicated that the stability of NPSR1 mRNA in sh-NPSR1-AS1#1 or sh-ELAVL1#1 groups was lower than that in sh-NC group (). All above results suggested that NPSR1-AS1 recruited ELAVL1 to stabilize NPSR1 mRNA.
Figure 4. NPSR1-AS1 recruits ELAVL1 to stabilize NPSR1 mRNA. A StarBase database predicted 24 possible RBPs that combined with NPSR1-AS1 and NPSR1. B RT-qPCR analysis was applied for detecting the expression of these RBPs in cells when these RBPs were silenced respectively. C NPSR1 expression was quantified via RT-qPCR when the RBPs were knocked down. D Western blot analyzed the protein level of NPSR1 in sh-ELAVL1#1/2 transfected cells. E RIP assays detected the enrichment of NPSR1-AS1 and NPSR1 in ELAVL1 groups. F In RIP assays, the enrichment of NPSR1 in ELAVL1 groups under the influence of sh-NPSR1-AS1#1 transfection was measured through RT-qPCR. G Actinomycin D assays assessed the stability of NPSR1 mRNA when NPSR1-AS1 or ELAVL1 was silenced. **P < 0.01, n.s.: no significance.
NPSR1 activates the MAPK pathway in TC cells
Based on previous research, NPSR1 can activate the MAPK pathway to affect the development of tumors [Citation20]. Herein, we also knocked down NPSR1, and utilized RT-qPCR and western blot to confirm the knockdown was successful (). Then, results of following western blot analysis reflected that the protein levels of phosphorylated ERK1 (p-ERK1), p-ERK2 and p-JNK were significantly reduced when NPSR1 was reduced (), suggesting that NPSR1 could activate the MAPK pathway.
Figure 5. NPSR1 activates the MAPK pathway in TC cells. A RT-qPCR and western blot analyses were done for determining NPSR1 knockdown efficiency in cells. B Western blot was applied for the measurement of the protein levels of p-ERK1, p-ERK2 and p-JNK in cells with NPSR1 deficiency. **P < 0.01.
NPSR1-AS1 activates the MAPK pathway and exacerbates TC cell malignant behaviors via regulating NPSR1 expression
Furthermore, to investigate the interaction between NPSR1 and NPSR1-AS1 on the MAPK pathway and TC cell phenotype, we implemented rescue assays. NPSR1 overexpression efficiency in TC cells was firstly examined (). It was observed in western blot analyses that the protein levels of p-ERK1, p-ERK2 and p-JNK were inhibited when NPSR1-AS1 was knocked down, which could be restored on account of the co-transfection of pcDNA3.1-NPSR1 (). Besides, it was mirrored in colony formation and EdU assay that NPSR1 overexpression reversed the weakened proliferation ability of TC cells resulting from NPSR1-AS1 depletion (-). In parallel, the reduced migration and invasion capacity induced by NPSR1-AS1 silence was recovered in response to the co-transfection of pcDNA3.1-NPSR1 (). Moreover, the decreased N-cadherin and Vimentin levels and the increased level of E-cadherin caused by NPSR1-AS1 interference were rescued after co-transfection of pcDNA3.1-NPSR1 (). Collectively, NPSR1-AS1 could exacerbate TC cell malignant behaviors via regulation of NPSR1 expression and activation of MAPK pathway.
Figure 6. NPSR1-AS1 activates the MAPK pathway and facilitates TC cell malignant behaviors via regulating NPSR1 expression. A RT-qPCR and western blot analyses were done for determining NPSR1 overexpression efficiency in cells. Rescue experiments were subsequently done in KAT-18 and FTC133 cells with the transfection of indicated plasmids, including sh-NC (a), sh-NPSR1-AS1#1 (b), sh-NPSR1-AS1#1+ pcDNA3.1 (c) and sh-NPSR1-AS1#1+ pcDNA3.1-NPSR1 (d), respectively. B Western blot analyzed the protein levels of p-ERK1, p-ERK2 and p-JNK in KAT-18 and FTC133 cells transfected with indicated plasmids. C-D Colony formation and EdU assays were conducted for the assessment of cell proliferation ability in four different groups. E Migration and invasion of KAT-18 and FTC133 cells under four different conditions was investigated in transwell assays. F Western blot analyzed the protein levels of EMT markers in KAT-18 and FTC133 cells in four indicated groups. **P < 0.01.
Discussion
It is significant to discern the potential relation between lncRNA and cancer, which may offer a novel molecular biomarker for cancer treatment [Citation21]. In recent years, the implication of lncRNA abnormal expression levels has been reported in the modulation of biological behaviors of cancer cells and the progression of cancers, including TC. LncRNA SPRY4-IT has been ascertained as a facilitator in the mediation of TC cell proliferation and migration [Citation22]. The highest fold-change is obtained for LUCAT1 in TC, and LUCAT1 silence inhibits TC cell proliferation and invasion [Citation23]. In line with these evidences, our study also investigated a novel lncRNA NPSR1-AS1 in TC. We found that NPSR1-AS1 displayed aberrantly higher expression in TC cells. Moreover, colony formation assay and EdU assay results confirmed that NPSR1-AS1 silence obviously repressed cell colony and proliferation, and it was validated based on transwell assay results that NPSR1-AS1 depletion evidently mitigated cell migration and invasion in TC. As reported previously, EMT is closely related to poor prognosis in multiple cancers [Citation24]. The essential role of EMT is also discovered in metastasis, tumor progression and various pathological processes [Citation25]. A study proposed by Hongwei Lei has demonstrated the regulation of lncRNA and EMT formation in TC [Citation26]. Consistently, in our study, we tested EMT related proteins and found that knockdown of NPSR1-AS1 inhibited the EMT process, as shown that NPSR1-AS1 deletion resulted in an overt increment in the level of epithelium marker (E-cadherin) but remarkable reduction in the levels of mesenchymal markers (N-cadherin and Vimentin). All above results suggested that NPSR1-AS1 exerted oncogenic function in TC.
It is learnt from previous reports that lncRNAs can function as the molecular scaffolds to affect downstream target gene expression via binding with proteins [Citation27]. In our study, we found that ELAVL1 was the common protein combined with NPSR1-AS1 and NPSR1. The participation of ELAVL1 in the development of cancers, such as colorectal cancer [Citation28] and breast cancer [Citation29] has been ascertained. Moreover, the oncogenic effect of ELAVL1 is majorly due to the binding and stabilization with cancer-associated mRNAs in the cytoplasm. Of note, ELAVL1 expression is significantly up-regulated in TC [Citation30]. Likewise, our study proved that NPSR1 presented a high expression level in TC cells, and ELAVL1 served as a RBP could regulate the stability of NPSR1 mRNA. Therefore, a conclusion may draw that NPSR1-AS1 positively regulated the expression of its nearby gene NPSR1 via binding with ELAVL1.
Moreover, our study found that NPSR1 could activate the MAPK pathway in TC cells. The mammalian family of MAPKs contains extracellular signal-regulated kinase (ERK), p38 and c-Jun-N-terminal kinase (JNK), and each MAPK pathway consists of at least three components, a MAPK kinase kinase (MAP3K), a MAPK kinase (MAP2K) and a MAPK [Citation31]. Na Wang et al. have uncovered that lncRNA TBX1 exerts anticancer function in TC via repressing the activities of the MAPK pathway [Citation32]. In our study, we further confirmed that NPSR1-AS1 could enhance the MAPK pathway via up-regulating NPSR1 expression. Additionally, NPSR1-AS1 facilitated TC cell malignant behaviors via regulating NPSR1 expression.
There are still some limitations in current study. Specifically, more TC cell lines should be involved to validate the axis we discovered, and the influence of NPSR1-AS1 on normal thyroid gland epithelial cell phenotype including proliferation, migration, and invasion remains unclear. The function of NPSR1-AS1 should be verified in animal models and whether NPSR1-AS1 could encode certain protein needs to be confirmed in additional experiments. Moreover, the regulation of NPSR1-AS1/NPSR1/MARK signaling pathway in TC requires validation in large-scale clinical research studies, which is one of our main targets in the future study.
To sum up, our study expounded the regulatory mechanism of NPSR1-AS1 in TC, which may enrich the molecular mechanisms regarding regulation of lncRNAs on TC progression and provide the experimental and theoretical evidence for the clinical trial of TC.
Acknowledgments
We appreciate the support of laboratory.
Disclosure statement
No potential conflict of interest was reported by the author(s).
Additional information
Funding
References
- Cabanillas ME, McFadden DG, Durante C. Thyroid cancer. Lancet. 2016;388(10061):2783–2795.
- Carling T, Udelsman R. Thyroid cancer. Annu Rev Med. 2014;65(1):125–137.
- Pemayun TG. Current Diagnosis and Management of Thyroid Nodules. Acta Med Indones. 2016;48:247–257.
- Ferrari SM, Fallahi P, Politti U, et al. Molecular Targeted Therapies of Aggressive Thyroid Cancer. Front Endocrinol (Lausanne). 2015;6:176.
- Renganathan A, Long Noncoding F-BE. RNAs in Cancer and Therapeutic Potential. Adv Exp Med Biol. 2017;1008:199–222.
- Peng WX, Koirala P, Mo YY. LncRNA-mediated regulation of cell signaling in cancer. Oncogene. 2017;36(41):5661–5667.
- Luo Y, Hao T, Zhang J, et al. MicroRNA-592 suppresses the malignant phenotypes of thyroid cancer by regulating lncRNA NEAT1 and downregulating NOVA1. Int J Mol Med. 2019;44:1172–1182.
- Liu H, Deng H, Zhao Y, et al. LncRNA XIST/miR-34a axis modulates the cell proliferation and tumor growth of thyroid cancer through MET-PI3K-AKT signaling. J Exp Clin Cancer Res. 2018;37(1):279.
- Ji L, Fan X, Zhou F, et al. lncRNA RPL34-AS1 inhibits cell proliferation and invasion while promoting apoptosis by competitively binding miR-3663-3p/RGS4 in papillary thyroid cancer. J Cell Physiol. 2020;235(4):3669–3678.
- Huang ZL, Li W, Chen QF, et al. Eight key long non-coding RNAs predict hepatitis virus positive hepatocellular carcinoma as prognostic targets. World J Gastrointest Oncol. 2019;11(11):983–997.
- Pereira B, Billaud M, Almeida R. RNA-Binding Proteins in Cancer: old Players and New Actors. Trends Cancer. 2017;3(7):506–528.
- Fabian MR, Sonenberg N, Filipowicz W. Regulation of mRNA translation and stability by microRNAs. Annu Rev Biochem. 2010;79(1):351–379.
- Chen X, Li A, Sun BF, et al. 5-methylcytosine promotes pathogenesis of bladder cancer through stabilizing mRNAs. Nat Cell Biol. 2019;21(8):978–990.
- Abdelmohsen K, Gorospe M. Posttranscriptional regulation of cancer traits by HuR. Wiley Interdiscip Rev RNA. 2010;1(2):214–229.
- Zhang YX, Yuan J, Gao ZM, et al. LncRNA TUC338 promotes invasion of lung cancer by activating MAPK pathway. Eur Rev Med Pharmacol Sci. 2018;22:443–449.
- Xiang Y, Zhang Y, Xia Y, et al. LncRNA MEG3 targeting miR-424-5p via MAPK signaling pathway mediates neuronal apoptosis in ischemic stroke. Aging (Albany NY). 2020;12(4):3156–3174.
- He H, Chen T, Mo H, et al. Hypoxia-inducible long noncoding RNA NPSR1-AS1 promotes the proliferation and glycolysis of hepatocellular carcinoma cells by regulating the MAPK/ERK pathway. Biochem Biophys Res Commun. 2020;533(4):886–892.
- Barber RD, Harmer DW, Coleman RA, et al. GAPDH as a housekeeping gene: analysis of GAPDH mRNA expression in a panel of 72 human tissues. Physiol Genomics. 2005;21(3):389–395.
- Wu X, Xiao Y, Zhou Y, et al. LncRNA FOXP4-AS1 is activated by PAX5 and promotes the growth of prostate cancer by sequestering miR-3184-5p to upregulate FOXP4. Cell Death Dis. 2019;10(7):472.
- Pulkkinen V, Ezer S, Sundman L, et al. Neuropeptide S receptor 1 (NPSR1) activates cancer-related pathways and is widely expressed in neuroendocrine tumors. Virchows Arch. 2014;465(2):173–183.
- Mahmoudian-Sani MR, Jalali A, Jamshidi M, et al. Long Non-Coding RNAs in Thyroid Cancer: implications for Pathogenesis, Diagnosis, and Therapy. Oncol Res Treat. 2019;42(3):136–142.
- Zhou H, Sun Z, Li S, et al. LncRNA SPRY4-IT was concerned with the poor prognosis and contributed to the progression of thyroid cancer. Cancer Gene Ther. 2018;25(1–2):39–46.
- Luzón-Toro B, Fernández RM, Martos-Martínez JM, et al. LUCAT1 as a novel prognostic biomarker for patients with papillary thyroid cancer. Sci Rep. 2019;9(1):14374.
- Diepenbruck M, Christofori G. Epithelial-mesenchymal transition (EMT) and metastasis: yes, no, maybe? Curr Opin Cell Biol. 2016;43:7–13.
- Li S, Cong X, Gao H, et al. Tumor-associated neutrophils induce EMT by IL-17a to promote migration and invasion in gastric cancer cells. J Exp Clin Cancer Res. 2019;38(1):6.
- Lei H, Gao Y, Xu X. LncRNA TUG1 influences papillary thyroid cancer cell proliferation, migration and EMT formation through targeting miR-145. Acta Biochim Biophys Sin (Shanghai). 2017;49(7):588–597.
- Ferrè F, Colantoni A, Helmer-Citterich M. Revealing protein-lncRNA interaction. Brief Bioinform. 2016;17(1):106–116.
- Lan Y, Xiao X, He Z, et al. Long noncoding RNA OCC-1 suppresses cell growth through destabilizing HuR protein in colorectal cancer. Nucleic Acids Res. 2018;46(11):5809–5821.
- Guo X, Connick MC, Vanderhoof J, et al. MicroRNA-16 modulates HuR regulation of cyclin E1 in breast cancer cells. Int J Mol Sci. 2015;16(12):7112–7132.
- Trojanowicz B, Sekulla C, Dralle H, et al. Expression of ARE-binding proteins AUF1 and HuR in follicular adenoma and carcinoma of thyroid gland. Neoplasma. 2016;63(3):371–377.
- Win S, Than TA, Kaplowitz N. The Regulation of JNK Signaling Pathways in Cell Death through the Interplay with Mitochondrial SAB and Upstream Post-Translational Effects. Int J Mol Sci. 2018;19(11):3657.
- Wang N, Li Y, Wei J, et al. TBX1 Functions as a Tumor Suppressor in Thyroid Cancer Through Inhibiting the Activities of the PI3K/AKT and MAPK/ERK Pathways. Thyroid. 2019;29(3):378–394.