
ABSTRACT
MYBL2 has been demonstrated to be an oncogene in some cancers, but there is no pan-cancer analysis at the macro level. We used multiple online or offline bioinformatic tools to examine the effects of MYBL2 in human cancers. We first identified that MYBL2 was highly expressed and related to the stage and grade of most cancers. The results of survival analysis from two databases showed that high MYBL2 expression was positively correlated with a poor prognosis for most cancer patients. We observed a significant difference in the promoter methylation level of MYBL2 in cancers such as colon adenocarcinoma and liver hepatocellular carcinoma versus normal controls. We found that MYBL2 can affect the tumor immune microenvironment by influencing the immune infiltration level and expression level of CD4+ T cells, CD8+ T cells, cancer-associated fibroblasts (CAFs) and immune checkpoint-associated cells. Functional enrichment analysis of MYBL2 identified that MYBL2 can play a crucial role in cancers by regulating spliceosomes, DNA replication and the cell cycle. Moreover, we verified the function of MYBL2 in three cancer cells of glioma, breast cancers and liver cancers, and the results showed that MYBL2 can regulate the cell cycle and proliferation ability of cancers
Introduction
It is a long exploration for studying the molecular mechanism of genes in cancers. The molecular mechanisms of genes in different tumors are affected by a complex network of relationships. A pan-cancer analysis of a given gene can help provide clues and help us better understand the relationship between the gene and cancer. The use of the public databases The Cancer Genome Atlas (TCGA) and Gene Expression Omnibus (GEO) will make it possible to perform pan-cancer analysis using bioinformatic tools [Citation1–3].
MYBL2, also known as B-myb, is a transcription factor of the myeloblastosis family. It was first identified as a cellular homolog of the v-myb oncogene, which is known to cause leukemia in chickens [Citation4]. The protein is made up of 704 amino acids, which form “SWI3, ADA2, N-CoR and TFIIIB” (SANT) DNA-binding domains, a transactivation domain (TA), a conserved region (CR) and a regulatory domain (RD) [Citation5,Citation6]. The DNA-binding domains and CR are almost identical to those of A-MYB and C-MYB and conserved among different species (e.g. H. sapiens, P. troglodytes, M. musculus, etc.) (Fig. S1a) [Citation6]. Unlike A-MYB (expressed mainly in B cells, developing central nervous system cells, mitotic active cells in embryos, and reproductive tissue) and C-MYB (expressed primarily in hematopoietic precursor cells), MYBL2 was expressed in all proliferating cells examined [Citation7]. Functionally, MYBL2 plays a crucial role in the regulation of cell proliferation, the differentiation of proliferating cells, and cell cycle progression [Citation8]. Results related to cancer have shown that MYBL2 is clearly amplified in breast cancers, liver cancers, ovarian cancers and cutaneous T lymphoma and the expression level is correlated with the patient prognosis [Citation9–12]. The expression of MYBL2 was also elevated in prostate and testicular malignancies [Citation13,Citation14]. These results have revealed that MYBL2 may play a crucial role in the occurrence and development of tumors.
Although there have been many studies on the role of MYBL2 in different tumors, a macroscopic analysis of the oncogenic role of MYBL2 in a variety of cancers has been lacking [Citation15–18]. We present the first systematic pan-cancer analysis of MYBL2 using the TCGA and GEO databases. We investigated the effect of MYBL2 expression on prognosis, gene mutation, methylation, and immune infiltration and attempted to analyze the related cell functions and cellular pathways. This study further elucidated the potential molecular mechanism of this gene in various cancers and its potential influence on clinical prognosis.
Methods
Gene expression analysis
The expression level of the MYBL2 gene in various types of human cancers was assessed in the Oncomine database (https://www.oncomine.org/resource/login.html) and the Tumor Immune Estimation Resource, version 2 (TIMER2.0) (http://timer.cistrome.org/) [Citation19,Citation20]. For certain tumors without normal tissue as comparisons in TIMER, we used the online database of Gene Expression Profiling Interactive Analysis (GEPIA) (http://gepia.cancer-pku.cn/index.html) to further investigate their differential expression [Citation21]. We used the TISBID website (http://cis.hku.hk/TISIDB/index.php) to investigate the association between the expression of MYBL2 and the stage and grade of cancers [Citation22]. The expression level of MYBL2 in normal tissues and the expression level of MYBL2 proteins in human cancers were identified in the Human Protein Atlas (HPA) database (https://www.proteinatlas.org/).
Survival analysis
Two databases, GEPIA (http://gepia.cancer-pku.cn/index.html) and Kaplan-Meier (KM) plotter (http://kmplot.com/analysis/), were used for survival analysis of cancer patients grouped according to MYBL2 expression [Citation21]. We used the “Survival Map” module of GEPIA to obtain the overall survival (OS) and disease-free survival (DFS) significance map data of MYBL2 across all 33 tumor types from the TCGA. We divided them into groups with high expression and low expression of MYBL2 with cutoff-high (50%) and cutoff-low (50%) values. KM plotter split the patient samples into two groups according to an automatically calculated optimal cutoff value to analyze the prognostic value of MYBL2 in breast cancer, ovarian cancers, lung cancer, gastric cancer and liver cancer.
Gene alteration analysis
We used the cBioPortal website (http://www.cbioportal.org/) to analyze the gene alteration of MYBL2 through the selected dataset “TCGA Pan Cancer Atlas Studies” [Citation23,Citation24]. We plotted the copy number alteration and gene mutation frequency maps in the “Plots” module. In the “Cancer Types Summary” and “Mutation” modules, we obtained plots of the frequency of alterations in cancers and the mutation sites.
The SangerBox website (http://sangerbox.com/) provides a practical online platform for TCGA data analysis. We used the “Gene” module to plot the association between MYBL2 expression and tumor mutational burden (TMB) and microsatellite instability (MSI).
The methylation analysis
We used three databases to conduct the methylation analysis of MYBL2; these included UALCAN (http://ualcan.path.uab.edu/index.html), Shiny Methylation Analysis Resource Tool (SMART) (http://www.bioinfo-zs.com/smartapp/) and MEXPRESS (https://www.mexpress.be/) [Citation25–27]. We used the “TCGA analysis” module in UALCAN to perform promoter methylation level analysis of MYBL2 in normal tissues and cancers. The SMART website provided images of DNA methylation sites and CpG-aggregated methylation. The MEXPRESS website was used to compare the promoter methylation level between brain low-grade glioma (LGG) and glioblastoma multiforme (GBM).
Immune infiltration analysis
We used the TIMER database and immunedeconv R package to conduct immune infiltration analysis of samples sorted according to MYBL2 expression [Citation20,Citation28]. In the TIMER database, we obtained a correlation heat map of MYBL2 expression and the immune infiltration level of cancer-associated fibroblast (CAF) cells and CD8+ T cells in 33 human cancers based on the EPIC, MCPCOUNTER, XCELL and TIDE algorithms through the “Immune-Gene” module. We produced the correlation curve of meaningful results based on most algorithms through the TIMER database.
We downloaded RNA-seq data for 33 tumor tissues and matched normal tissues from the TCGA database. Then, we used the R package “immunedeconv”, which includes the six algorithms TIMER, xCell, MCPcounter, CIBERSORT, EPIC and quanTIseq, to plot the correlation heat map of MYBL2 expression and the immune infiltration level of the main immune cells by R software (version 4.0.3). The expression values of 8 main immune checkpoint-related genes, SIGLEC15, IDO1, CD274, HAVCR2, PDCD1, CTLA4, LAG3 and PDCD1LG2, were extracted. We analyzed the correlation of MYBL2 expression and the expression of these genes in cancers and plotted a correlation heat map with the R package “immunedeconv”.
Functional enrichment analysis
The STRING (https://string-db.org/) and GEPIA (http://gepia.cancer-pku.cn/index.html) databases were used to predict the interacting proteins and collect the genes related to MYBL2 [Citation21]. The STRING database was used to make protein-protein interaction networks (PPIs) of MYBL2 interaction proteins by changing the default settings to “low confidence (0.150)”, “experiments” and “no more than 50 interactors”. We used the “Similar Genes Detection” module in GEPIA to obtain the top 100 MYBL2-associated genes and the “Correlation Analysis” module to plot the correlation curves of MYBL2 and the top 5 genes in 33 tumors. The correlation heat map of MYBL2 and the top 5 genes in 33 tumors was generated with the “Gene_Corr” module in TIMER.
The Database for Annotation, Visualization and Integrated Discovery (DAVID) (Version 6.8) (https://david.ncifcrf.gov/) was used to conduct functional enrichment analysis of MYBL2. The results of enrichment analysis were visualized through the “ggplot2” package of R software (Version 4.0.3) (https://cran.r‑project.org/web/packages/ggplot2/index.html).
Cell lines
Human glioblastoma cell lines U251MG, human hepatoma cell lines HepG2 and human breast cancer cell lines MCF7 were purchased from American Type Culture Collection. Cells were cultured at 37°C in a humidified 5% CO2 atmosphere with Dulbecco’s Modified Eagle’s Medium (DMEM; Thermo Fisher Scientific, Inc.) containing 10% FBS (Thermo Fisher Scientific, Inc.). These cell lines underwent mycoplasma tests and were authenticated by Short Tandem Repeat (Beijing Microread Genetics Co., Ltd).
Cell transfection
The interfering RNA (siRNA) for the specific inhibition of MYBL2 were purchased from Shanghai GeneChem Co., Ltd. When the cell density was 70–80%, we transfected the 10ug siRNA into the target cells with Lipo-RNA3000 following the manufacture’s instruction (Invitrogen, USA). After maintaining 8 h, the medium with siRNA was replaced to fresh DMEM containg 10% FBS.
Reverse transcription-quantitative (RT-q)PCR assay
Total RNA from cells was extracted by TRIzol (cat. no. 15,596,018; Thermo Fisher Scientific, Inc.) and reverse-transcribed using GoTaq® Reverse Transcription system (cat. no. A3500; Promega Corporation) according to the manufacturer’s instructions. 2X SYBR Green qPCR Master mix (low ROX) (Bimake) was used the next reaction according to the manufacturer’s instructions. The reaction conditions was following: denaturation: 95°C for 15 sec; annealing/extension: 60°C for 30–60 sec; 40 cycles. GAPDH was used as an endogenous control. The gene expression was calculated using 2-ΔΔCq method. All primers were synthesized by Beijing Tianyi Huiyuan Bioscience & Technology Inc. The primer sequences used were as follows: GAPDH forward, 5ʹ-GGAGCGAGATCCCTCCAAAAT-3ʹ and reverse, 5ʹ-GGCTGTTGTCATACTTCTCATGG-3ʹ; MYBL2 forward, 5 ‘ -CTTGAGCGAGTCCAAAGACTG-3 ‘ and reverse, 5 ‘ -AGTTGGTCAGAAGACTTCCCT-3 ‘.
Cell counting kit-8 (CCK-8) cell viability assay
CCK-8 assay was conducted using a CCK-8 kit (cat. no. PA5-84,814; Thermo Fisher Scientific, Inc.). Cells were seeded at 3 × 10³ cells/well in 96-well plates and cultured for 24 h at 37 °C. The CCK-8 mixture was added into each well and the optical density value was measured after incubating for 1 h at 37 °C.
5 – ethynyl – 2 ‘- deoxyuridine (EdU) assay
EdU assay was conducted using a EdU kit (). Cells were seeded at 3 × 10³ cells/well in 96-well plates and cultured for 24 h at 37 °C. After incubating with EdU medium for 2 hours, cells were fixed with 4% paraformaldehyde 20 minutes. Then, cells were incubated with 0.5% TritonX-100 for 10 minutes and washed with PBS for thrice and stained with Apollo dyeing solution. After the nucleus were stained with 4, 6-diamidino-2-phenylindole (DAPI), a laser confocal microscopy (Leica, Heidelberg, Germany) was used for observation.
Cell cycle
Cells were collected after washed with PBS for twice and fixed by 75% alcohol overnight at 4°C. The cell cycle distribution was determined using a flow cytometer (Beckman Coulter, Brea, CA, USA). Software Flowjo was used to analyze the percentage of cells in the G0/G1, S, and G2/M phases.
Statistical analysis
All quantitative data are expressed as the mean ± SD. Statistical analysis was performed with GraphPad Prism 8 software (GraphPad Software, Inc.). Unpaired Student’s t-test was used to determine the statistical significance of the data between two experimental groups, while one-way ANOVA was used to analyze the significance of multiple group comparisons. Tukey’s post hoc test was performed after ANOVA. All statistical analyses were two-sided, and different cutoff values, (P < 0.05, P < 0.01, P < 0.001), were considered to indicate statistically significant differences. All experiments were repeated at least in triplicate.
Results
MYBL2 expression is high in most cancers
In this study, we first explored the distribution of MYBL2 in normal tissues. At the cellular level, as shown in Fig. S1b, MYBL2 is mainly found in the nucleus; at the tissue level, the Human Protein Atlas (HPA) analysis results indicated that MYBL2 RNA is primarily found in bone marrow, lymphoid tissues and blood and that MYBL2 protein is widely distributed in most tissues (Fig. S1c).
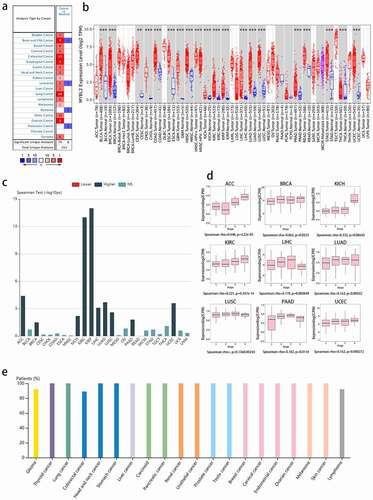
We next explored the differential expression of MYBL2 in normal tissues and cancers. Data from the Oncomine database showed that MYBL2 was significantly overexpressed in brain and central nervous system (CNS) cancer, breast cancer, cervical cancer, colorectal cancer, esophageal cancer, gastric cancer, head and neck cancer, lung cancer, lymphoma, ovarian cancer sarcoma and other cancers. In contrast, in leukemia, myeloma and pancreatic cancer, the expression of MYBL2 was downregulated ()). The results from the TIMER database also indicated that MYBL2 was upregulated in most human cancers compared with normal tissues, such as bladder urothelial carcinoma (BLCA), breast invasive carcinoma (BRCA), cervical squamous cell carcinoma and endocervical adenocarcinoma (CECA), cholangiocarcinoma (CHOL), colon adenocarcinoma (COAD), esophageal carcinoma (ESCA), glioblastoma multiforme (GBM), head and neck squamous cell carcinoma (HNSC), kidney chromophobe (KICH), kidney renal clear cell carcinoma (KIRC), kidney renal papillary cell carcinoma (KIRP), liver hepatocellular carcinoma (LIHC), lung adenocarcinoma (LUAD), lung squamous cell carcinoma (LUSC), prostate adenocarcinoma (PRAD), stomach adenocarcinoma (STAD), thyroid carcinoma (THCA) and uterine corpus endometrial carcinoma (UCEC) (), p < 0.01). Moreover, we added normal tissue data from GTEx as a comparison and used GEPIA to analyze the expression of MYBL2 in adrenocortical carcinoma (ACC), lymphoid neoplasm diffuse large B-cell lymphoma (DLBC), acute myeloid leukemia (LAML), brain lower grade glioma (LGG), ovarian serous cystadenocarcinoma (OV), sarcoma (SARC), skin cutaneous melanoma (SKCM), testicular germ cell tumor (TGCT), thymoma (THYM) and uterine carcinosarcoma (UCS). The results showed that the expression of MYBL2 was upregulated in DLBC, LGG, OV, SARC, SKCM, TGCT, THYM and UCS compared to normal controls; the expression of MYBL2 was downregulated in LAML (P < 0.05), and there was no significant difference in ACC (Fig. S2a).
We also explored the relationship between the expression of MYBL2 and the stage and grade of cancers. The data analysis with the TISDIB tool showed that the expression of MYBL2 was positively correlated with the stage of ACC, KICH, KIRP, LIHC, LUAD, LUSC, uterine corpus endometrial carcinoma (UCEC) (P < 0.001), BRCA (P = 0.0323) and Pancreatic adenocarcinoma (PAAD) (P = 0.0154) () and (d)). On the other hand, the expression of MYBL2 increased with the grade of HNSC, KIRC, LGG, LIHC, PAAD, UCEC (P < 0.001) and OV (P = 0.013) and decreased with the grade of STAD (P < 0.001) (Fig. S2b).
The HPA data helped us understand MYBL2 protein expression in human cancers. The results indicated that the MYBL2 protein was overexpressed in most human cancers ()).
Figure 1. MYBL2 expression in human cancers. (a) MYBL2 differential expression between human cancers and normal tissues in the Oncomine database. (b) MYBL2 expression levels in different cancers from the TCGA database analyzed by TIMER2.0. (c) The correlation between MYBL2 expression and the stage of cancers from the TCGA database analyzed by TISBID. (d) The protein expression level of MYBL2 in different cancer types from the Human Protein Atlas
The impact of MYBL2 on the survival and prognosis of cancer patients
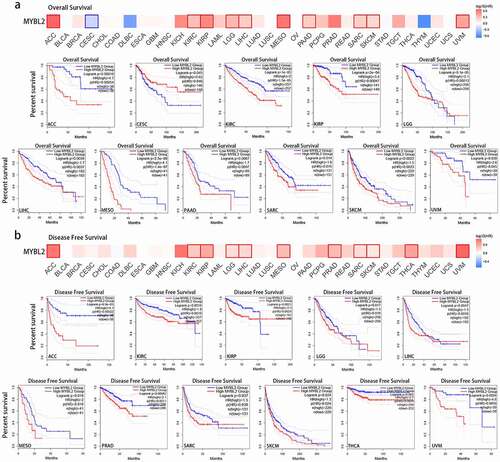
We used the GEPIA database to explore the relationship between the expression of MYBL2 and the survival and prognosis of cancer patients. As shown in ), high expression of MYBL2 was associated with a poor prognosis in terms of overall survival (OS) in ACC, KIRC, KIRP, LGG, LIHC, MESO, PAAD (P < 0.001), SARC (P = 0.015), SKCM (P < 0.001) and UVM (P = 0.045) ()). Disease-free survival (DFS) analysis indicated that the expression of MYBL2 was positively correlated with a poor prognosis in ACC, KIRC, KIRP (P < 0.001), LGG (P = 0.018), LIHC (P < 0.001), mesothelioma (MESO) (P = 0.018), PRAD (P = 0.0011), SARC (P = 0.038), SKCM (P = 0.024), thyroid carcinoma (THCA) and uveal melanoma (UVM) (P < 0.001) ()). Moreover, low expression of MYBL2 was associated with poor prognosis of OS in CESC (P = 0.046).
Figure 2. Correlation between MYBL2 expression and the prognosis of cancer patients in the TCGA. The survival maps and survival curves showing significant differences in overall survival (a) and disease-free survival (b) for different cancer types from the TCGA analyzed by GEPIA
To further explore the influence of MYBL2 expression on the prognosis of cancer patients, we also conducted survival analysis using Kaplan-Meier (KM) plotter in breast cancer, ovarian cancer, lung cancer, gastric cancer and liver cancer. The results showed that high expression of MYBL2 was linked to poor OS, relapse-free survival (RFS), and distant metastasis-free survival (DMFS) in breast cancer (Fig. S3a, P < 0.001). Moreover, high MYBL2 expression was related to poor OS (P < 0.001) and postprogression survival (PPS) (P = 0.011) in ovarian cancer but was not related to progress-free survival (PFS) (p = 0.057) (Fig. S3b). Similarly, in both lung cancer and gastric cancer, high expression of MYBL2 was correlated with OS, first progression (FP) and PPS (Fig. S3c and d, P < 0.05). In liver cancer, the upregulated expression of MYBL2 was significantly associated with poor OS, PFS, RFS and disease-specific survival (DSS) (Fig. S3e, P < 0.001). The above results showed that the expression of MYBL2 was observably positively correlated with short median survival and a poor prognosis for most cancer patients.
Gene mutation analysis of MYBL2 in human cancers
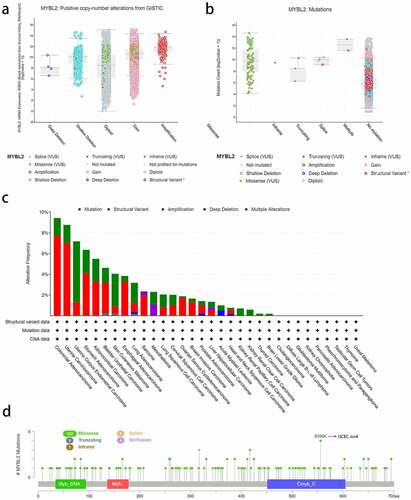
We used the cBioPortal online website to analyze MYBL2 gene mutations in various cancer samples from the TCGA database. We conducted copy number alteration (CNA) analysis to assess the expression of MYBL2. As shown in ), the most common CNA of MYBL2 was amplification, but there were almost no deep deletion alterations. Moreover, missense mutations mainly occurred in diploid and gain-type individuals. Mutation count analysis showed that missense mutations were the most frequent gene alterations ()). We next analyzed MYBL2 gene alterations and CNAs in human cancers. The results indicated that the most frequent MYBL2 gene alteration type is gene mutation, which occurred most often in uterine corpus endometrial carcinoma (~2% frequency). The “amplification” type of CNA was the dominant type in colorectal adenocarcinoma cases, with a frequency of change of approximately 8%. Total gene alterations of MYBL2 are most common in colorectal adenocarcinoma and uterine carcinoma (~9% frequency) ()). ) shows the types, sites and number of cases of MYBL2 genetic alterations. We found that the most altered site was the E556K site in the Cmyb_C domain, where missense mutations were the main occurrence. These alterations were detected in four cases of UCEC ()).
Figure 3. The alteration analysis of MYBL2 by cBioPortal. (a) The correlation between MYBL2 expression and CNA types. (b) The correlation between MYBL2 expression and mutation types. (c) The frequency of MYBL2 gene alterations in different cancer types from the TCGA database. (d) The mutation site is displayed
Tumor mutational burden (TMB) and microsatellite instability (MSI) are two tumor mutation mechanisms associated with immunotherapy [Citation29,Citation30]. In this study, we conducted a correlation analysis of the expression of MYBL2 and TMB and MSI using TCGA data. As shown in Fig. S4, MYBL2 expression was positively correlated with PRAD (P = 0.00023), SKCM (P = 0.0075), KIRC (P = 0.0016), KICH (P = 0.0014), ACC (P = 0.027), and pheochromocytoma and paraganglioma (PCPG) (P = 0.011) and negatively correlated with COAD (P = 0.0066). On the other hand, the correlated analysis of MSI showed that the expression of MYBL2 was positively related to KIRC (P = 0.00038) but negatively related to COAD (P = 4.9E-07) (Fig. S5).
Methylation analysis of MYBL2 in human cancers
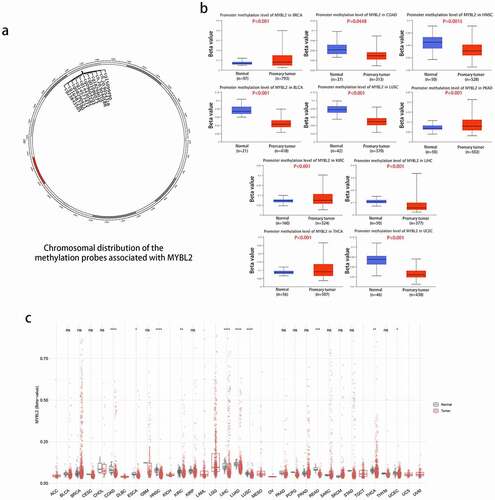
We conducted methylation analysis to investigate the potential association between MYBL2 DNA methylation and the pathogenesis of different tumors. The plot from SMART APP (an interactive web application for comprehensive DNA methylation analysis and visualization) [Citation26] showed the chromosomal distribution of methylation probes associated with MYBL2 ()). The CpG-aggregated methylation analysis of MYBL2 in human cancers indicated that the MYBL2 methylation level was lower in COAD, ESCA, HNSC, KIRC, LIHC, LUAD, LUSC, SKCM, THCA and UCEC tissues than in normal tissues ()). We next explored the promoter methylation level of MYBL2 in different cancers using UALCAN online tools. In all cancer groups with a sample number of at least 20, the promoter methylation level of MYBL2 was lower in COAD (P < 0.0448), HNSC (P = 0.0015), BLCA, LUSC, LIHC and UCEC tissues (P < 0.001) than in normal tissues. In contrast, the promoter methylation level of MYBL2 was higher in BRCA, PRAD, KIRC and THCA (P < 0.001) ()). There was no significant difference in the promoter methylation level in CESC (P = 0.33), CHOL (P = 0.11), ESCA (P = 0.62), GBM (P = 0.46), KIRP (P = 0.46), LUAD (P = 0.88), PCPG (P = 0.64), or THYM (0.92) (Fig. S6a). We also used the MEXPRESS method to study the relationship between the methylation level of MYBL2 and cancer pathology. Interestingly, we found that the promoter methylation level of MYBL2 decreased as the grade of glioma increased. As shown as Fig. S6b, the histogram representing the methylation level of MYBL2 in the promoter areas was significantly lower in GBM than in LGG.
Figure 4. Methylation analysis of MYBL2 in different tumors. (a) Image of the chromosomal distribution of methylation probes associated with MYBL2. (b) The difference in the promoter methylation level of MYBL2 in cancers and normal tissues, which was statistically significant; n was greater than 20. (c) Analysis of CpG-aggregated methylation of MYBL2 in human cancers with SMART
MYBL2 expression is related to immune infiltration in human cancers
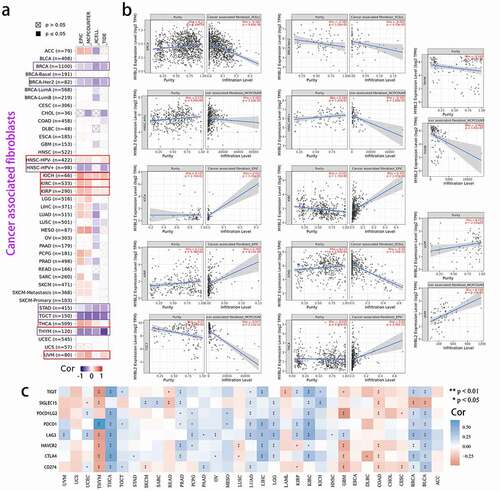
Cancer arises from the accumulation of mutations within cancer cells, but both disease progression and treatment responses are strongly regulated by nonmutated cells in the tumor microenvironment [Citation31]. The study of the immune and tumor microenvironments will be beneficial to the treatment of cancer [Citation32]. Cancer-associated fibroblasts (CAFs) in the stroma of the tumor microenvironment were reported to influence angiogenesis, tumor mechanics, drug access and therapy responses through synthesis and remodeling of the extracellular matrix (ECM) and production of growth factors [Citation33,Citation34]. Herein, we used the TIMER database to explore the association between MYBL2 expression and CAFs through the EPIC, MCPCOUNTER, XCELL and TIDE algorithms using data from the TCGA database. As shown in ), MYBL2 expression was negatively correlated with the estimated infiltration value of cancer-associated fibroblasts for the TCGA tumors of BRCA, BRCA-Her2, HNSC-HPV (+), STAD, TGCT and THYM based on all or most algorithms. In contrast, there was a significant positive correlation for HNSC-HPV (+), KICH, KIRC, KIRP, THCA and UVM tumors. ) clearly shows the correlation between the expression of MYBL2 and the infiltration level. In addition, MYBL2 expression was positively related to CD8+ T cells in BLCA, BRCA, KIRC and THYM cancer based on all or most algorithms from TIMER (Fig. S7a and b).
Furthermore, for reliable immune score evaluation, we use immunedeconv, an R software package that integrates six latest algorithms, including TIMER, xCell, MCPCOUNTER, CIBERSORT, EPIC and quanTIseq, to analyze the data related to immunity in the TCGA [Citation28,Citation35,Citation36]. As shown in Fig. S8, we observed the correlation between MYBL2 expression and various immune cells, such as CD8+ T cells, CD4+ T cells, neutrophils, myeloid dendritic cells, macrophages and B cells. The upregulated expression of immune checkpoint molecules in the tumor microenvironment plays a significant role in antitumor immunity evasion [Citation37]. SIGLEC15, IDO1, CD274, HAVCR2, PDCD1, CTLA4, LAG3 and PDCD1LG2 are transcripts related to immune checkpoints [Citation38]. We extracted the expression values of these 8 genes from the TCGA dataset using the R language and observed the association between the expression of MYBL2 and the expression of immune checkpoint-related genes in human cancers. The results indicated that MYBL2 expression was positively correlated with the expression of immune checkpoint-related genes in BLCA, BRCA, KIRC, LGG, LIHC, LUAD, PRAD and THCA and negatively correlated those in COAD, GBM and THYM ()).
Figure 5. Correlation analysis between MYBL2 expression and cancer-related immune cells. The potential correlation between the expression level of the MYBL2 gene and the infiltration level of cancer-associated fibroblasts based on different algorithms across all types of cancer in the TCGA analyzed by TIMER2.0. Correlation heat maps (a) and some of the correlation curves (b). (c) Heat maps showing the correlations between MYBL2 expression level and the immune checkpoint-related genes SIGLEC15, IDO1, CD274, HAVCR2, PDCD1, CTLA4, LAG3 and PDCD1LG2 plotted with the R language
Functional enrichment analysis showed that MYBL2 was related to spliceosomes, DNA replication and the cell cycle in human cancers
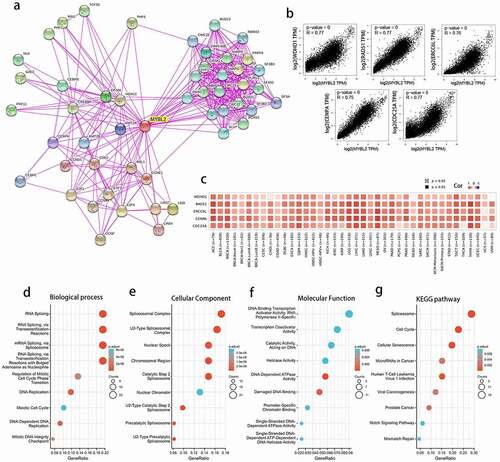
The above results indicated that MYBL2 had a significant association with the prognosis and immune microenvironment of cancers. To further explore the specific molecular mechanism of MYBL2 in human cancers, we conducted a series of pathway enrichment analyses by analyzing the expression-correlated genes. We acquired 50 MYBL2-interacting proteins through STRING tools, and the interactions were all validated experimentally. We generated protein-protein interaction networks (PPIs) ()). Moreover, using the GEPIA tool, we obtained the top 100 genes related to the expression of the MYBL2 gene from the data for 33 human cancers in the TCGA database. We plotted correlation curves and a correlation heat map to show the correlations between the expression level of MYBL2 and those of the top 5 genes among the first 100 genes. As shown in ) and (c), MYBL2 expression was positively correlated with that of the top 5 genes [WDHD1 (R = 0.77), RAD51 (R = 0.77), CDC25A (R = 0.77), ERCC6L (R = 0.76) and CENPA (R = 0.75)].
After removing only one duplicated gene, CCNF, we combined the two datasets to perform Kyoto Encyclopedia of Genes and Genomes (KEGG) and Gene Ontology (GO) enrichment analyses. Biological process analysis showed that MYBL2 may be related to RNA and mRNA splicing, DNA replication and the cell cycle ()). Cellular component analysis indicated that the majority of genes were mainly enriched in several different spliceosomal complexes ()). Molecular function analysis identified that MYBL2 was mainly associated with the activity of some catalysts and enzymes in the DNA replication process ()). Finally, KEGG pathway enrichment analysis suggested that MYBL2 was primarily related to the spliceosome, the cell cycle, cellular senescence, microRNAs in cancer and viral carcinogenesis ()). The above results demonstrated that MYBL2 affects tumor pathogenesis mainly through the spliceosome, DNA replication and the cell cycle.
Figure 6. The related genes and functional enrichment analysis of MYBL2. (a) Protein-protein interaction networks of the available experimentally determined MYBL2-interacting proteins from STRING. We collected the top 100 related genes from GEPIA and obtained the top 5 to plot the correlation curves (b) and correlation heat maps (c). We removed duplicated genes from the two datasets and performed GO analysis (including biological process (d), cellular component (e) and molecular function (f) analysis) and KEGG pathway (g) analysis
MYBL2 regulate the cell cycle and promote the cell proliferation in some cancers
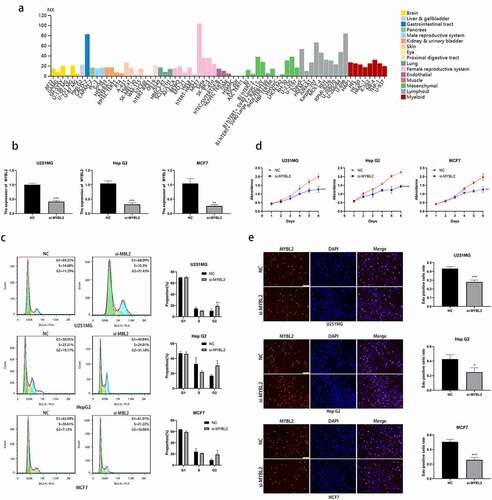
According to our results of KEGG functional enrichment analysis, we found that MYBL2 is involved in spliceosome and the cell cycle. Next, we verified the relationship between MYBL2 and cell cycle in vitro experiment. We selected cancers BRCA, GBM and LIHC with high expression of MYBL2 in TIMER database and corresponding cell lines MCF7, U251MG and HepG2 with high expression of MYBL2 in HPA ()) database for further experiments. We designed and transfected siRNA of MYBL2 into cells and conducted knockdown verification of MYBL2 through qPCR assay ()). Cell cycle assay demonstrated that knockout of MYBL2 led to an increase in cells at the G2/M phase in U251MG, HepG2 and MCF7 ()). Deregulation of the cell cycle underlies the aberrant cell proliferation that characterizes cancer [Citation39,Citation40]. Thus, we conducted proliferation-related phenotypic experiments using three cell lines U251MG, HepG2 and MCF7 to explore the effect of MYBL2 on cancer proliferation. The results of CCK8 assay and EdU assay identified that the knockout of MYBL2 would lead to the decrease of the proliferation ability of U251MG, HepG2 and MCF7 cell () and (e)). In summary, our experimental results indicate that MYBL2 can regulate the cell cycle of cancer and promote the proliferation of tumor cells.
Figure 7. Effect of MYBL2 on cancer cell cycle and proliferation in vitro experiment. (a) The expression level of MYBL2 in different cell lines from HPA database. (b) The U251MG, HepG2 and MCF7 cell lines were transfected with siRNA of MYBL2. Reverse transcription-quantitative PCR was performed to examine the MYBL2 expression level with control and treatment. (c) Cell cycle profile of control and treatment groups of U251MG, HepG2 and MCF7 cells were analyzed by flow cytometry. The histogram shows the proportion of cell percentage. (d) The effect of MYBL2 on proliferation was examined by Cell Counting Kit-8 assay in U251MG, HepG2 and MCF7 cell lines. (e) The effect of MYBL2 on proliferation was examined by 5 – ethynyl – 2 ‘- deoxyuridine (EdU) assay in U251MG, HepG2 and MCF7 cell lines
Discussion
MYBL2 is a transcription factor of the myeloblastosis family of transcription factors and is expressed in all proliferating cells examined [Citation4,Citation7]. Functionally, MYBL2 was found to play a crucial role in the regulation of proliferation and differentiation of proliferating cells and is important in the guidance of cell cycle progression [Citation8]. Tumor-related studies have shown that MYBL2 plays a crucial role in the genesis and progression of multiple tumors. For example, yes-associated protein (YAP) induces the nuclear enrichment of MYBL2 to regulate the cell cycle, which promotes the proliferation of liver cancer [Citation41]. In ovarian cancer, MYBL2 was found to regulate the expression of the downstream gene cell division cycle associated 8 (CDCA8) to mediate the cell cycle process to affect oncogenesis and proliferation [Citation10]. Moreover, in breast cancer, prostate cancer, non-small-cell lung cancer and glioma, MYBL2 was also demonstrated to be a potential biomarker and therapeutic target [Citation42–45]. Although there have been some tumor-related studies on MYBL2, there are still few studies on MYBL2 in tumors, and there is a particular lack of studies on its specific mechanism in tumors. Therefore, the pan-cancer analysis of MYBL2 may contribute to advancing the broader study of MYBL2 in multiple cancers. In this study, we conducted a comprehensive analysis, including gene expression, clinical prognosis, genetic alteration, DNA methylation, immune infiltration level and functional enrichment analysis, of MYBL2 based on 33 different tumor datasets from the TCGA and GEO databases.
Gene expression analysis of the Oncomine and TIMER2.0 databases identified that MYBL2 was more highly expressed in most cancers than in normal tissues. The survival prognosis analysis of MYBL2 indicated a consistent conclusion. The results of survival analysis with GEPIA tools showed that high expression of MYBL2 was positively correlated with a poor prognosis in terms of OS in the urinary system cancers ACC, KIRC and KIRP. Moreover, MYBL2 was highly expressed in the urinary system cancers BLCA, KIRC and KIRP. For breast cancer, liver cancer and gastric cancer, the results of TIMER gene expression analysis and KM plotter survival analysis showed that MYBL2 may be an oncogene and adverse prognosis factor. Among respiratory system tumors, LUAD and LUSC showed upregulated MYBL2 expression, and this upregulation was related to a poor prognosis in terms of OS, FP and PPS in lung cancer. Moreover, MYBL2 may be related to oncogenesis and proliferation in LGG based on the results of the gene expression analysis and survival analysis from GEPIA. For tumors of the genital system, MYBL2 was highly expressed in CESC, OV, TGCT, UCEC and UCS; however, high expression of MYBL2 was only positively related to a poor prognosis for OV. The above results of gene expression analysis and survival analysis showed that MYBL2 may be a tumor-related factor significantly related to the genesis and progression of cancers of the urinary system, digestive system, respiratory system and nervous system. Further experiments are necessary to explore whether MYBL2 plays a role in these cancer types and to clarify the mechanism.
We explored the alteration of MYBL2 in cancers and also assessed MSI and TMB. First, on the cBioPortal website, we observed that the most frequent alteration type was missense mutation and that the most frequent CNA type was amplification. The most common cancer with MYBL2 gene alteration was colorectal adenocarcinoma, and the most common altered site in the MYBL2 gene was E556K. Moreover, TMB and MSI are two important tumor mutation mechanisms associated with the immunotherapy response [Citation29,Citation30]. Because of the specificity of TMB and MSI for immunotherapy, they are used to define subtypes for many cancer types. In general, cancers with high TMB or MSI have a better prognosis and are more significantly associated with the response to immunotherapy than low-TMB or microsatellite stability types [Citation46–49]. In this study, we used the SangerBox website to analyze the correlation between MYBL2 expression and TMB and MSI in 33 cancers from the TCGA. We found that MYBL2 expression was positively correlated with TMB in PRAD, SKCM, KIRC, KICH, ACC and PCPG and with MSI in KIRC. In COAD, MYBL2 expression was negatively correlated with both TMB and MSI. These findings may mean that MYBL2 can promote the response to immunotherapy in some cancers, but in COAD, MYBL2 may restrain the response to immunotherapy.
DNA methylation abnormalities are considered to be a critical event in the development and progression of cancer [Citation50]. Compared with normal cells of the same tissue type, there were two general changes in DNA methylation: demethylation within many regions of the genome and de novo methylation of select CpG islands [Citation51]. DNA methylation often represents a molecular mechanism involved in gene suppression; thus, it was thought that de novo modification in cancer may contribute to the development of a tumor phenotype by inhibiting cancer-associated genes [Citation52,Citation53]. In this study, we conducted methylation analysis of MYBL2 in cancers through the UALCAN, SMART and MEXPRESS websites. The CpG-aggregated methylation analysis of MYBL2 in human cancers indicated that the MYBL2 methylation level was lower in COAD, ESCA, HNSC, KIRC, LIHC, LUAD, LUSC, SKCM, THCA and UCEC cancer tissues than in normal tissues. However, the promoter methylation level of MYBL2 had a different result. The UALCAN results indicated that the promoter methylation level of MYBL2 was lower in COAD, HNSC, BLCA, LUSC, LIHC and UCEC cancer tissues than in normal tissues and higher in BRCA, PRAD, KIRC and THCA cancer tissues. The above results revealed that MYBL2 may be able to regulate some tumors at the epigenetic level, but further experiments are needed to verify the deeper and more detailed mechanism.
Most tumor cells express antigens that can mediate recognition by host CD8(+) T cells. Cancers that are detected clinically must have evaded antitumor immune responses to grow progressively [Citation54]. Studying the relationship between cancer-associated genes and immune cells is helpful for us to understand the changes in the tumor immune microenvironment. In this study, we mainly explored the correlation between MYBL2 expression and CAFs, immune checkpoint-associated cells and various human immune cells through the TIMER2.0 website and R software. MYBL2 expression was negatively correlated with the estimated infiltration value of CAFs for BRCA, BRCA-Her2, HNSC-HPV (+), STAD, TGCT and THYM and positively correlated with HNSC-HPV (+), KICH, KIRC, KIRP, THCA and UVM in the TCGA analysis. MYBL2 regulate CAFs to influence the tumor microenvironment and regulate tumor progression. The antitumor immune evasion of cancer is an essential and critical step in cancer genesis, and the regulation of immune checkpoint molecules plays a crucial role in this process [Citation37]. We analyzed the correlation between MYBL2 expression and the expression of some important immune checkpoint-associated genes. The results demonstrated that MYBL2 expression was positively correlated with the expression of most immune checkpoint-related genes in BLCA, BRCA, KIRC, LGG, LIHC, LUAD, PRAD and THCA and negatively correlated with that in COAD, GBM and THYM cancer. These conclusions may suggest that in some tumors, MYBL2 can promote tumor cell resistance and antitumor immune escape by regulating the expression of immune checkpoint-associated genes to promote the occurrence and development of tumors.
Functional research has always been the focus of cancer-related gene research. In this study, by collecting and integrating 50 MYBL2-interacting proteins in STRING and 100 MYBL2-related genes in GEPIA, we obtained 149 different MYBL2-related genes and conducted functional enrichment analysis to explore the potential functional mechanism of MYBL2 in cancer. The results identified that MYBL2 most likely affects tumor pathogenesis mainly through the spliceosome, DNA replication and the cell cycle.
Moreover, some of the results of functional analysis were verified experimentally. We selected cancers BRCA, GBM and LIHC with high expression of MYBL2 in TIMER database and corresponding cell lines MCF7, U251MG and HepG2 with high expression of MYBL2 in HPA database. The results of cell cycle analysis demonstrated that MYBL2 can regulate the cell cycle of cancer cells and the results of CCK8 and EdU assays showed that MYBL2 can promote the proliferation of cancer cells.
Bioinformatics is a hot research tool in the field of biology that can provide evidence for many studies at the level of big data. The increasing number of online analysis websites also makes the threshold of this research method lower and the content of research more extensive than studies with other approaches. This study aimed to use various bioinformatics tools to conduct a comprehensive analysis of the role of MYBL2 across cancers and carried out some experimental verification on this basic. Our above experimental results proved that MYBL2 may be an oncogene in many cancers that can regulate the phenotype of cancer from the aspects of immunotherapy, epigenetics, immune infiltration and so on and promote the occurrence and development of cancer. And in vitro experiment results showed that MYBL2 can regulate the cell cycle of cancer and promote the proliferation of tumor cells. However, our conclusions are only based on bioinformatics analysis and a small amount of functional verification in GBM, BRCA and LIHC. More experiments are necessary to verify our results, especially immunotherapy, immune infiltration and epigenetics related experiments to further explore the detailed molecular mechanism of MYBL2 in cancer.
Author contributions
Xingjie Chen, Yalin Lu and Hao Yu contributed equally to this study. All authors read and approved the final manuscript.
Supplemental Material
Download Zip (10.4 MB)Disclosure statement
The authors declare that they have no competing interests, and all authors should confirm its accuracy.
Supplementary material
Supplemental data for this article can be accessed here
Additional information
Funding
Related Research Data
References
- Blum A, Wang P, Zenklusen JC. SnapShot: TCGA-analyzed tumors. Cell. 2018;173(2):530. Cited in: PubMed; PMID 29625059.
- Tomczak K, Czerwińska P, Wiznerowicz M. The Cancer Genome Atlas (TCGA): an immeasurable source of knowledge. Contemp Oncol (Pozn). 2015;19(1A):A68–77. Cited in: PubMed; PMID 25691825.
- Clough E, Barrett T. The gene expression omnibus database. Methods Mol Biol. 2016; 141893. Cited in: PubMed; PMID 27008011. DOI: https://doi.org/10.1007/978-1-4939-3578-9_5
- Oh IH, Reddy EP. The myb gene family in cell growth, differentiation and apoptosis. Oncogene. 1999;18(19):3017–3033. Cited in: PubMed; PMID 10378697.
- Chayka O, Sala A. MYBL2 (v-myb myeloblastosis viral oncogene homolog (avian)-like 2). Atlas Genet Cytogenet OncolHaematol. 2011;(9). DOI:https://doi.org/10.4267/2042/44558.
- Lu S, Wang J, Chitsaz F, et al. CDD/SPARCLE: the conserved domain database in 2020. Nucleic Acids Res. 2020;48(D1):D265–D268. Cited in: PubMed; PMID 31777944.
- Papetti M, Augenlicht LH. MYBL2, a link between proliferation and differentiation in maturing colon epithelial cells. J Cell Physiol. 2011;226(3):785–791. Cited in: PubMed; PMID 20857481.
- Musa J, Aynaud -M-M, Mirabeau O, et al. MYBL2 (B-Myb): a central regulator of cell proliferation, cell survival and differentiation involved in tumorigenesis. Cell Death Dis. 2017;8(6):e2895. Cited in: PubMed; PMID 28640249.
- Mao X, Orchard G, Lillington DM, et al. Amplification and overexpression of JUNB is associated with primary cutaneous T-cell lymphomas. Blood. 2003;101(4):1513–1519. Cited in: PubMed; PMID 12393503.
- Qi G, Zhang C, Ma H, et al. CDCA8, targeted by MYBL2, promotes malignant progression and olaparib insensitivity in ovarian cancer. Am J Cancer Res. 2021;11(2):389–415. Cited in: PubMed; PMID 33575078.
- Guan Z, Cheng W, Huang D, et al. High MYBL2 expression and transcription regulatory activity is associated with poor overall survival in patients with hepatocellular carcinoma. Curr Res Transl Med. 2018;66(1):27–32. Cited in: PubMed; PMID 29274707.
- Chen J, Chen X. MYBL2 is targeted by miR-143-3p and regulates breast cancer cell proliferation and apoptosis. Oncol Res. 2018;26(6):913–922. Cited in: PubMed; PMID 29268817.
- Skotheim RI, Monni O, Mousses S, et al. New insights into testicular germ cell tumorigenesis from gene expression profiling. Cancer Res. 2002;62(8):2359–2364. Cited in: PubMed; PMID 11956097.
- Li Q, Wang M, Hu Y, et al. MYBL2 disrupts the Hippo-YAP pathway and confers castration resistance and metastatic potential in prostate cancer. Theranostics. 2021;11(12):5794–5812. Cited in: PubMed; PMID 33897882.
- Ahmed F. Integrated network analysis reveals FOXM1 and MYBL2 as key regulators of cell proliferation in non-small cell lung cancer. Front Oncol. 2019; 91011. Cited in: PubMed; PMID 31681566. DOI: https://doi.org/10.3389/fonc.2019.01011
- Bayley R, Ward C, Garcia P. MYBL2 amplification in breast cancer: molecular mechanisms and therapeutic potential. Biochim Biophys Acta Rev Cancer. 2020;1874(2):188407. Cited in: PubMed; PMID 32853735.
- Li M, Liu Y, Liu J, et al. Circ_0006332 promotes growth and progression of bladder cancer by modulating MYBL2 expression via miR-143. Aging (Albany NY). 2019;11(22):10626–10643. Cited in: PubMed; PMID 31756170.
- Wei T, Weiler SME, Tóth M, et al. YAP-dependent induction of UHMK1 supports nuclear enrichment of the oncogene MYBL2 and proliferation in liver cancer cells. Oncogene. 2019;38(27):5541–5550. Cited in: PubMed; PMID 30936457.
- Rhodes DR, Kalyana-Sundaram S, Mahavisno V, et al. Oncomine 3.0: genes, pathways, and networks in a collection of 18,000 cancer gene expression profiles. Neoplasia. 2007;9(2):166–180. Cited in: PubMed; PMID 17356713.
- Li T, Fan J, Wang B, et al. TIMER: a web server for comprehensive analysis of tumor-infiltrating immune cells. Cancer Res. 2017;77(21):e108–e110. Cited in: PubMed; PMID 29092952.
- Tang Z, Li C, Kang B, et al. GEPIA: a web server for cancer and normal gene expression profiling and interactive analyses. Nucleic Acids Res. 2017;45(W1):W98–W102. Cited in: PubMed; PMID 28407145.
- Ru B, Wong CN, Tong Y, et al. TISIDB: an integrated repository portal for tumor-immune system interactions. Bioinformatics. 2019;35(20):4200–4202. Cited in: PubMed; PMID 30903160.
- Cerami E, Gao J, Dogrusoz U, et al. The cBio cancer genomics portal: an open platform for exploring multidimensional cancer genomics data. Cancer Discov. 2012;2(5):401–404. Cited in: PubMed; PMID 22588877.
- Gao J, Aksoy BA, Dogrusoz U, et al. Integrative analysis of complex cancer genomics and clinical profiles using the cBioPortal. Sci Signal. 2013;6(269):l1. Cited in: PubMed; PMID 23550210.
- Chandrashekar DS, Bashel B, Balasubramanya SAH, et al. UALCAN: a portal for facilitating tumor subgroup gene expression and survival analyses. Neoplasia. 2017;19(8):649–658. Cited in: PubMed; PMID 28732212.
- Li Y, Di G, Lu C. The SMART App: an interactive web application for comprehensive DNA methylation analysis and visualization. Epigenetics Chromatin. 2019;12(1):71. Cited in: PubMed; PMID 31805986.
- Koch A, Jeschke J, Van Criekinge W, et al. MEXPRESS update 2019. Nucleic Acids Res. 2019;47(W1):W561–W565. Cited in: PubMed; PMID 31114869.
- Sturm G, Finotello F, List M. Immunedeconv: an R package for unified access to computational methods for estimating immune cell fractions from bulk RNA-sequencing data. Methods Mol Biol. 2020; 2120223–2120232. Cited in: PubMed; PMID 32124323. DOI: https://doi.org/10.1007/978-1-0716-0327-7_16
- Chalmers ZR, Connelly CF, Fabrizio D, et al. Analysis of 100,000 human cancer genomes reveals the landscape of tumor mutational burden. Genome Med. 2017;9(1):34. Cited in: PubMed; PMID 28420421.
- Luchini C, Brosens LAA, Wood LD, et al. Comprehensive characterisation of pancreatic ductal adenocarcinoma with microsatellite instability: histology, molecular pathology and clinical implications. Gut. 2021;70(1):148–156. Cited in: PubMed; PMID 32350089.
- Sahai E, Astsaturov I, Cukierman E, et al. A framework for advancing our understanding of cancer-associated fibroblasts. Nat Rev Cancer. 2020;20(3):174–186. Cited in: PubMed; PMID 31980749.
- Fridman WH, Galon J, Dieu-Nosjean M-C, et al. Immune infiltration in human cancer: prognostic significance and disease control. Curr Top Microbiol Immunol. 2011; 3441. Cited in: PubMed; PMID 20512556. DOI: https://doi.org/10.1007/82_2010_46
- Kalluri R, Zeisberg M. Fibroblasts in cancer. Nat Rev Cancer. 2006;6(5):392–401. Cited in: PubMed; PMID 16572188.
- Chen X, Song E. Turning foes to friends: targeting cancer-associated fibroblasts. Nat Rev Drug Discov. 2019;18(2):99–115. Cited in: PubMed; PMID 30470818.
- Aran D, Hu Z, Butte AJ. xCell: digitally portraying the tissue cellular heterogeneity landscape. Genome Biol. 2017;18(1):220. Cited in: PubMed; PMID 29141660.
- Li T, Fu J, Zeng Z, et al. TIMER2.0 for analysis of tumor-infiltrating immune cells. Nucleic Acids Res. 2020;48(W1):W509–W514. Cited in: PubMed; PMID 32442275.
- Barroso-Sousa R, Barry WT, Garrido-Castro AC, et al. Incidence of endocrine dysfunction following the use of different immune checkpoint inhibitor regimens: a systematic review and meta-analysis. JAMA Oncol. 2018;4(2):173–182. Cited in: PubMed; PMID 28973656.
- Wang J, Sun J, Liu LN, et al. Siglec-15 as an immune suppressor and potential target for normalization cancer immunotherapy. Nat Med. 2019;25(4):656–666. Cited in: PubMed; PMID 30833750.
- Evan GI, Vousden KH. Proliferation, cell cycle and apoptosis in cancer. Nature. 2001;411(6835):342–348. Cited in: PubMed; PMID 11357141.
- Williams GH, Stoeber K. The cell cycle and cancer. J Pathol. 2012;226(2):352–364. Cited in: PubMed; PMID 21990031
- Wei T, Weiler SME, Tóth M, et al. YAP-dependent induction of UHMK1 supports nuclear enrichment of the oncogene MYBL2 and proliferation in liver cancer cells. Oncogene. 2019;38(27):5541–5550. Cited in: PubMed; PMID 30936457
- Bayley R, Ward C, Garcia P. MYBL2 amplification in breast cancer: molecular mechanisms and therapeutic potential. Biochim Biophys Acta Rev Cancer. 2020;1874(2):188407. Cited in: PubMed; PMID 32853735.
- Li Q, Wang M, Hu Y, et al. MYBL2 disrupts the Hippo-YAP pathway and confers castration resistance and metastatic potential in prostate cancer. Theranostics. 2021;11(12):5794–5812. Cited in: PubMed; PMID 33897882.
- Jin Y, Zhu H, Cai W, et al. B-Myb is up-regulated and promotes cell growth and motility in non-small cell lung cancer. Int J Mol Sci. 2017;18(6): Cited in: PubMed; PMID 28555007. DOI:https://doi.org/10.3390/ijms18060860.
- Zhang X, Lv Q-L, Huang Y-T, et al. Akt/FoxM1 signaling pathway-mediated upregulation of MYBL2 promotes progression of human glioma. J Exp Clin Cancer Res. 2017;36(1):105. Cited in: PubMed; PMID 28784180.
- Yarchoan M, Hopkins A, Jaffee EM. Tumor mutational burden and response rate to PD-1 inhibition. N Engl J Med. 2017;377(25):2500–2501. Cited in: PubMed; PMID 29262275.
- Chalmers ZR, Connelly CF, Fabrizio D, et al. Analysis of 100,000 human cancer genomes reveals the landscape of tumor mutational burden. Genome Med. 2017;9(1):34. Cited in: PubMed; PMID 28420421.
- Ratti M, Lampis A, Hahne JC, et al. Microsatellite instability in gastric cancer: molecular bases, clinical perspectives, and new treatment approaches. Cell Mol Life Sci. 2018;75(22):4151–4162. Cited in: PubMed; PMID 30173350.
- Vilar E, Gruber SB. Microsatellite instability in colorectal cancer-the stable evidence. Nat Rev Clin Oncol. 2010;7(3):153–162. Cited in: PubMed; PMID 20142816.
- Wang J, Yang J, Li D, et al. Technologies for targeting DNA methylation modifications: basic mechanism and potential application in cancer. Biochim Biophys Acta Rev Cancer. 2021;1875(1):188454. Cited in: PubMed; PMID 33075468.
- Klutstein M, Nejman D, Greenfield R, et al. DNA methylation in cancer and aging. Cancer Res. 2016;76(12):3446–3450. Cited in: PubMed; PMID 27256564.
- Fang M, Ou J, Hutchinson L, et al. The BRAF oncoprotein functions through the transcriptional repressor MAFG to mediate the CpG Island methylator phenotype. Mol Cell. 2014;55(6):904–915. Cited in: PubMed; PMID 25219500.
- Keshet I, Schlesinger Y, Farkash S, et al. Evidence for an instructive mechanism of de novo methylation in cancer cells. Nat Genet. 2006;38(2):149–153. Cited in: PubMed; PMID 16444255.
- Gajewski TF, Schreiber H, Fu Y-X. Innate and adaptive immune cells in the tumor microenvironment. Nat Immunol. 2013;14(10):1014–1022. Cited in: PubMed; PMID 24048123.