
ABSTRACT
The transcription factor p53 has been shown to control the differentiation process of the mesenchymal stem cells (MSCs). As a matter of fact, in vivo p53 loss leads to an unbalance between bone formation versus bone erosion. Using as experimental system, human bone marrow-derived MSCs and mouse bone marrow-derived TAp63-/- MSCs, we have asked whether the other members of the p53 family, p63 and p73, are involved in controlling MSCs osteogenic differentiation. Our results indicate that both during human and mouse MSC-induced osteogenic differentiation, TAp63 isoforms are mainly upregulated in comparison with p73 isoforms. In addition, MSCs derived from TAp63 knock-out mice show delayed osteogenic differentiation. Interestingly, we found that, in contrast to p53, TAp63 trascriptionally regulates osteoprotegerin (OPG or TNFRSF11B) important for bone remodeling and osteoclastogenesis inhibition throughout the RANKL/RANK/OPG pathway. Analysis of the expression of p63 and OPG in breast cancer, which is one of the most common human cancers that metastatizes to bone, showed that p63/OPG pathway is deregulated and that a higher expression of both p63 and OPG is associated with a better patient survival, suggesting that p63/OPG axis may be further investigated as clinical biomarker for breast cancer metastasis.
Abbreviations
MSC, mesenchymal stem cells; OPG, osteoprotegerin; RUNX2, Run-trelated transcription factor 2
Introduction
Osteogenic differentiation is the biological process by which bone is formed and growth. Two key cells, osteoblasts and osteoclasts, are involved in bone turnover. In particular, osteoblasts are cells that generating bone, whereas osteoclasts are cells that degrading bone. To safeguard the proper bone formation, it is necessary that osteoblasts and osteoclasts generate and resorb the same mass of bone[Citation1]. This process of bone remodeling is tightly regulated by cellular and molecular mechanisms [Citation2]. In particular, osteoblasts arises from osteogenic differentiation of mesenchymal stem cells (MSCs) as a result of a process modulated in different steps. Indeed, several molecules, including parathyroid hormone, calcitonin, vitamin D, growth hormone, steroids, cytokines, and growth factors (for example, the Macrophage Colony-Stimulating Factor, the Receptor Activator of Nuclear kB Ligand, the Vascular Endothelial Growth Factor, the Interleukin-6 family) are invoved in bone remodeling. In pathological condition such as cancer, disfunction of osteoblasts and osteoclasts also play an active role [Citation3,Citation4]. For instance, osteoclasts have an important role in primary bone tumors and bone metastasis [Citation5–7]. Osteoclasts are also present in undifferentiated carcinomas of different organs, especially pancreas, thyroid, bladder, ovary [Citation8–12]. Furthermore, they play an active role in the tumor progression in primary and metastatic tumor, in epithelial-mesenchymal transition and cancer stem cell [Citation8,Citation13].
At molecular levels two main molecular pathways, bone morphogenetic proteins (BMP) [Citation14] and WNT [Citation15] are implicated in osteogeneis. BMPs binds their specific receptors and activate SMAD intracellular proteins. SMAD proteins in turn control the expression of Run-trelated transcription factor 2 (RUNX2), the master transcription factor in regulating the differentiation of MSCs toward osteoblasts fate. A second molecular pathway involved in the regulation of osteogenesis is the WNT signaling [Citation16]. In detail, the canonical WNT has double function. It acts by either inhibiting or inducing osteoblast formation in relationship to the degree of differentiation of the progenitor cells, and it controls bone resorption by increasing the osteoprotegerin (OPG also knonwn as TNFRSF11B)/RANKL ratio [Citation17]. Therefore, the OPG/RANKL/RANK axis has crucial role in the regulation of bone remodeling. OPG, also known as TNFRSF11B, belongs to the TNF receptor superfamily and is a soluble decoy receptor that functions as a negative regulator of bone resorption [Citation18]. In particular, OPG by binding its ligand RANKL, prevents RANK/RANKL interaction and consequently inhibits osteoclastogenesis. Moreover, OPG can also bind TRAIL and inhibits TRAIL/TRAIL-receptor, and this results in the inhibition of apoptosis. Mice with genetic deletion of OPG exhibtis severe osteoporosis and vascular calcification indicating that OPG is a physiological regulator of bone resorption [Citation19].
P53 family consists of three transcription factors (p53, p63 and p73) that play a key role in the regulation of several biological processes including cell survival and proliferation, cellular differentiation, and metabolism [Citation19–26]. Of relevance, there are several experimental evidences that the tumor suppressor gene p53 plays an important role as a negative regulator of osteogenesis and osteoblast differentiation by directly repressing the expression of osterix. Indeed, osteloblast derived from p53-/- mice show elevated levels of osterix, and this is associated with an increased bone mass formation [Citation27,Citation28]. Moreover, we have recently shown that p53 by negatively regulating OPG expression modulates MSC osteogenic differentiation [Citation29]. In particular, the selective deletion of p53 in MSCs resulted in the upregulation of OPG levels both in vitro and in vivo. In this scenario, we have asked whether the other members of the p53 family (p63 and p73) participate to the regulation of MSC osteogenic differentiation. Here, we show that TAp63 in contrast to p53, positively regulates the expression of OPG. In agreement, BM-MSCs derived from TAp63 knock-out mice show altered osteogenic differentiation. More importantly, we have previously shown that high level of OPG is correlated with a poor prognosis in both prostate cancer and osteosarcoma [Citation29]. In a prostate metastasis model, impaired p53 expression can promote Opg expression, and enhance bone density. Here, we have extended our previous findings by analyzing the expression of p63 and OPG in breast cancer, which is together with prostate cancer, one of the most common human cancers that metastatizes to bone [Citation30–32]. Our observations indicate that the molecular pathway p63/OPG is deregulated in breast cancer and a higher expression of both p63 and OPG is associated with a better patient survival.
Methods
Animal studies
TAp63−/− mice strain was generated by Prof. Daniel Aberdam laboratory. Mice were generated in the C57Bl6 background. The mice were bred in house in standard conditions (controlled temperature, 12 h light/darck cycle, free access to food and water). The experiments were approved by the Institutional Animal Care and Use Committee (IACUC) and were carried out according to the Italian and European rules (D.L.116/92; C.E. 609/86; European Directive 2010/63/EU). For mice experiments license n° 817/2016PR (Italian Ministry of Health).
Human mesenchymal stem cells culture and osteogenic differentiation
StemPro BM Mesenchymal Stem Cells were purchased from Gibco (Thermo Fisher, Waltham, MA, USA). They were isolated from human bone marrow and expanded under hypoxic (3–5% O2) conditions. Before cryopreservation at passage 4, cells were tested for expression of cell surface markers indicative of MSC (CD73+, CD90+, CD105+, CD166+) and their ability to differentiate into osteocytes, adipocytes, and chondrocytes. and cultured according to manufacturer’s protocol. Briefly, celle were thawed and cultured in StemPro MSC SFM Basal Medium supplemented with StemPro MSC SFM XenoFree Supplement and GlutaMAX-I CTS supplement (Thermo Fisher, Waltham, MA, USA) in a 37°C incubator with a humidified atmosphere of 5% CO2. Cell culture medium was replaced every 2 days till 60–90% confluency, then cells were subcultured as needed on vessel coated with CELLstart™ CTS™ substrate (Thermo Fisher, Waltham, MA, USA).
At passage 4–6 cells were seed at 5 × 10³ cells/cm [Citation2] density and cultured till 80–90% confluency. Then, they were stimulated to differentiate by StemPro® Osteocyte/Chondrocyte Differentiation Basal Medium supplemented with StemPro® Osteogenesis Supplement (Thermo Fisher, Waltham, MA, USA) replacing medium every 3–4 days.
Differentiation process was evaluated by Alizarin Red staining. Briefly medium was removed from 12-well plates, cells were rinsed with PBS, fixed by 4% formaldeyde solution for 30 min, washed twice with distilled water, stained with 2% Alizarin Red S solution (pH 4.2) for 2–3 min, rinsed three times with distilled water and finally visualized under light microscope.
Mouse mesenchymal stem cells culture, immunotypization and and osteogenic differentiation
Four to eight weeks old male mice were sacrified and put on ice, femurs and tibias were isolated removing completely muscles and tendons and washed with 2% FBS 1 mM EDTA in PBS. Then, bones ends were cut and bone marrow was flushed out pushing complete culture medium (MesenCult Expansion Kit, StemCell Technologies, Vancouver, Canada) into the cavities of bones by a syringe (23 cc needle). Bone marrow-derived cells were centrifuged 10 min at 300xg, supernatant was discarded, cell pellet was resuspended in complete culture medium and put in culture for MSC expansion. The isolated MSC grown in culture were immunotypized by immunostaining followed by FACS analysis. Briefly, cells were washed twice with 5% FBS in PBS, then aspecific antigen blocking was performed at 4°C with 5% FBS in PBS for 30 min, antibodies were diluted (1:100) in 100 µl of blocking buffer and the staining was performed at 4°C for 1 h. After staining cells were washed twice and analyzed by FACS (CytoFLEX, Beckman Coulter, Milano, Italia). 15,000 events were acquired. Antibodies used for immunization were as follows: FITC Hamster Anti-Mouse CD11c (HL3; cat 561,045); FITC Rat Anti-Mouse Ly-6A/E (D7; cat 562,058; PE Rat Anti-Mouse CD140A (APA5; cat 562,776); PE Rat Anti-Mouse CD44 (IM7; cat 561,860) (BD Pharmingen, Franklin Lakes, New Jersey, USA). At passage 2–4, murine MSC were seeded at 5 × 10⁴ cells/cm [Citation2] density and cultured till 90% confluency, then they were stimulated to differentiate by MesenCult Osteogenic Stimulatory Kit (StemCell Technologies, Vancouver, Canada) replacing medium every 2–3 days. Differentiation process was evaluated by Alizarin Red staining as described before.
Cell cultures, transfections, and luciferase assays
H1299 cell lines were grown in Dulbecco’s modified Eagle’s medium (Thermo Fisher, Waltham, MA, USA) supplemented with 10% FBS (Thermo Fisher, Waltham, MA, USA) and 1% penicillin/streptomycin (Thermo Fisher, Waltham, MA, USA) at 37°C in a humidified atmosphere of 5% CO2 in air. A total of 1.2 × 10⁵ H1299 cells were seeded in 12-well dishes 24 h before transfection. A total of 100ng of pGL3 vector, 300 ng of transactivators expression vectors and 10ng of Renilla luciferase pRL-CMV vector (Promega, Madison, WI, USA) were cotransfected using Effectene Reagent (Qiagen, Hilden, Germany) according to the manufacturer’s protocol. pGl3 vector containing the putative p63 responsive element found in OPG gene was generated by standard cloning strategy. Responsive element fragment was amplified by PCR from human genomic DNA, cloned into pGL3basic vector (Promega, Madison, WI, USA) and completely sequenced. Primers used for PCR are listed in Supplementary Table 3. Relative luciferase activities were measured 24 h after transfection using a Dual Luciferase Reporter Assay System (Promega, Madison, WI, USA). Light emission was measured over 10 s using a Lumat LB9507 luminometer (EG&G Berthold, Wildbad, Germany). The efficiency of transfection was normalized to Renilla luciferase activity.
RNA extraction and Real-Time PCR analysis
Total RNA was isolated by RNeasy Mini Kit (Qiagen, Hilden, Germany) according to manufacturer protocol and quantified by spectrophotometric analysis. 100ng of total RNA was used for reverse transcription using SuperScript VILO cDNA Synthesis Kit (Thermo Fisher, Waltham, MA, USA) according to manufacturer’s instructions. The obtained cDNA (20 μl) was diluted 1:5 and used as template for Real Time qPCR. Real Time qPCR was performed in triplicate in 25 μl final volume/well using GoTaq qPCR Master Mix (Promega, Madison, WI, USA), 2 μl of diluted cDNA and primers at a final concentration of 0.4 μM. Primers used are listed in Supplementary Table 1. Real Time qPCR was performed following this amplification file: one cycle of 3 min at 95°C, and 40 cycles of 20 s at 95°C and 60 s at 58°C. Real Time qPCR reaction was followed by a melting curve protocol according to the specification of the ABI 7500 instrument (Thermo Fisher, Waltham, MA, USA). The expression of each gene was defined from the threshold cycle (Ct), and the relative expression levels were calculated by using the 2−ΔΔCt method after normalization with reference to expression of β-actin as housekeeping gene.
Endpoint semiquantitative PCR were performed using GoTaq polymerase (Promega, Madison, WI, USA) according to manufacturer’s protocol. Primers used are listed in Supplementary Table S1 and S2.
Western blotting
Cell extracts were r.esolved on SDS polyacrylamide gels and blotted onto Hybond P, PVDF membrane (GE Healtcare Chicago, IL, USA). Membranes were blocked with PBST 5% nonfat dry milk, incubated with primary antibodies for 2 h at room temperature, washed and hybridized with peroxidase conjugated secondary antibodies for 1 h at room temperature (goat anti-rabbit or goat anti-mouse, Biorad Hercules, CA, USA). Detection was performed with the ECL chemiluminescence kit (Perkin Elmer, Waltham, MA, USA) The antibodies used were: anti-OPG (Santa Cruz Biotechnogies, 1:500) and anti-βactin (AC-15, Sigma, St. Louis, MO, USA; 1/5000).
Bioinformatic analysis
Gene expression analysis of both p63 and OPG in normal, tumor and metastatic tisseus has been performed using the website https://tnmplot.com/analysis/. The tool utilizes data generated by either gene arrays from the Gene Expression Omnibus of the National Center for Biotechnology Information (NCBI-GEO) or RNA-seq from The Cancer Genome Atlas (TCGA), Therapeutically Applicable Research to Generate Effective Treatments (TARGET), and The Genotype-Tissue Expression (GTEx) repositories [Citation33]. Correlation analysis (p63 versus OPG expression) was carried out by using the following website: http://www.cbioportal.org [Citation34,Citation35]. Kaplan-Meier curves were generated by using the website http://kmplot.com/analysis/ [Citation36,Citation37]. The following probes has been used: Probe Id (Gene symbol): 207382_at (TP63), 211194_s_at (TP63), 211834_s_at (TP63), 211195_s_at (TP63), 204932_at (OPG), 204933_s_at (TNFRSF11B). The mean expression of the selected probes has been calculated and used.
Statistics
Data are shown as individual values ± Standard Deviation (SD). Experimental results significance was evaluated by Student’s t-test as expression of p-value (p) <0.05. p-values were calculated in two tailed unpaired Student’s t-test using GraphPad software (https://www.graphpad.com/quickcalcs/ttest1/?Format=SD). Comparison of the normal and the tumorous samples was performed by the Mann–Whitney U test, and matched tissues with adjacent samples were compared using the Wilcoxon test. Normal, tumorous and metastatic tissue gene comparison can be analyzed using Kruskal–Wallis test. The statistical significance cutoff was set at p < 0.01. For Kaplan–Meier curves, the significance is calculated with the Student’s t-test. Correlation analysis was carried out by calculating the Pearson’s correlation coefficient.
Results
P63 expression is upregulated during osteogenic differentiation of bone marrow-derived human MSCs
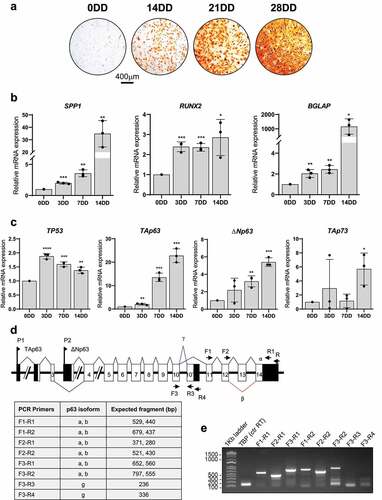
The transcription factor p53 play a role in the regulation of osteogenesis [Citation27,Citation28]. Because the p53 family shares many overlapping funcions and cooperate in regulating several biological processes including cell survival, and differentiation [Citation19], we asked whether p63 and p73 may also regulate osteogenic differentiation. To do so, bone marrow-derived human Mesenchymal Stem Cells (BM-MSCs) were cultured and in vitro committed to osteogenic lineage and differentiation in appropriate conditions for 0, 3, 7, 14, 21, and 28 days (days of differentiation, DD). An Alizarin Red staining was used for monitoring the process of osteogenic differentiation at different time points [Citation38]. As shown in , the progressive increase in calcium deposition indicates that BM-MSCs were fully differentiated into osteoblast in our experimental conditions. To further support the osteogenic differentiation, the mRNA levels of the osteogenic differentiation markers including, Osteopontin (SPP1), RUNX2 and Osteocalcin (BGLAP) were significantly upregulated during the differentiation (). Then, we assessed the expression of all p53 family members: p53, TAp63, ΔNp63, TAp73, and ΔNp73. Among them, only the expression at mRNA levels of p53, TAp63, and ΔNp63 is significantly upregulated during osteogenic differentiation. In particular, TAp63 shows the most marked upregulation in our experimental model (20-fold higher comparing 0DD and 14DD). On the contrary, ΔNp73 results undetectable at mRNA level while TAp73 is not significantly modulated during osteogenic differentiation of BM-MSCs. Because p63 mRNAs undergo alternative splicing at their 3ʹ ends () [Citation39], we have decided to assess at 14 DD the expression of the differential splicing isoforms by endpoint PCR reactions. Specific primers for α, β, and γ isoforms and expected PCR products length are described in panel D. PCR products obtained indicate that α isoforms are the mainly espressed in human MSCs committed to osteogenic differentiation (). TATA-binding protein (TBP) cDNA was amplified as retrotranscription positive control.
Figure 1. Osteogenic differentiation of bone marrow derived human MSCs. A) Alizarin Red S staining at 0, 14, 21 and 28 days of differentiation (DD) of bone marrow derived human MSCs. B) SPP1 (Osteopontin), RUNX2 and BGLAP (Osteocalcin) mRNAs relative quantification by Real Time RT-qPCR at 0, 3, 7 and 14DD. C) p53, TAp63, DNp63 and TAp73 mRNAs relative quantification by Real Time RT-qPCR at 0, 3, 7 and 14DD. Data are shown as the mean of 3 independent experiments ± SD, p-value by two-tailed unpaired Student’s t-test. D) TP63 human gene structure and description of PCR primers used in panel E) PCRs. E) Semiquantitative endpoint PCRs for p63 α, β and γ isoforms performd using 14DD MSCs cDNA
BM-MSCs derived from TAp63 knock-out mice show altered osteogenic differentiation
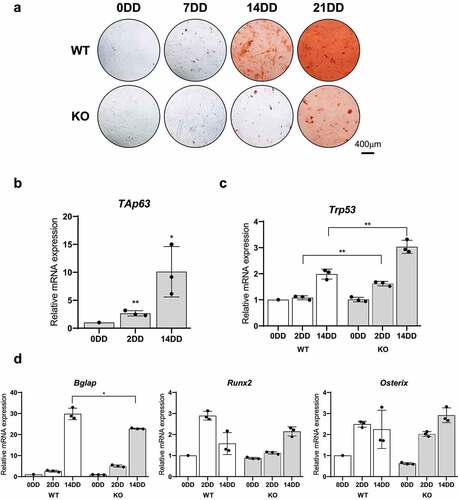
In order to investigate whether TAp63 participate in the regulation of osteogenic differentiation, we took the advantage of the TAp63 knock-out (TAp63 KO) mice generated as decribed in supplementary and b(mice gifted from Aberdam’s Lab). The expression of TAp63 was controlled both at mRNA and protein leves. As shown in supplementary ,and D deletion of exon 1 of TAp63 gene resulted in the lost of its expression. TAp63 KO mice born at expected Mendelian Ratio, are viable and do not show an obviovus phenotype. Then, MSCs were isolated from bone marrow of TAp63−/− (KO) and WT mice and cultured. After one passage in culture, the immunephenotype of the BM-MSCs were characterized by cytofluorimetric analysis using specific surface antigens (Supplementary -b). As expected, cells derived from KO and WT cells were positive for Sca1, CD44, and CD140a and negative for CD11c. Moreover, BM-MSCs derived from WT and KO mice show similar levels of the cell surface markers (Supplementary ). Then, cells were induced to differentiate into osteogenic lineage and collected at 0, 7, 14, and 21, days after differentiation. Osteogenic differentiation was monitored by Alizarin Red staining. As shown in , osteogenic differentiation was evident in WT cells at day 14. On the contrary, osteogenic differentiation resulted delayed in KO MSCs. Indeed, BM-MSCs derived from KO mice begin to differentiate at day 21. The samples were also analyzed for the expression of the p53 family members.In particular, we observed that both TAp63 and p53 expression significantly increased during osteogenic differentiation, confirming the results obtained in human BM-MCSs ().and c To further confirm the involvement of TAp63 in the regulation of osteogenic differentiation, we have assessed the expression of Osteopontin (SPP1), RUNX2 and Osteocalcin (BGLAP). As shown in , only Osteocalcin among the differentiation markers was significantly dowmodulated during KO MSCs differentiation, pointing out a putative role of TAp63 in late differentiation stages.
Figure 2. Osteogenic differentiation of bone marrow derived TAp63-KO (KO) e WT MSCs. A) Alizarin Red S staining at 0, 2 and 14 days of differentiation (DD) of bone marrow derived KO e WT MSC. B-C) TAp63, p53, BGLAP (osteocalcin), RUNX2 and Osterix mRNAs relative quantification by Real Time RT-qPCR at 0, 2 e 14DD in KO e WT bone marrow derived MSCs at 0, 2 e 14DD. Data are shown as the mean of 3 independent experiments ± SD, p-value by two-tailed unpaired Student’s t-test
TAp63 regulates osteogenic differentiation by directly modulating the expression of Osteoprotegerin
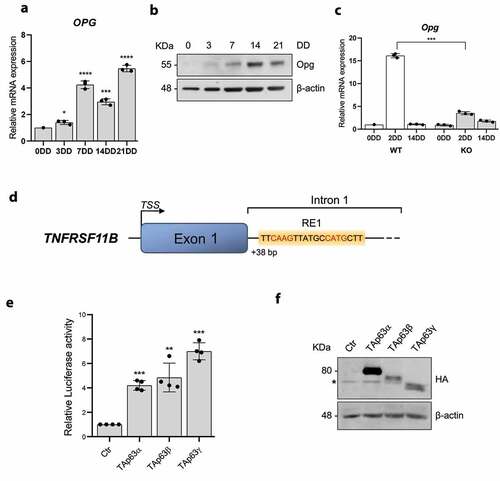
In order to explore the molecular mechanism by which TAp63 regulates osteogenic differentiation we have focused our attention on Osteoprotegerin (OPG), which plays a key role in the regulation of osteogenic differentiation [Citation40,Citation41]. In addition, we have recently shown that its expression is repressed by p53 [Citation29]. As shown in -B, both OPG mRNA and protein were significantly upregulated during human BM-MSCs in vitro osteogenic differentiation starting from 3DD to 21DD. Interstingly, OPG transcription seems to be altered in bone marrow-derived MSCs from TAp63−/− (KO) mice compared to WT cells (). In particular, comparing mRNA level at 3DD, OPG expression was significantly reduced (about 75%) in TAP63-/- MSCs compared to WT MSCs. These results suggested that TAp63 could be involved in the regulation of OPG expression during BM-MSCs osteogenic differentiation. To investigate whether TAp63 directly regulates the expression of OPG, we have performed an in silico analysis to search for putative p63 responsive elements nearby OPG gene. As depicted in , we found a strong putative site at the beginning of the first intron in OPG gene. A fragment of this region containing the p63 putative binding site was cloned into a luciferase assay vector and used to perform transactivation assays. Cotransfecting this construct and HA-tagged TAp63α, β and γ isoforms expression vectors (), we observed a significant increase in the relative luciferase activity when compared to control (empy vector) ().
Figure 3. OPG is a TAp63 target gene during MSC osteogenic differentiation. A) OPG mRNAs relative quantification by Real Time RT-qPCR at 0, 3, 7, 14, 21 days of differentiation (DD) of bone marrow derived human MSCs. B) OPG protein levels by Western blot at 0, 3, 7, 14, 21DD of bone marrow derived human MSCs. β-actin was used as loading control. One representative experiment of three is shown. C) OPG mRNAs relative quantification by Real Time RT-qPCR at 0, 2 e 14DD in KO e WT bone marrow derived MSCs. Data are shown as the mean o 3 independent experiments ± SD, p-value by two-tailed unpaired Student’s t-test. D) TNFRSF11B fisrt intron/exon representation; the putative p63 responsive element (RE) is depicted. E) Relative luciferase activity mesured 24 h after H1299 co-transfection with pGL3-BS1 and TAp63α, TAp63β e TAp63γ expression vectors or an empty as control (Ctr). Data are shows as the mean of 4 independent experiments ± SD, p-value by two-tailed unpaired Student’s t-test. F) Western Blot on total protein extracts used in luciferase assays in E) to check HA-TAp63α, HA-TAp63β and HA-TAp63γ. *: aspecific band. β-actin was used as loading control
OPG expression is deregulated in clinic cancer samples
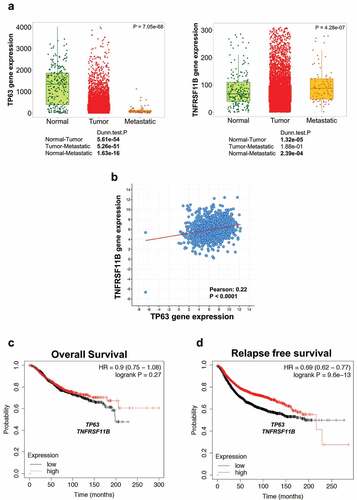
Several studies support the potential role of OPG in tumor biology [Citation42,Citation43]. In particular, we have recently shown that in patients affected by osteosarcoma high levels of OPG may correlate with an increased patient survival. Here, we extend this observation in breast and prostate cancers because both tumors metastatize to bone [Citation30]. Moreover, p63 plays also an important role in the pagthogenesis of both breast and prostate cancers [Citation44–47]. Therefore, we investigated whether the axis p63/OPG(TNFRSF11B) is conserved in both cancers. To do so, by using publicly available patient cancer dataset (https://tnmplot.com/analysis/), we enquired for the expression of both genes in breast and prostate cancers. As shown in , whereas p63 expression is significantly decreased both in tumor and in metastatic human samples when compared to normal tissues, OPG (TNFRSF11B) expression is decreased only in tumor samples. On the contrary, metastatic samples show an increase of OPG(TNFRSF11B) expression when compared to normal tissues. Of note, p63 expression positively correlates with OPG expression (). In addition, although in prostate cancer we observe a significant reduction in the expression of p63 both in tumor and metastatic samples, this was not the case for OPG(TNFRSF11B) (Supplementary ). More interestingly, high levels of mRNA expression of both p63 and OPG(TNFRSF11B) are associated with a better relapse-free survival ().and d Overall, our results suggest that the p63/OPG axis is conserved in breast cancer.
Figure 4. P63 and TNFRSF11B expression positively correlate in breast cancer patients. A) Expression of p63 and TNFRSF11B mRNA in normal, tumor and metastatic tissues. B) Bioinformatic analysis showing a positive correlation between p63 and OPG in breast cancer. C-D) High levels of both p63 and TNFRSF11B are associated with a better relapse free survival of breast cancer patients
Discussion and conclusion
The p53 family of transcription has a critical role in the regulation of several biological process including, cell survival, cell death, cell differentiation, and metabolism [Citation48–50]. In performing these activities, the three members of the family p53, p63, and p73 cooperate in the activation of the transcription of the same set of genes involved in cell death and proliferation. Nevertheless, each p53 family member has its own transcriptional repertoire, which in part contribute to the different role of the members in regulating cell differentiation. Indeed, embryos p53-null mice are viable and show mild developmental abnormalities including exencephaly, caused by the failure of the neural tube to close properly during embryogenesis [Citation51,Citation52]. p73-null mice are born viable, but show a runting phenotype and a high mortality rate [Citation53,Citation54]. The most evident phenotype characterizing the deletion of p73 is nervous system abnormalities related to hippocampal dysgenesis and olfactory neuron defects [Citation55–60]. Interestingly, p63-null mice show the most severe developmental phenotype of all p53 family members. The limbs are absent and they fail to develop a stratified epidermis and most epithelial tissues [Citation61–64].
Here, we report that TAp63 regulates the osteogenic differentiation of BM-MSCs by modulating the expression of Bglap and OPG. These results led us to speculate that TAp63 may regulate osteogenic differentiation by acting at two different stages of the biological process. On the one hand, TAp63 by regulating the expression of Bglap, a protein involved in bone mineralization, participates to the modulation of osteoblast function. On the other hand, TAp63 by directly controlling the expression of OPG, may indirectly affect the osteoclast function. Indeed, OPG produced by the osteoblast lineage cells, acts as a decoy receptor and inhibits osteoclast formation, function, and survival inhibiting RANKL binding to RANK. Whether TAp63 may directly regulate the osteoclast function remain to be addressed. Osteoclasts arise from the monocyte/macrophage lineage. To the best of our knowledge, the expression of TAp63 in monocyte/macrophage cells has not been reported yet. Moreover, TAp63 knock-out mice show the signs of premature aging including hair loss, impaired wound healing, kyphosis, and a shorter lifespan compared to their wild-type littermates [Citation65]. However, alteration in the skeletal system of these mice has not been reported/investigated. Therefore, whether TAp63 may directly affect the osteoclast function remains an open question. Nevertheless, our finding highliths a novel possible role of p63 in cell differentiation that toghether with the regulation of epithelilal tissues differentiation, add a layer of complexity to the biological role of p63. Although p53 family orchestrates the regulation of several biological processes by sharing overlapping functions, our results suggest that the members of the p53 family may also exert opposite effect on the same biological process. According to our results, we would like to speculate that TAp63 and p53 act at different stages of the bone remodeling processes. The bone remodeling process is accomplished according to four different phases: activation, resorption, reverse, and formation phase [Citation2]. Because p53 is upregulated earlier during the osteogenic process, we propose that by inhibiting the production of OPG, p53 is responsible for the activation of the osteoclasts and then play a role in the resorption phase. On the other hand, TAp63, which expression significantly increases later in the bone remodeling process, by upregulating OPG expression, inhibits osteoclast function to avoid an excessive bone resorption. This would allow the process in correctly progress in the next reverse and formation phases.
We have also extended these findings by assessing whether the p63/OPG axis is also conserved in a pathological context. Both genes are involved in the pathogenesis of breast cancer [Citation66]. Breast cancers remain the most frequent cause of cancer death worldwide [Citation67].
It is a complex and heterogeneous cancer type, taking into account histology and molecular features, breast cancers are divided into four groups: Luminal A (71%) and B (12%), HER2 positive (5%), and triple-negative breast cancers (12%, TNBC) [Citation5,Citation68–71]. These four groups differ for drug sentitivity and aggressiveness for instance, Luminal A and B differ for the levels of estrogen receptors and progesterone receptors making then responding differently to endocrine treatments [Citation31,Citation72–75]. Luminal B also overexpresses/amplifies HERB2 oncogene. TNBC lack both the expression of hormone receptors and HER2. They are very aggressive with worst prognosis for patients [Citation72,Citation76].
Among the transcription factors incolved in breast cancer, p63 show both tumor suppressive and oncogenic function. Indeed, loss of TAp63 isoform leads to the formation of aggressive metastatic mammary adenocarcinoma [Citation45]. On the contrary, ΔNp63 promotes self-renewal and expansion of mammary cancer stem cells and breast tumor growth [Citation46,Citation47]. In addition, loss of p63 is associated with metastatic spread and worse prognosis in prostate cancer [Citation44].
The OPG inhibits osteoclast formation, function, and survival inhibiting RANKL binding to RANK. Beyond its physiological role in regulating bone remodeling, OPG is also implicated pathological conditions including tumorigenesis and bone metastasis. Indeed, several studies have shown that the serum level of OPG has been found elevated in patients with breast [Citation77,Citation78] or prostate [Citation79,Citation80] cancer metastatized to the bone. In this context, our bioinformatics analysis suggests that p63 may potentially control the expression of OPG in primary breast tumor. Indeed, the expression of both genes is significantly reduced in primary tumors when compared to normal tissues and p63 expression positively correlate with OPG expression. On the contrary, p63/OPG axis does not seem to conserve prostate cancer. More interestingly, breast cancer patients with low serum OPG levels seem to have a better overall survival when compared to patients with high levels of serum OPG [Citation81]. However, our results indicate that patients with higher expression of both p63 and OPG have a better relapse-free survival when compared to patients with low levels of both genes. Although the results seem in contradiction with the present literature, it should be noticed that our analysis considers the mean expression of both genes in tumor samples and not the single OPG levels in the patient serum.
Overall, our findings underscore the role of p63, in particular TAp63, in the regulation of the BM-MSCs osteogenic differentiation, suggesting therefore a possible role of TAp63 in controlling bone homeostasis. In addition, the expression of the p63/OPG axis may be a useful a clinical biomarker in breast cancer [Citation72,Citation81].
Author contributions
EC designed the research; DA generated the TAp63 knock-out mice; AML, EF, MA, MAP performed the experiments. EF, MA, TV elaborated dataset data. AML, EC, GM, YS, YW analysed the data; EC, AML and MA wrote the paper. All the co-authors read the paper and made comments.
Supplemental Material
Download Zip (619.4 KB)Acknowledgments
This work has been mainly supported by Fondazione Luigi Maria Monti IDI-IRCCS and Ministry of Health & MAECI Italy-China Science and Technology Cooperation (#PGR00961) to E.C, GM and YW.
Disclosure statement
The authors declare no conflict of interest.
Data availability statement
All data generated or analysed during this study are included in this published article (and its supplementary information files). Data sharing not applicable to this article as no datasets were generated or analysed during the current study.
Supplementary material
Supplemental data for this article can be accessed here
Additional information
Funding
Related Research Data
References
- Zaidi M. Skeletal remodeling in health and disease. Nat Med. 2007;13(7):791–801.
- Rucci N. Molecular biology of bone remodelling. Clin Cases Miner Bone Metab. 2008;5:49–56.
- Madel MB, Ibanez L, Wakkach A, et al. Immunefunction and diversity of osteoclasts in normal andpathological conditions. Front Immunol. 2019;10:1408.
- Wu MY, Li CJ, Yiang GT, et al. Molecular regulation of bone metastasis pathogenesis. Cell Physiol Biochem. 2018;46(4):1423–1438.
- Baron R, Rawadi G. Targeting the Wnt/beta-catenin pathway to regulate bone formation in the adult skeleton. Endocrinology. 2007;148(6):2635–2643.
- Kopper L, Kopper L. Denosumab-A powerful RANKL inhibitor to stop lytic metastases and other bone loss actions by osteoclasts. Pathol Oncol Res. 2012;18(4):743–747.
- Kang Y, Siegel PM, Shu W, et al. A multigenic program mediating breast cancer metastasis to bone. Cancer Cell. 2003;3(6):537–549.
- Behzatoglu K. Osteoclasts in tumor biology: metastasis and epithelial-mesenchymal-myeloid transition. Pathol Oncol Res. 2021;27:609472.
- Dembinski R, Prasath V, Bohnak C, et al. Estrogen receptor positive and progesterone receptor negative breast cancer: the role of hormone therapy. Horm Cancer. 2020;11(3–4):148–154.
- Davis PJ, Mousa SA, Schechter GP, et al. Platelet ATP, thyroid hormone receptor on integrin αvβ3 and cancer metastasis. Horm Cancer. 2020;11(1):13–16.
- Bolf EL, Gillis NE, Barnum MS, et al. The thyroid hormone receptor-RUNX2 axis: a novel tumor suppressive pathway in breast cancer. Horm Cancer. 2020;11(1):34–41.
- Li R, Teng X, Zhu H, et al. MiR-4500 Regulates PLXNC1 and inhibits papillary thyroid cancer progression. Horm Cancer. 2019;10(4–6):150–160.
- Mattiolo P, Fiadone G, Paolino G, et al. Epithelial-mesenchymal transition in undifferentiated carcinoma of the pancreas with and without osteoclast-like giant cells. Virchows Arch. 2021;478(2):319–326.
- Yamaguchi A, Komori T, Suda T. Regulation of osteoblast differentiation mediated by bone morphogenetic proteins, hedgehogs, and Cbfa1. Endocr Rev. 2000;21(4):393–411.
- Westendorf JJ, Kahler RA, Schroeder TM. Wnt signalling in osteoblast and bone diseases. Gene. 2004;341:19–39.
- Baron R, Rawadi G. Targeting the Wnt/β-catenin pathway to regulate bone formation in the adult skeleton. Endocrinology. 2007;148(6):2635–2643.
- Hofbauer LC, Armin HE, Heufelder AE, et al. Role of receptor activator of nuclear factor-κB ligand and osteoprotegerin in bone cell biology. J Mol Med. 2001;79(5–6):243–253.
- Bucay N, Sarosi I, Dunstan CR, et al. Osteoprotegerin-deficient mice develop early onset osteoporosis and arterial calcification. Genes Dev. 1998;12(9):1260–1268.
- Stiewe T. The p53 family in differentiation and tumorigenesis. Nat Rev Cancer. 2007;7(3):165–168.
- Candi E, Agostini M, Melino G, et al. How the TP53 Family Proteins TP63 and TP73 Contribute to Tumorigenesis: regulators and Effectors. Off. J Hum Mutat. 2014;35(6):702–714.
- Xu R, Garcia-Barros M, Wen S, et al. Tumor suppressor p53 links ceramide metabolism to DNA damage response through alkaline ceramidase 2. Cell Death Differ. 2018;25:841–856.
- Agostini M, Niklison-Chirou MV, Annicchiarico-Petruzzelli MM, et al. p73 regulates primary cortical neuron metabolism: a global metabolic profile. Mol Neurobiol. 2018;55(4):3237–3250.
- Amelio I, Antonov AA, Catani MV, et al. TAp73 promotes anabolism. Oncotarget. 2014;5(24):12820–12934.
- Viticchiè G, Agostini M, Lena AM, et al. p63 supports aerobic respiration through hexokinase II. Proc Natl Acad Sci USA [Internet]. 2015;112(37):11577–11582.
- Bellomaria A, Barbato G, Melino G, et al. Recognition mechanism of p63 by the E3 ligase Itch: novel strategy in the study and inhibition of this interaction. Cell Cycle. 2012;11(19):3638–3648.
- Bellomaria A, Barbato G, Melino G, et al. Recognition of p63 by the E3 ligase ITCH: effect of an ectodermal dysplasia mutant. Cell Cycle. 2010;9(18):3754–3763.
- Chandar N, Swindle J, Szajkovics A, et al. Relationship of bone morphogenetic protein expression during osteoblast differentiation to wild type p53. J Orthop Res. 2005;23(6):1345–1353.
- Wang X, Kua H-Y, Hu Y, et al. p53 functions as a negative regulator of osteoblastogenesis, osteoblast-dependent osteoclastogenesis, and bone remodeling. J Cell Biol. 2006;172(1):115–125.
- Velletri T, Huang Y, Wang Y, et al. Loss of p53 in mesenchymal stem cells promotes alteration of bone remodeling through negative regulation of osteoprotegerin. Cell Death Differ. 2021;28(1):156–169.
- Yin JJ, Pollock CB, Kelly K. Mechanisms of cancer metastasis to the bone. Cell Res. 2005;15(1):57–62.
- Fowler AM, Salem K, DeGrave M, et al. Progesterone receptor gene variants in metastatic estrogen receptor positive breast cancer. Horm Cancer. 2020;11(2):63–75.
- Cordo Russo RI, Chervo MF, Madera S, et al. Nuclear ErbB-2: a novel therapeutic target in ErbB-2-positive breast Cancer? Horm Cancer. 2019;10(2–3):64–70.
- Bartha Á, Győrffy B. TNMplot.com: a web tool for the comparison of gene expression in normal, tumor and metastatic tissues. Int J Mol Sci. 2021;22(5):2622.
- Gao J, Aksoy BA, Dogrusoz U, et al. Integrative analysis of complex cancer genomics and clinical profiles using the cBioPortal. Sci Signal. 2013;6(269):l1.
- Cerami E, Gao J, Dogrusoz U, et al. The cBio cancer genomics portal: an open platform for exploring multidimensional cancer genomics data. Cancer Discov. 2012;2(5):401–404.
- Győrffy B. Survival analysis across the entire transcriptome identifies biomarkers with the highest prognostic power in breast cancer. Comput Struct Biotechnol J. 2021;19:4101–4109.
- Paul H, Reginato AJ, Schumacher HR. Alizarin Red S staininf asa a sceening test to detect calcium compounds in synovial fluid. Arthritis Rheum. 1983;26(2):191–200.
- Ghioni P, Bolognese F, Duijf PHG, et al. Complex transcriptional effects of p63 Isoforms: identification of Novel activation and repression domains. Mol Cell Biol. 2002;22(24):8659–8668.
- Simonet W, Lacey D, Dunstan C, et al. Osteoprotegerin: a novel secreted protein involved in the regulation of bone density. Cell. 1997;89(2):309–319.
- Kong -Y-Y, Yoshida H, Sarosi I, et al. OPGL is a key regulator of osteoclastogenesis, lymphocyte development and lymph-node organogenesis. Nature. 1999;397(6717):315–323.
- Sisay M, Mengistu G, Edessa D. The RANK/RANKL/OPG system in tumorigenesis and metastasis of cancer stem cell: potential targets for anticancer therapy. Onco Targets Ther. 2017;10:3801–3810.
- Brown JM, Zhang J, Keller ET. Opg, RANKl, and RANK in cancer metastasis: expression and regulation. Cancer Treat Res. 2004;118:149–172.
- Tucci P, Agostini M, Grespi F, et al. Loss of p63 and its microRNA-205 target results in enhanced cell migration and metastasis in prostate cancer. Proc Natl Acad Sci U S A. 2012;109(38):15312–15317.
- Su X, Napoli M, Abbas HA, et al. TAp63 suppresses mammary tumorigenesis through regulation of the Hippo pathway. Oncogene. 2017;36(17):2377–2393.
- Chakrabarti R, Wei Y, Hwang J, et al. ΔNp63 promotes stem cell activity in mammary gland development and basal-like breast cancer by enhancing Fzd7 expression and Wnt signalling. Nat Cell Biol. 2014;16(10):1004–1015.
- Memmi EM, Sanarico AG, Giacobbe A, et al. p63 sustains self-renewal of mammary cancer stem cells through regulation of Sonic Hedgehog signaling. Proc Natl Acad Sci. 2015;112(11):3499–3504.
- Napoli M, Flores ER. The p53 family orchestrates the regulation of metabolism: physiological regulation and implications for cancer therapy. Br J Cancer. 2017;116(2):149–155.
- Kastenhuber ER, Lowe SW. Putting p53 in context. Cell. 2017;170(6):1062–1078.
- Nemajerova A, Amelio I, Gebel J, et al. Non-oncogenic roles of TAp73: from multiciliogenesis to metabolism. Cell Death Differ. 2018;25(1):144–153.
- Meletis K, Wirta V, Hede SM, et al. p53 suppresses the self-renewal of adult neural stem cells. Development. 2006;133(2):363–369.
- Armesilla-Diaz A, Bragado P, Del Valle I, et al. p53 regulates the self-renewal and differentiation of neural precursors. Neuroscience. 2009;158(4):1378–1389.
- Yang A, Walker N, Bronson R, et al. p73-deficient mice have neurological, pheromonal and inflammatory defects but lack spontaneous tumours. Nature. 2000;404(6773):99–103.
- Niklison-Chirou MV, Killick R, Knight RA, et al. How does p73 cause neuronal defects? Mol Neurobiol. 2016;53(7):4509–4520.
- Agostini M, Tucci P, Chen H, et al. p73 regulates maintenance of neural stem cell. Biochem Biophys Res Commun. 2010;403(1):13–17.
- Talos F, Abraham A, Vaseva AV, et al. p73 is an essential regulator of neural stem cell maintenance in embryonal and adult CNS neurogenesis. Cell Death Differ. 2010;17(12):1816–1829.
- Niklison-Chirou MV, Steinert JR, Agostini M, et al. TAp73 knockout mice show morphological and functional nervous system defects associated with loss of p75 neurotrophin receptor. Proc Natl Acad Sci U S A. 2013;110(47):18952–18957.
- Agostini M, Tucci P, Steinert JR, et al. microRNA-34a regulates neurite outgrowth, spinal morphology, and function. Proc Natl Acad Sci. 2011;108(52):21099–21104.
- Agostini M, Tucci P, Killick R, et al. Neuronal differentiation by TAp73 is mediated by microRNA-34a regulation of synaptic protein targets. Proc Natl Acad Sci. 2011;108(52):21093–21098.
- Amelio I, Bertolo R, Bove P, et al. Cancer predictive studies. Biol Direct. 2020;15(1):18.
- Celli J, Duijf P, Hamel BCJ, et al. Heterozygous germline mutations in the p53 homolog p63 are the cause of EEC syndrome. Cell. 1999;99(2):143–153.
- Mills AA, Zheng B, Wang XJ, et al. P63 Is a P53 homologue required for limb and Epidermal Morphogenesis. Nature. 1999;398(6729):708–713.
- Yang A, Schweitzer R, Sun D, et al. p63 is essential for regenerative proliferation in limb, craniofacial and epithelial development. Nature. 1999;398(6729):714–718.
- Lena AM, Rossi V, Osterburg S, et al. The p63 C-terminus is essential for murine oocyte integrity. Nat Commun. 2021;12(1):383.
- Infante M, Fabi A, Cognetti F, et al. RANKL/RANK/OPG system beyond bone remodeling: involvement in breast cancer and clinical perspectives. J Exp Clin Cancer Res. 2019;38(1):12.
- Su X, Paris M, Gi YJ, et al. TAp63 prevents premature aging by promoting adult stem cell maintenance. Cell Stem Cell. 2009;5(1):64–75.
- Desantis CE, Ma J, Ann SG, et al. Breast cancer statistics, 2017, racial disparity in mortality by state. CA Cancer J Clin. 2017;67(6):439–448.
- WF A, Ha K, Ps R. Incidence of breast cancer in the United States: current and future trends. J Natl Cancer Inst. 2011;103(18):1397–1402.
- Gatti V, Bongiorno-Borbone L, Fierro C, et al. p63 at the crossroads between stemness and metastasis in breast cancer. Int J Mol Sci. 2019;20(11):2683.
- Amelio I, Bernassola F, Candi E. Emerging roles of long non-coding RNAs in breast cancer biology and management. Semin Cancer Biol. 2021;72:36–45.
- Lung DK, Reese RM, Alarid ET. Intrinsic and extrinsic factors governing the transcriptional regulation of ESR1. Horm Cancer. 2020;11(3–4):129–147.
- Sledge GW, Hortobagyi GN, Goodwin PJ, et al. Past, present, and future challenges in breast cancer treatment. J Clin Oncol. 2014;32(19):1979–1986.
- Madera S, Chervo MF, Chiauzzi VA, et al. Nuclear PDCD4 expression defines a subset of luminal B-like breast cancers with good prognosis. Horm Cancer. 2020;11(5–6):218–239.
- Pan Y, Wang X, Zhang Y, et al. Estradiol-Induced MMP-9 Expression via PELP1-mediated membrane-initiated signaling in ERα-positive breast cancer cells. Horm Cancer. 2020;11(2):87–96.
- Smart E, Alejo LH, Frasor J. Cytoplasmic ERα and NFκB promote cell survival in mouse mammary cancer cell lines. Horm Cancer. 2020 Apr;11(2):76–86.
- Lorona NC, Cook LS, Tang M-TC, et al. Recent use of oral contraceptives and risk of luminal B, triple-negative, and HER2-overexpressing breast cancer. Horm Cancer. 2019;10(2–3):71–76.
- Santini D, Perrone G, Roato I, et al. Expression pattern of receptor activator of NFκB (RANK) in a series of primary solid tumors and related bone metastases. J Cell Physiol. 2011;226(3):780–784.
- Owen S, Ye L, Sanders AJ, et al. Expression profile of receptor activator of nuclear-κB (RANK), RANK ligand (RANKL) and osteoprotegerin (OPG) in breast cancer. Anticancer Res. 2013;33:199–206.
- Holen I, Croucher PI, Hamdy FC, et al. Osteoprotegerin (OPG) is a survival factor for human prostate cancer cells. Cancer Res. 2002;62:1619–1623.
- Takayama K, Inoue T, Narita S, et al. Inhibition of the RANK/RANKL signaling with osteoprotegerin prevents castration-induced acceleration of bone metastasis in castration-insensitive prostate cancer. Cancer Lett. 2017;397:103–110.
- Weichhaus M, Chung STM, Connelly L. Osteoprotegerin in breast cancer: beyond bone remodeling. Mol Cancer. 2015;14(1):117.
- Oktay K, Santaliz-Casiano A, Patel M, et al. A Computational statistics approach to evaluate blood biomarkers for breast cancer risk stratification. Horm Cancer. 2020;11(1):17–33.