
ABSTRACT
Gastric cancer (GC) is the most common gastrointestinal malignancy worldwide. However, the molecular mechanisms of the progression of GC are not fully understood. Ras-responsive element binding protein 1 (RREB1) is an oncogene in many types of cancer that is involved in various biological processes, such as DNA damage repair, cell growth and proliferation, cell differentiation, fat development, and fasting glucose balance. In this study, we demonstrate the role of RREB1 in gastric cancer. First, by immunohistochemistry staining (IHC) and bioinformatics analysis, we demonstrated the expression of RREB1 in gastric cancer and paired normal gastric tissues. Then, we established RREB1 overexpression and knockdown cell lines via lentiviral transfection and detected cell proliferation by using MTT, colony-forming, cell cycle and apoptosis assays in vitro. We demonstrated the effect of RREB1 on cell proliferation in vivo by using a subcutaneous xenograft tumor model in nude mice. Finally, by using Western blotting and IHC, we demonstrated the possible mechanism by which RREB1 affects cell proliferation. The IHC and bioinformatics analyses demonstrated that RREB1 was highly expressed in gastric cancer and showed that RREB1-expressing patients had a larger tumor size and more lymphovascular invasion than RREB1-negative patients. Knockdown of RREB1 inhibited cell proliferation in vivo and in vitro. Knockdown of RREB1 enhanced p16 expression in vivo and in vitro, and p16 expression was negatively related to RREB1 in gastric cancer tissue. RREB1 was highly expressed in gastric cancer, and knockdown of RREB1 inhibited cell proliferation via enhanced p16 expression.
KEYWORDS:
1. Introduction
Gastric cancer (GC) is one of the most common malignant cancers worldwide, especially in East Asia [Citation1]. Among all cancers, gastric cancer ranks fifth in terms of incidence and third in terms of mortality. In China, most patients are diagnosed with GC in advanced stages, which leads to a poor prognosis and causes a serious threat to human health [Citation2].
Self-sufficiency in growth signals is one of the most important characteristic for cancer, in which the Ras related pathway plays a vital role [Citation3]. When ras related pathway is activated in cancer, the malignant cell will acquire unlimited energy sporting for growth. Thus, inhibit Ras related pathway is very useful for treatment of cancer. However, there is only a small number of drug target Ras, and the effect of these drug is limited. Therefore, to discover more Ras related target is urgently for develop new drugs that inhibit Ras [Citation4].
RREB1 is a zinc finger transcription factor that binds specifically to the distal Ras-responsive element (RRE) and may be involved in Ras/Raf-mediated cell differentiation [Citation5]. RREB1 has been identified as a potential human oncogene, and it is overexpressed in thyroid cancer, where it results in increased transactivation of the calcitonin gene in response to Ras signal transduction [Citation6]. RREB1 suppressed the expression of the p16INK promoter, and the development of pristane-induced plasma cell tumors in BALB/c mice was attributable to a polymorphism in the RREB1 binding site [Citation7]. KRas and RREB1 are experimentally determined targets of miR-143 and miR-145, which demonstrates the existence of a feedback circuit that potentiates KRas-mediated tumorigenesis via suppression of the antitumorigenic miR-143/145 locus [Citation8]. RREB1 was proven to induce upregulation of AGAP2-AS1 to regulate cell proliferation and migration in pancreatic cancer partly by suppressing ANKRD1 and ANGPTL4 by recruiting EZH2 [Citation9]. Jie Su and his colleagues demonstrated that RREB1 provides a molecular link between the Ras and TGF-β pathways for coordinated induction of developmental and fibrogenic epithelial-mesenchymal transition (EMT) [Citation10]. Oliver A. Kent demonstrated that genetic perturbation of the RREB1-SIN3A-KDM1A complex represents a new category of RASopathy-like syndromes arising through epigenetic reprogramming of MAPK pathway genes [Citation11].
Recently, many studies have demonstrated that RREB1 plays an important role in the development of various cancers [Citation12]. However, the role of RREB1 in gastric cancer has not yet been reported. In this study, we demonstrated that knockdown of RREB1 expression inhibited gastric cancer cell proliferation via enhanced p16 expression both in vivo and in vitro.
2. Materials and methods
2.1. Clinical samples and cell culture
We collected 60 paired gastric cancer tissues and adjacent normal tissues from the First Affiliated Hospital of Xi’an Jiaotong University from October 2019 to December 2019. Patients who received preoperative chemotherapy or radiotherapy were excluded from this study. This study was approved by the Ethics Committee of the First Affiliated Hospital of Xi’an Jiaotong University. All subjects were fully informed of the nature of the study, and all subjects provided written consent for their participation.
The human gastric cancer cell lines SGC7901, BGC823, AGS, MGC803 and MNK45 were obtained from the Shanghai Institute of Cell Biology, Chinese Academy of Sciences. These cells were cultivated in DMEM (Gibco BRL, Carlsbad, CA, USA) supplemented with 10% FBS (Gibco BRL, Carlsbad, CA, USA) at 5% CO2 at 37°C.
2.2. Immunohistochemistry staining
Tissues obtained from patients or mice were soaked in formalin for 24 h and sliced into continuous pathological sections at a thickness of 4 μm with paraffin embedding. For each specimen, at least three slices were randomly selected for IHC. The experiment was performed using an IHC kit (SA1023, Bausch & T organisms, Wuhan, China) according to the manufacturer’s instructions. Then, the tissue was dewaxing and dehydration by xylene and alcohol and inhibit endogenous peroxidasein by placed in 3% hydrogen peroxide for 30 min. After that sections were antigen retrieval was carried out by soaking the slides in 0.01 M citrate buffer (pH 6.0) and heating them for 30 min in a microwave. Next the slice was incubated with a primary antibody over night at 4°C. The concentrations of the primary antibodies for each antibody were as follows: RREB1 primary antibody (ab64168, Abcam, Cambridge, UK, 1:200 dilution), Ki67 primary antibody (ab156014, Abcam, Cambridge, UK, 1:200 dilution), and p16 primary antibody (ab156014, Abcam, Cambridge, UK, 1:200 dilution). After wash for twice, the slice was incubated with biotinylated secondary antibody at 37°C for one hour. 3-Diaminobenzidine tetrahydrochloride (DAB) was applied as a chromogen, and the sections were counterstained with hematoxylin. We selected at least five high-magnification fields from each section to determine the results. The IHC score was evaluated as the intensity and positively stained cell ratio. The degree of intensity was defined as 0 for no staining, 1 for weak staining, 2 for moderate staining, 3 for intense staining and 4 for strongly intense staining. The grade for positively stained number of cells was 0 for 0%, 1 for 1–25%, 2 for 26–50%, 3 for 51–75% and 4 for 76–100%. The immunoreactivity score (IRS) was the product of the area and intensity. Samples with IRS≤3 were assigned to the negative group, and others were assigned to the positive group. Two independent pathologists who were blinded to the experimental design performed this process by using Image J software.
2.3. Establishment of stably transfected cell lines
The overexpression vectors were purchased from GeneChem Co., Ltd. (Shanghai, China). For overexpression vectors, 5 × 10⁴ cells were cultured in six-well plates for 24 h, and transfection was performed according to the manufacturer’s instructions. The MOIs for AGS were 50 and 20 for MGC-803. The knockdown shRNA was purchased from GenePharma Co., Ltd. (Shanghai, China). The transfections were performed according to the manufacturer’s instructions, and the MOI was 20 for both SGC-7901 and BGC-823 cells. After transfection for 24 h, the cell was cultured in a fresh medium for two days, then treated by 2ug/mL puromycin until it establishes stable cell lines.
2.4. Western blotting
Cell protein extraction was performed using the RIPA Protein Extraction Kit (Heart, Xi’an, China) following the manufacturer’s instructions. Western blotting was performed as described in the literature [Citation13]. The extracted proteins were subjected to 12% sodium dodecyl sulfate polyacrylamide gel electrophoresis and transferred to a PVDF membrane. The membrane was blocked with 5% milk for 1 h and incubated with the primary antibody at 4°C overnight. The primary antibodies included anti-RREB1 (ab64168, Abcam, Cambridge, 1:1000 dilution, 20,280-1-AP, Proteintech, USA, 1:500 dilution), anti-cyclin D1 (16,396-1-AP, Proteintech, Boston, USA, 1:1000 dilution), anti-PCNA (10,205-2-AP, Proteintech, USA, 1:1000 dilution), anti-Bax (27,282-1-AP, Proteintech, USA, 1:1000 dilution), anti-p16 (27,282-1-AP, Proteintech, USA, 1:1000 dilution), and anti-GAPDH (10,494-1-AP, Proteintech, USA, 1:1000 dilution). After incubation, the PVDF membrane was rinsed and incubated with the secondary antibody for 1 h at room temperature. Protein expression was detected using a chemiluminescence detection system and the intensity of protein was analyze by the own software of the machine (Millipore, Billerica, MA, USA).
2.5. Cell proliferation assay
Two thousand cells were seeded in 96-well plates for the MTT assay, then the cell was cultivated for different time. At each time point the cell was treating by 20uL 5 mg/mL MTT and cultivated at 37°C for 4 hours, then the cells was dissolved by 150 μL dimethyl sulfoxide. And cell viability was measured in a microplate reader (Thermo Fisher, Waltham, USA) every day for one week. Six parallel wells were used for each experiment, which was repeated three times. The data are presented as the mean ± standard deviation (SD).
2.6. Colony-forming assay
Single-cell suspensions were seeded in 6-cm culture dishes at 800 cells/well. Fourteen days later, these cells were fixed with 4% paraformaldehyde and stained with 1% crystal violet. The number of visible colonies was calculated. The experiment was performed at least three times.
2.7. Cell cycle and cell apoptosis assays
The cell cycle assay was performed using a kit according to the manufacturer’s instructions (Kaiji Biotechnology Co., Ltd., Hangzhou, China). For detection of the cell cycle, 1 × 10⁵ cells were cultured in six-well plates for 24 h and harvested. After three washes with PBS, the cells were fixed with cold 75% anhydrous ethanol overnight at −20°C. Then, the cells were washed twice with PBS and stained with RNase A (100 μL) for 30 min at 37°C, followed by propidium iodide (400 μL) staining for 30 min at 4°C in the dark. Then, the cells were detected by a FAC sorter (BD, Franklin Lakes, USA) and calculated using Cell Quest software (BD, Franklin Lakes, USA). Each experiments was repeat for fifth.
Cell apoptosis was assessed using a kit (Lianke Biotechnology Co., Ltd.). For detection of apoptosis, 2 × 10⁵ cells were cultured in six-well plates for 24 h and harvested. Next, the cells were resuspended in binding buffer at a concentration of 1 × 10⁶ cells/ml and stained with Annexin V-APC and PE. Then, the apoptotic rate was determined and calculated using the FAC sorter and Cell Quest software (BD, Franklin Lakes, USA). Each experiments was repeat for fifth.
2.8. Cancer xenograft models in nude mice
Twenty 4-week-old female BALB/c-nude mice (Shanghai SLAC Laboratory
Animal Co., Ltd., Shanghai, China) were randomly divided into four groups. Approximately 5 × 10⁶ stable BGC823 RREB1 knockdown cells or MGC803 RREB1 overexpression cell line and parallel control cells were injected into the right axillary side. The length (a) and width (b) of the tumors were measured every 3 days after injection using calipers. The volume (V) was calculated as V = ab2/2. After approximately three weeks, the mice were sacrificed. The tumors of the mice were measured and fixed in 10% formalin for subsequent experiments.
2.9. Statistical analysis
The data analysis was performed using SPSS 18.0 (Chicago, IL, USA), and the results are expressed as the mean ± standard deviation. Normally distributed data were compared using a t test or one-way ANOVA (comparisons between two groups used the LSD). Data that failed to meet this standard were analyzed using the Kruskal–Wallis test. The chi-squared test or Fisher’s exact test was used to compare categorical data. P-values less than 0.05 were considered statistically significant.
3. Results
3.1. RREB1 is highly expressed in gastric cancer
RREB1 is a Ras-associated gene that promotes the proliferation of prostatic cancer [Citation14,Citation15]. Here, we demonstrated that RREB1 was expressed at higher levels in gastric cancer. By IHC staining of gastric cancer and its adjacent normal gastric tissue, we found that RREB1 was mainly expressed in the nucleus and cytoplasm (), and the IHC score of RREB1 was higher in the cancer tissue than in the normal tissue (). Then, by searching the GEPIA database (http://gepia.cancer-pku.cn/), we found that the level of RREB1 was higher in cancer tissue than normal tissue (). However, there was no significant relationship between RREB1 expression and the overall or disease-free survival time of gastric cancer patients in this database ().
Figure 1. RREB1 is highly expressed in gastric cancer tissue but has no significantly with the prognosis of patients
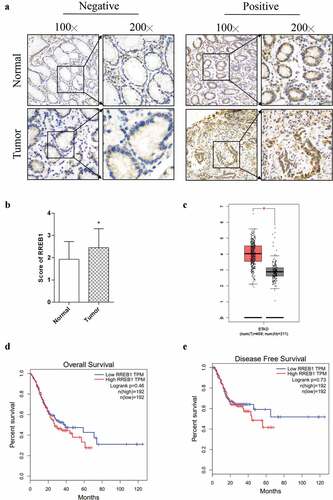
Finally, we analyzed the clinic pathological characteristics of patients with different levels of RREB1 expression in IHC-stained samples. We found that the patients with higher RREB1 expression had a larger tumor size and more lymphovascular invasion than those with negative expression, as shown in .
Table 1. Association between the clinicopathological features of CRC patients and RREB1 expression
3.2. Knockdown of RREB1 inhibits cell proliferation in vivo and in vitro
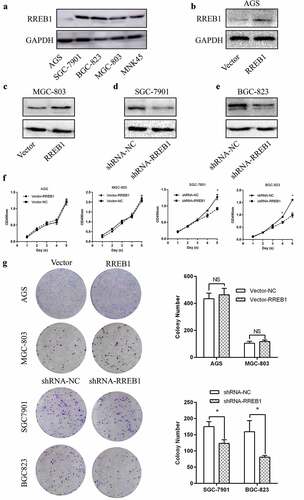
To elucidate the function of RREB1, we detected the expression of RREB1 in gastric cell lines and found that RREB1 was expressed in all cell lines. SGC7901 and BGC823 had higher RREB1 expression, and AGS, MGC803 and MNK45 had lower expression (). We established RREB1 overexpression and knockdown cell lines, as shown in . MTT assays showed that the wild-type SGC7901 and BGC823 cell lines had a proliferation advantage over the knockdown RREB1 cell line on days 4 and 5. Colony formation assays also showed that the wild-type SGC7901 and BGC823 cells had a higher colony forming ability than the RREB1 knockdown cells. The RREB1-overexpressing cell line was not different from the wild-type cell line in the MTT and colony formation assays ().
Figure 2. Knockdown of RREB1 inhibit gastric cancer cell proliferation
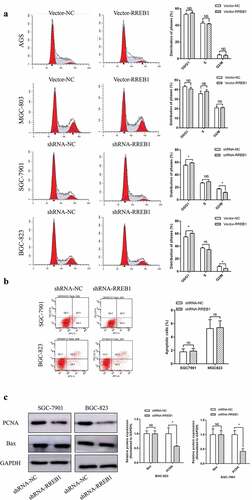
To further verify the effect of RREB1 on cell proliferation, we detected the cell cycle by using flow cytometry. The results showed that knockdown of RREB1 induced G0 to G1 cell arrest, as shown in . We detected the apoptosis of the wild-type and RREB1 knockdown cell lines to determine whether the RREB1 knockdown-mediated inhibition of cell proliferation resulted in apoptosis and found no difference between the cell lines with different RREB1 expression levels (). We detected cell cycle- and apoptosis-related proteins and found that PCNA, but not Bax, expression was lower in the RREB1 knockdown cell line than the wild-type cell line ().
Figure 3. Cell cycle and apoptosis of RREB1 overexpression and knockdown cell lines
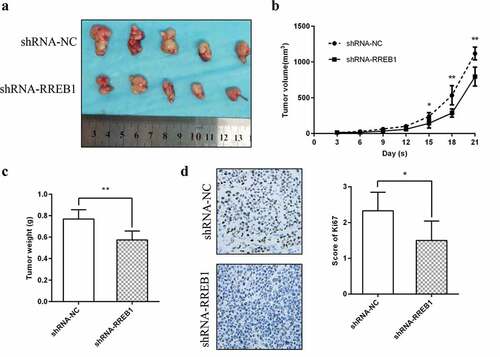
We confirmed the effect of RREB1 on cell proliferation in vivo. The results demonstrated that knockdown of RREB1 inhibited tumor growth in vivo (). Tumor Ki67 IHC staining also demonstrated a lower expression of Ki67 in the knockdown RREB1 tumors ().
Figure 4. RREB1 promotes cell proliferation in vivo (n = 5)
3.3. Knockdown of RREB1 inhibits cell proliferation via enhanced p16 expression
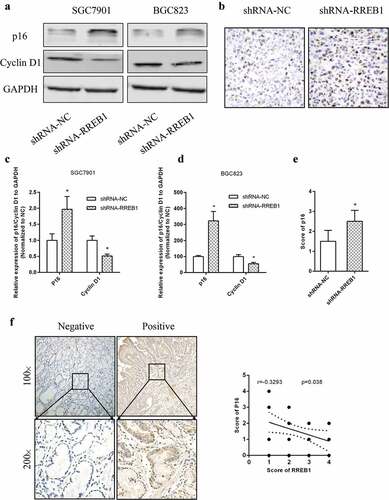
RREB1 inhibited cell proliferation by reducing p16 expression in thyroid cancer5. Therefore, we detected p16 expression in different RREB1 expression cell line. Western blotting showed that the expression of p16 was higher and cyclin D1 was lower in the RREB1 knockdown cell line (), and p16 expression was higher in tumor tissue from the RREB1 knockdown mice (). We detected the expression of p16 using IHC and analyzed its relationship with RREB1. As shown in , the expression of RREB1 was negatively related to p16.
Figure 5. Knockdown of RREB1 inhibits cell proliferation via enhanced p16 expression
4. Discussion
Gastric cancer is one of most common cancers in China and a major threat to human health [Citation16,Citation17]. One of the major characteristics of cancer is uncontrolled cell proliferation, and the Ras-related pathway plays an important role in this process [Citation3]. The present study demonstrated that the Ras-related gene RREB1 was highly expressed in gastric tissue, and knockdown of RREB1 expression inhibited cell proliferation via enhanced p16 expression both in vivo and in vitro. This may give a new sight for development new drug or discover Ras related mechanism for development of cancer.
Ras is one of the most studied oncogenes and plays a crucial role in tumor development. While there have been only a few drugs targeting Ras by now. Discovering Ras-related genes and their functions is very useful. RREB1 is associated with Ras and highly expressed in prostate cancer tissue and thyroid carcinomas [Citation15,Citation18]. This study demonstrated that RREB1 was highly expressed in gastric cancer and that RREB1-positive patients had a larger tumor size and a higher rate of lymphovascular invasion than RREB1-negative patients. However, due to the small number of patients involved, we did not demonstrate the relationship between the long-term prognosis of patients and different levels of RREB1 expression. To our knowledge, this may be the first study to report RREB1 expression in gastric cancer.
Previous studies demonstrated that RREB1 was necessary for UMUC-3 cell proliferation [Citation14], and it activated various Ras-related molecules [Citation15,Citation19]. The present study demonstrated that RREB1 knockdown inhibited cell proliferation, and this effect may rely on p16. However, we demonstrated that RREB1 overexpression had no significant effect on cell proliferation, which may be attributed to the complex role of RREB1. Previous studies demonstrated that RREB1 promoted Ras-related protein expression and bound to the p53 promoter to increase p53 transcription [Citation20]. Rahrmann [Citation21] also demonstrated that in B-cell lymphoma, knockdown of RREB1 inhibited cell proliferation, but the overexpression of RREB1 had no effect on cell growth. In our study, we showed the same effect of RREB1 on cell proliferation as Rahrmann. However, the underlying mechanism may need further exploration.
The tumor suppressor proteins p16 and RB1 were well studied in a previous study and are deregulated in most human cancers [Citation22]. The role of p16 in gastric cancer is complex [Citation23,Citation24], and p16 serves as a tumor suppressor by inhibiting the induction of G0/G1 cell cycle arrest [Citation25]. In our study we found that p16 is negatively related with RREB1 and knockdown of RREB1 inhibit cell proliferation maybe relay on increasing p16 expression.
The present study demonstrated that RREB1 is an oncogene in the development of gastric cancer and is associated with cell proliferation. These results provide new insight into the treatment of gastric cancer and may be useful for finding drugs that can target Ras-related pathways.
Availability of data and materials
The datasets generated and/or analyzed during the current study are available from the corresponding author on reasonable request.
Authors’ contributions
Qi Gao and Yunhua Wu designed the study and wrote the manuscript. Chaoxiang Lu, Wang Kai and Weike Xie primarily performed the experiments, wrote the manuscript and prepared the figures. Qi Wang, Li Wang and Shiqi Liu made substantial contributions to the acquisition and analysis of data. Yongkang Pan made contributions to the analysis and interpretation of data, and revised the manuscript. All authors read and approved the final manuscript.
Ethics approval and consent to participate
Ethical approval for this study was obtained from the Medical Ethics Committee of the Jiaotong University. Patients provided written informed consent prior to sample collection. Animal experiments were approved by the Animal Committee of Xi’an Jiaotong University Health Science Center and all protocols were performed in accordance with Institutional Animal Care and Use Committee guidelines.
Disclosure statement
The authors declare that they have no competing interests.
Additional information
Funding
References
- Wang FH, Shen L, Li J, et al. The Chinese Society of Clinical Oncology (CSCO): clinical guidelines for the diagnosis and treatment of gastric cancer. Cancer Commun (Lond). 2019;39(1):10.
- Banks M, Graham D, Jansen M, et al. British society of gastroenterology guidelines on the diagnosis and management of patients at risk of gastric adenocarcinoma. Gut. 2019;68(9):1545–1575.
- Hanahan D, Weinberg RA. Hallmarks of cancer: the next generation. Cell. 2011;144(5):646–674.
- Huang Y, Wei J, Liu BR. [Research advances of K-ras mutation in the prognosis and targeted therapy of gastric cancer]. Zhonghua Zhong Liu Za Zhi. 2016;38(2):81–85.
- Oxford G, Smith SC, Hampton G, et al. Expression profiling of Ral-depleted bladder cancer cells identifies RREB-1 as a novel transcriptional Ral effector. Oncogene. 2007;26(50):7143–7152.
- Thiagalingam A, De Bustros A, Borges M, et al. RREB-1, a novel zinc finger protein, is involved in the differentiation response to Ras in human medullary thyroid carcinomas. Mol Cell Biol. 1996;16(10):5335–5345.
- Zhang S, Qian X, Redman C, et al. p16 INK4a gene promoter variation and differential binding of a repressor, the ras-responsive zinc-finger transcription factor, RREB. Oncogene. 2003;22(15):2285–2295.
- Kent OA, Fox-Talbot K, Halushka MK, et al. RREB1 repressed miR-143/145 modulates KRAS signaling through downregulation of multiple targets. Oncogene. 2013;32(20):2576–2585.
- Hui B, Ji H, Xu Y, et al. RREB1-induced upregulation of the lncRNA AGAP2-AS1 regulates the proliferation and migration of pancreatic cancer partly through suppressing ANKRD1 and ANGPTL4. Cell Death Dis. 2019;10(3):207.
- Su J, Morgani SM, David CJ, et al. TGF-β orchestrates fibrogenic and developmental EMTs via the Ras effector RREB1. Nature. 2020;577(7791):566–571.
- Kent OA, Saha M, Coyaud E, et al. Haploinsufficiency of RREB1 causes a Noonan-like RASopathy via epigenetic reprogramming of RAS-MAPK pathway genes. Nat Commun. 2020;11(1):4673.
- Deng YN, Xia Z, Zhang P, et al. Transcription factor RREB1: from target genes towards biological functions. Int J Biol Sci. 2020;16(8):1463–1473.
- Yu JH, Zheng JB, Qi J, et al. Bile acids promote gastric intestinal metaplasia by upregulating CDX2 and MUC2 expression via the FXR/NF-κB signalling pathway. Int J Oncol. 2019;54(3):879–892.
- Nitz MD, Harding MA, Smith SC, et al. RREB1 transcription factor splice variants in urologic cancer. Am J Pathol. 2011;179(1):477–486.
- Zou J, Milon BC, Desouki MM, et al. hZIP1 zinc transporter down-regulation in prostate cancer involves the overexpression of ras responsive element binding protein-1 (RREB-1). Prostate. 2011;71(14):1518–1524.
- Ju, M , Wang, SC, and Syed, C et al Multidisciplinary teams improve gastric cancer treatment efficiency at a large safety net hospital[J]. Ann Surg Onco. 2020;27(3):645–650.
- Ramos, M , Pereira, M, and Oliveira, Y S et al Surgical results of remnant gastric cancer treatment[J]. Rev Col Bras Cir. 2020;47(1):e20202703.
- Franklin RB, Feng P, Milon B, et al. hZIP1 zinc uptake transporter down regulation and zinc depletion in prostate cancer. Mol Cancer. 2005;4(1):32.
- Date S, Nibu Y, Yanai K, et al. Finb, a multiple zinc finger protein, represses transcription of the human angiotensinogen gene. Int J Mol Med. 2004;13(5):637–642.
- Liu H, Hew HC, Lu ZG, et al. DNA damage signalling recruits RREB-1 to the p53 tumour suppressor promoter. Biochem J. 2009;422(3):543–551.
- Rahrmann EP, Wolf NK, Otto GM, et al. Sleeping beauty screen identifies RREB1 and other genetic drivers in human B-cell lymphoma. Mol Cancer Res. 2019;17(2):567–582.
- Sen M, Akeno N, Reece A, et al. p16 controls epithelial cell growth and suppresses carcinogenesis through mechanisms that do not require RB1 function. Oncogenesis. 2017;6(4):e320.
- Liu Q, Song LJ, Xu WQ, et al. Expression of cytoplasmic p16 and anion exchanger 1 is associated with the invasion and absence of lymph metastasis in gastric carcinoma. Mol Med Rep. 2009;2(2):169–174.
- Xu WQ, Song LJ, Liu Q, et al. Expression of anion exchanger 1 is associated with tumor progress in human gastric cancer. J Cancer Res Clin Oncol. 2009;135(10):1323–1330.
- Guo T, Chai X, Liu Q, et al. Downregulation of P16 promotes cigarette smoke extract-induced vascular smooth muscle cell proliferation via preventing G1/S phase transition. Exp Ther Med. 2017;14(1):214–220.