
ABSTRACT
The dysregulation of circular RNAs (circRNAs) facilitates the tumorigenesis of papillary thyroid carcinoma (PTC). This study was targeted at determining the functions and mechanism of circ_0000644 in regulating PTC development. Circ_0000644, microRNA-1205 (miR-1205) and E2F transcription factor 3 (E2F3) expressions were detected by quantitative real-time polymerase chain reaction (qRT-PCR). Actinomycin D (ActD) and Ribonuclease R (RNase R) assays were used to verify the circular characteristic of circ_0000644. After circ_0000644 was knocked down, PTC cell growth, migration, invasion and apoptosis were assessed by cell counting kit-8 (CCK-8) assay, Transwell assay and flow cytometry analysis, respectively. The regulating relationships among circ_0000644, E2F3 and miR-1205 were confirmed through RNA immunoprecipitation (RIP) assay and dual-luciferase reporter assay. Besides, the regulatory effects of circ_0000644 on the protein level of E2F3 was analyzed via Western blot. In PTC, circ_0000644 was highly expressed, and it was located mainly in the cytoplasm, and it had stable structure. The knockdown of circ_0000644 repressed PTC cell growth, migration, and invasion, and facilitated apoptosis. Circ_0000644 could directly interact with miR-1205 to repress the expression of miR-1205, and it served as a miR-1205 sponge to modulate E2F3 expression in PTC cells. Circ_0000644 up-regulates E2F3 expression via sponging miR-1205 to promote PTC progression.
1 Introduction
Known as a common malignancy in the endocrine system, thyroid cancer makes up 1% to 2% of the total of cancer cases; over the past few decades, the incidence rate of thyroid cancer has risen rapidly [Citation1]. Papillary thyroid carcinoma (PTC), the main pathological type of thyroid cancer, accounts for over 80% of all thyroid cancer cases [Citation2]. Although most PTC patients have long-term survival, the therapy fails for a certain percentage of PTC patients [Citation3,Citation4]. Therefore, it is crucial to study the potential mechanism of PTC and develop more effective treatment strategies.
Circular RNAs (circRNAs) are a kind of endogenous non-coding RNA (ncRNA) with a covalent closed-loop structure and without 5ʹ to 3ʹ polarity and the poly(A) tail [Citation5]. Due to the circular structure, it is not easy for them to be degraded by exonuclease RNase R, and circRNAs are more stable than linear RNA transcripts [Citation6]. Reportedly, circRNAs are pivotal regulators in tumorigenesis and cancer progression [Citation7]. For example, circ-HuR is lowly expressed in gastric carcinoma cells and tissues, and it down-regulates HuR expression by interacting with CNBP, thus inhibiting gastric cancer progression [Citation8]; circ_0014717 suppresses colorectal cancer cell growth and colony formation, and induces G0/G1 cell cycle arrest, by up-regulating p16 expression [Citation9]. Furthermore, abnormally expressed circRNAs participate in PTC progression, such as circ-ITCH [Citation10] and circ_0039411 [Citation11]. By analyzing the circRNA microarray dataset GSE93522, this study found that hsa-circ_0000644 (circ_0000644) expression was potentially dysregulated in PTC tissues. By querying the circBase database (http://www.circbase.org), we found that circ_0000644 was generated by reverse splicing of the KIAA1199 transcript. It is reported that KIAA1199 is highly expressed in PTC tissues and it can promote the invasion of PTC cells [Citation12]. However, the function and mechanism of circ_0000644 in the PTC remains unclear.
MicroRNAs (miRNAs) are a type of non-coding RNA, with 20–22 nucleotides in length, and they can modulate gene expression through binding to the target mRNA’s 3ʹ-untranslated region (3ʹ-UTR) [Citation13–16]. It is well documented that miR-1205 plays a cancer-suppressing role in various cancers. For example, miR-1205 serves as a tumor suppressor in non-small cell lung carcinoma [Citation17]; it also inhibits PTC progression by targeting MTA1 [Citation11]. Besides, E2F transcription factor 3 (E2F3) is a transcriptional activator which can regulate cell cycle, proliferation and apoptosis [Citation18]. It is reported that, circPRMT5 up-regulates E2F3 expression by targeting miR-30 c, thereby facilitating PTC cell proliferation and invasion [Citation19].
In the current study, we aimed to investigate the role and mechanism of circ_0000644 in PTC. We found that circ_0000644 was highly expressed in PTC, and it facilitated PTC development via regulating the miR-1205/E2F3 axis. The results suggest that circ_0000644 may have the potential to be a diagnostic biomarker and therapeutic target of PTC.
2 Materials and methods
2.1 Clinical samples
The current study got the approval of the Ethics Committee of Harbin Medical University Cancer Hospital, and the written informed consent of all participants was obtained. A total of 46 pairs of human PTC tissues and the corresponding para-cancerous tissues were collected from patients diagnosed with PTC in Harbin Medical University Cancer Hospital from 2018 to 2020. None of the participants had undergone radiotherapy, chemotherapy or other anti-cancer therapies prior to surgery. The tissues were conserved at −80°C to prevent RNA loss.
2.2 Cell culture and treatment
Normal human Thyroid epithelial cell line (Nthy-ori3-1) and PTC cell lines (IHH4, TPC-1, FTC-133, and SW579) were obtained from the Shanghai Institute of Cell Biology (Shanghai, China). These cells were all cultured in Dulbecco’s modified Eagle’s medium (DMEM; Hyclone, Logan, UT, USA) with 10% fetal bovine serum (FBS; Sigma, St. Louis, MO, USA), streptomycin (0.1 mg/ml) and penicillin (100 U/ml) in a humidified incubator containing 5% CO2 and 95% O2 at 37°C.
2.3 Cell transfection
Three small interfering RNAs targeting circ_0000644 (si-circ_0000644#1, si-circ_0000644#2 and si-circ_0000644#3), siRNA negative control (si-NC), miR-1205 mimics, negative control for mimics, miR-1205 inhibitors, negative control for inhibitors, E2F3 overexpression plasmid (E2F3) and empty vector (Vector) were bought from GeneChem Co., Ltd. (Shanghai, China). TPC-1 and SW579 cells were transfected with plasmids or oligonucleotides by Lipofectamine 2000 (Invitrogen, Carlsbad, CA, USA).
2.4 Quantitative real-time polymerase chain reaction (qRT-PCR)
TRIzol reagent (Takara, Dalian, China) was utilized for total RNA extraction from PTC cells and tissues. A Transcriptor Universal cDNA Master kit (Roche, Shanghai, China) was employed to synthesize complementary DNA (cDNA). Then, qRT-PCR was conducted using ABI7500 real-time PCR system (Applied Biosystems, San Francisco, CA, USA) with a SYBR Green PCR Master Mix kit (LMAI Bio, Shanghai, China). The 2−ΔΔCt method was adopted for calculating the relative expression. For RNase R treatment assay, 2 μg of total RNA was incubated for 30 min with or without RNase R (Solarbio, Beijing, China). Next, qRT-PCR was performed to measure circ_0000644 and KIAA1199 mRNA (mKIAA1199) levels. Besides, Oligo (dT)18 primers could only reverse transcribe RNA containing poly (A) tails. Reverse transcription was also performed with oligo (dT)18 primers, and qRT-PCR was used to confirm whether circ_0000644 contained poly (A) tails. U6 and GAPDH acted as the nucleus and cytoplasm controls, respectively. The primer sequences for PCR are as follows (F: forward; R: reverse): circ_0000644: 5ʹ-TCCTTGAACATGCCTTTGCT-3ʹ (F), 5ʹ-ATGAACCCACAGGAGTTGGA-3ʹ (R); KIAA1199: 5ʹ-CCAGGAATGTTGAATGTCT-3ʹ (F), 5ʹ-ATTGGCTCTTGGTGAATG-3ʹ (R); E2F3: 5ʹ-AAGAAGAAGTCTAAAAACAACGTCCAA-3ʹ (F), 5ʹ-CTTGACACTGGGCCAGCAT-3ʹ (R); GAPDH: 5ʹ-GGGAAACTGTGGCGTGAT-3ʹ (F), 5ʹ-GAGTGGGTGTCGCTGTTGA-3ʹ (R); miR-1205: 5ʹ-CACGCATCTGCAGGGTTT-3ʹ (F), 5ʹ-CCAGTGCAGGGTCCGAGGTA-3ʹ (R); U6: 5ʹ-GAC CTC ACC CTG TAC CAG TC-3ʹ (F), 5ʹ-ATG GTC ACT TAC GCA GGA GG-3ʹ (R). U6 or GAPDH was regarded as the internal reference. To identify the subcellular localization of circ_0000644, A Cytoplasmic & Nuclear RNA Purification Kit (Norgen, Thorold, Canada) was utilized for isolating the cytoplasm and nucleus RNA of SW579 and TPC-1 cells. Afterward, qRT-PCR was carried out for examining the expressions of circ_0000644, GAPDH and U6 in cell cytoplasm and nucleus.
2.5 Nucleic acid electrophoresis
First, cDNA or genomic DNA (gDNA) was extracted from cells using specific convergent or divergent primers designed for circ_0000644, KIAA1199 or GAPDH as the control. Agarose gel and Tris-EDTA (TE) buffer (Thermo Scientific, Waltham, MA, USA) were applied for the detection of qRT-PCR products, with DL600 (KeyGen, Nanjing, China) as the DNA marker. qRT-PCR products were separated by electrophoresis, followed by ultraviolet irradiation.
2.6 Actinomycin d assay
SW579 and TPC-1 cells were transferred at 1 × 10⁵ cells/well into 6-well plates overnight and then exposed to the Actinomycin D (2 μg/ml; Sigma, St. Louis, MO, USA) for 8, 16 and 24 h. At the indicated time points, the cells were collected, and the stability of levels of circ_0000644 were analyzed through qRT-PCR.
2.7 Cell counting kit-8 (CCK-8) assay
Transfected PTC cells were transferred at 1 × 10⁵ cells/ml to 96-well plates. Each well was added with 10 μL of CCK-8 solution (Dojindo, Kumamoto, Japan) after culturing for 12, 24, 48, 72, and 96 h, respectively. After 2 h of incubation, the absorbance of the wells at 450 nm wavelength was measured using a microplate reader (Bio-Rad, Hercules, CA, USA).
2.8 Transwell assays
First, approximately 1 × 10⁴ transfected cells were suspended in 200 μL of serum-free medium and then transferred to the top chamber of Transwell system (pore size of 8 μm; Costar, Cambridge, MA, USA). For the invasion and migration assays, the upper chamber was coated with or without Matrigel (BD Biosciences, Franklin Lakes, NJ, USA), respectively, and the lower compartment was added with medium containing 10% FBS as a chemoattractant. The cells were cultured at 37°C in 5% CO2 for 24 h in the migration assay and for 48 h in the invasion assay. After that, cotton swabs were employed for removing the cells in the upper chamber. The cells on the lower surface of the filter were fixed with methanol, stained with 0.1% crystal violet and photographed under a microscope (Olympus, Tokyo, Japan) at ×100 magnification.
2.9 Flow cytometry for apoptosis
The apoptosis assay was conducted with the Annexin V-FITC Apoptosis Detection Kit (Invitrogen, Carlsbad, CA, USA). To be specific, after trypsinization, SW579 and TPC-1 cells were washed with cold phosphate buffer saline (PBS). Annexin V-FITC staining solution was added to stain the cells (1 × 10⁶ cells/ml) which were resuspended in 100 μL of binding buffer. Then, the cells were incubated with propidium iodide (PI) staining solution for 20 min in the dark at room temperature. After the cells were washed by PBS, a flow cytometer (BD Biosciences, San Jose, CA, USA) was used to count the apoptotic cells.
2.10 Dual-luciferase reporter assay
Circ_0000644 or E2F3 3ʹ-UTR with the miR-1205 binding sequence was cloned into the pmirGLO vectors (Promega, Madison, WI, USA) to construct the wild-type luciferase reporter vectors (E2F3-WT or circ_0000644-WT). The binding site was mutated to generate the mutant luciferase reporter vectors (E2F3-MUT or circ_0000644-MUT). Then, Lipofectamine 2000 (Invitrogen, Carlsbad, CA, USA) was employed to co-transfect the above reporter vectors and miR-1205 mimics or NC mimics into SW579 and TPC-1 cells. After 48 h, dual-luciferase reporter assay system (Promega, Madison, WI, USA) was adopted for determining the luciferase activity.
2.11 RNA immunoprecipitation (RIP) assay
A Magna RIP RNA-binding protein immunoprecipitation kit (Millipore, Billerica, MA, USA) was utilized to perform RIP analysis. In brief, after 48 h of cell transfection, SW579 and TPC-1 cells were lysed with RIP lysis buffer. Subsequently, the cell lysate was incubated with the magnetic beads conjugated with Immunoglobulin G antibody (Anti-IgG) or Argonaute-2 antibody (Anti-Ago2) for 8 h at 4°C. After the immunoprecipitate was obtained, it was incubated with Proteinase K to remove the proteins in the complex, and subsequently the RNA was isolated and purified. Next, qRT-PCR was performed to determine the enrichment of circ_0000644 and miR-1205.
2.12 Western blot
RIPA buffer (Beyotime, Shanghai, China) was employed to extract the total protein from cells, and a BCA kit (Pierce, Rockford, IL, USA) was then used for protein quantification. Equal protein samples (20 μg per lane) were transferred onto polyvinylidene fluoride membranes after sodium dodecyl sulfate polyacrylamide gel electrophoresis. The membranes were then blocked for 2 h at room temperature with tris buffered saline tween (TBST) containing 5% skim milk. After being washed by TBST three times, the membranes were then incubated overnight with primary antibodies against E2F3 (1:1000, ab152126, Abcam, Shanghai, China) and GAPDH (1:1000, ab9458, Abcam, Shanghai, China) at 4°C. The next day, the membranes were rinsed with TBST again and then incubated with HRP-conjugated secondary antibody (1:2000, ab205718, Abcam, Shanghai, China) for 2 h at room temperature. Ultimately, the protein bands were developed using the ECL reagent (Solarbio, Beijing, China). The gray values of the protein bands were quantified by ImageJ software (NIH, Bethesda, Maryland, USA).
2.13 Statistical analysis
Each experiment was carried out in triplicate, and repeated independently of 3 times. Measurement data expressed as mean ± standard deviation were analyzed employing SPSS 19.0 software (SPSS Inc., Chicago, IL, USA). Pearson’s correlation analysis was conducted for analyzing the correlation of the expression levels of two genes. Student’s t-test or one-way ANOVA was performed to analyze the differences between two groups or among at least three groups, respectively. Chi-square test was utilized to evaluate the association between the expression level of circ_0000644 and the pathological characteristics of the patients. The difference was of statistical significance when P< 0.05.
3 Results
3.1 Circ_0000644 expression was enhanced in PTC cells and tissues
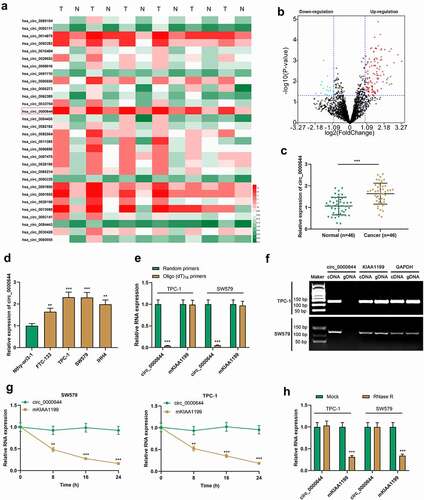
The GSE93522 dataset was obtained from the Gene Expression Omnibus (GEO) database. With GEO2R analysis, a total of 137 differentially expressed circRNAs (|log2 FC|>1, P< 0.05) were screened out, of which 22 circRNAs expressions were down-regulated and 115 circRNAs expressions were up-regulated in PTC tissues . Circ_0000644, with the most significant change of expression, was selected for follow-up research . Circ_0000644 expression in 46 pairs of cancerous tissues and para-cancerous tissues was then examined through qRT-PCR, and it was revealed that circ_0000644 in PTC tissues was highly expressed as against para-cancerous tissues . Moreover, circ_0000644 expression was linked to the lymph node metastasis and larger tumor size of PTC patients (). It was also revealed that, circ_0000644 expression was markedly up-regulated in PTC cell lines compared with that in Nthy-ori3-1 cells, with the highest expression in SW579 and TPC-1 cells . Therefore, TPC-1 and SW579 cells were selected for subsequent research. To confirm the circular characterization of circ_0000644, we performed qRT-PCR using either random primers or oligo (dT)18 primers. The results showed that the relative expression of circ_0000644 was significantly decreased in TPC-1 and SW579 cells when oligo (dT)18 primers were used compared with random primers, while KIAA1199 expression was not significantly changed . Additionally, fragment between the divergent primers of circ_0000644 could be amplified in the cDNA group, but not in the gDNA group . Next, Actinomycin D treatment assay was used for verifying circ_0000644 stability, and it was revealed that circ_0000644 was more stable than KIAA1199 in SW579 and TPC-1 cells . Furthermore, circ_0000644 was resistant to RNase R whereas RNase R could degrade KIAA1199 . These data supported that circ_0000644 had a circular structure.
Table 1. Correlation between circ_0000644 expression and clinicopathological characteristics of 46 PTC patients
Figure 1. Circ_0000644 was highly expressed in PTC tissues and cells (a) Heat map showed the 30 up-regulated circRNAs expressions with top significance. (b) Differentially expressed circRNAs in PTC tissues compared with normal tissues in GSE93522 with log2 FC>1 or <-1 and P< 0.05. (c) Circ_0000644 expression in 46 pairs of PTC tissues and adjacent tissues was detected by qRT-PCR. (d) Circ_0000644 expression in PTC cells and Nthy-ori3-1 cells was detected by qRT-PCR. (e) The relative expressions of circ_0000644 and KIAA1199 in TPC-1 and SW579 cells were analyzed by qRT-PCR with random primers and oligo (dT)18 primers. (f) The qRT-PCR products of circ_0000644 and linear KIAA1199 were tested by agarose gel electrophoresis. (g) The relative expressions of circ_0000644 and KIAA1199 in TPC-1 and SW579 cells were analyzed by qRT-PCR after treatment with Actinomycin D at the indicated time points. (h) The relative expressions of circ_0000644 and KIAA1199 in TPC-1 and SW579 cells were assessed by qRT-PCR after treatment with RNase R. **P< 0.01 and ***P< 0.001.
3.2 Circ_0000644 knockdown suppressed PTC cell growth, migration and invasion, and induced the apoptosis
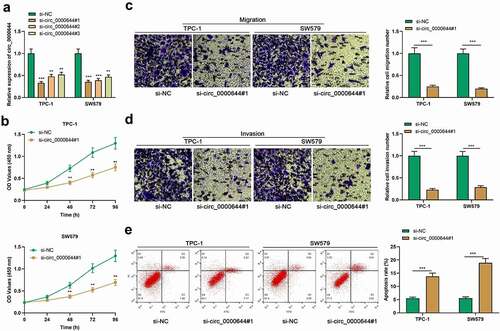
To expound the functions of circ_0000644 in PTC cells, three siRNAs targeting circ_0000644 were transfected into TPC-1 or SW579 cells to construct an in-vitro cell model with low circ_0000644 expression. qRT-PCR assay indicated that as opposed to the si-NC group, the knockdown efficiency of si-circ_0000644#1 was the most significant . Therefore, si-circ_0000644#1 was selected for subsequent research. The data of CCK-8 assay, Transwell assay and flow cytometry suggested that knocking down circ_0000644 inhibited TPC-1 and SW579 cell growth, migration and invasion, and promoted the apoptosis . The aforementioned findings suggested that circ_0000644 might play a cancer-promoting role in PTC.
Figure 2. Circ_0000644 knockdown inhibited PTC cell proliferation, migration and invasion, and induced the apoptosis (a) qRT-PCR was used to detect circ_0000644 expression in TPC-1 and SW579 cells transfected with si-NC or si-circ_0000644. (b) CCK-8 assay was used to detect TPC-1 and SW579 cell proliferation after knocking down circ_0000644. (c-d) Transwell assays were used to detect the migration and invasion of TPC-1 and SW579 cells after knocking down circ_0000644. (e) Flow cytometry was used to detect the apoptosis of TPC-1 and SW579 cells after knocking down circ_0000644. **P< 0.01 and ***P< 0.001.
3.3 Circ_0000644 functioned as a molecular sponge for miR-1205 in PTC cells
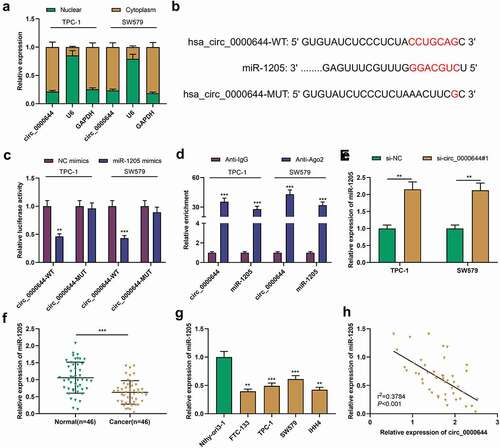
Reportedly, circRNAs, which are located in the cytoplasm, can serve as miRNAs sponges [Citation20]. Circ_0000644 was located mainly in PTC cell cytoplasm . To pinpoint the potential regulating mechanism of circ_0000644 in PTC progression, we predicted the possible target miRNAs of circ_0000644 with CircInteractome database (https://circinteractome.nia.nih.gov/). It was revealed that there existed a complementary binding sequence between miR-1205 and circ_0000644 . To verify the targeted relationship between miR-1205 and circ_0000644, a dual-luciferase reporter gene assay was conducted. It showed that the transfection of miR-1205 mimics could remarkably reduce the luciferase activity of circ_0000644-WT in SW579 and TPC-1 cells but did not significantly affect the luciferase activity of circ_0000644-MUT . Additionally, RIP assay indicated that in contrast to anti-IgG group, circ_0000644 and miR-1205 were significantly enriched in anti-Ago2 group . qRT-PCR showed that, knocking down circ_0000644 significantly enhanced miR-1205 expression in SW579 and TPC-1 cells . Additionally, miR-1205 was lowly expressed in both PTC tissues and cells . Correlation analysis showed that miR-1205 and circ_0000644 expressions were negatively correlated in PTC tissues . These findings supported that circ_0000644 could function as a molecular sponge for miR-1205.
Figure 3. MiR-1205 was the target of circ_0000644 (a) qRT-PCR was used to detect the expressions of circ_0000644, U6 and GAPDH in the nucleus and cytoplasm of PTC cells. (b) The sequence of circ_0000644 contained the binding site for miR-1205, and the mutated binding site was designed. (c) The dual-luciferase reporter gene assay was used to verify the binding relationship between miR-1205 and circ_0000644. (d) RIP assay was utilized to determine the enrichment of circ_0000644 and miR-1205 in anti-Ago2 group or anti-IgG group. (e) qRT-PCR was used to detect miR-1205 expression in TPC-1 and SW579 cells with circ_0000644 knockdown.(f-g) qRT-PCR was used to detect miR-1205 expression in PTC tissues and cells. (h) Pearson’s correlation analysis was conducted to detect the correlation between miR-1205 and circ_0000644 expressions in PTC tissues. **P< 0.01 and ***P< 0.001.
3.4 The down-regulation of miR-1205 expression reversed the impacts of circ_0000644 knockdown on PTC cells
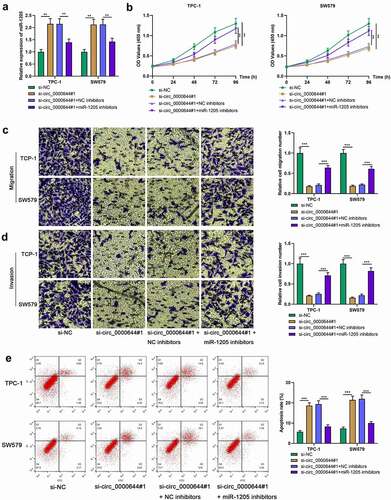
To explore whether miR-1205 was associated with circ_0000644-mediated PTC progression, we transfected miR-1205 inhibitors or NC inhibitors into TPC-1 or SW579 cells with circ_0000644 knockdown, respectively . Furthermore, CCK-8 assay, Transwell assays and flow cytometry were utilized for detecting cell growth, migration, invasion and apoptosis, and it was revealed that in comparison with those in the si-circ_0000644#1+ NC inhibitors group, the cell growth, migration and invasion in the si-circ_0000644#1+ miR-1205 inhibitors group was remarkably enhanced while the apoptosis was significantly reduced . The aforementioned results revealed that circ_0000644 could boost PTC cell growth, migration and invasion and repress the apoptosis via inhibiting miR-1205 expression.
Figure 4. Circ_0000644 promoted PTC cell proliferation, migration and invasion, and inhibited cell apoptosis by targeting miR-1205 TPC-1 and SW579 cells were transfected with si-circ_0000644 or co-transfected with si-circ_0000644 and miR-1205 inhibitors. (a). qRT-PCR was used to detect miR-1205 expression in TPC-1 and SW579 cells. (b) CCK-8 assay was used to detect the proliferation of TPC-1 and SW579 cells. (c-d) Transwell assays were used to detect the migration and invasion of TPC-1 and SW579 cells. (e) The apoptosis of TPC-1 and SW579 cells was detected by flow cytometry. **P< 0.01 and ***P< 0.001.
3.5 Circ_0000644 up-regulated E2F3 expression in PTC cells by adsorbing miR-1205
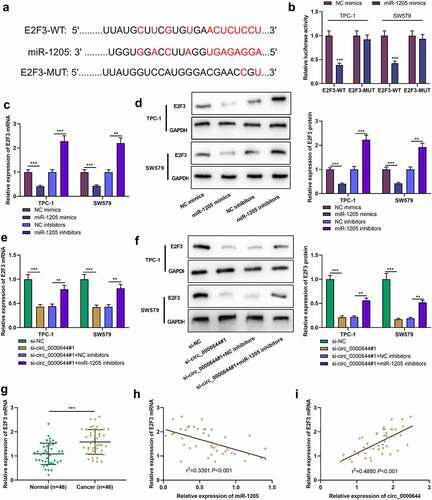
To further clarify the underlying molecular mechanism of the circ_0000644/miR-1205 axis in PTC, the online website TargetScan was searched for predicting the potential target genes of miR-1205, and it was revealed that there existed a binding sequence between miR-1205 and E2F3 mRNA 3ʹ-UTR . Furthermore, dual-luciferase reporter assay indicated that the transfection of miR-1205 mimics could markedly inhibit the luciferase activity of E2F3-WT in SW579 and TPC-1 cells but no significant alteration was observed in E2F3-MUT group , which validated the prediction. qRT-PCR and Western blot indicated that compared with NC mimics, up-regulating miR-1205 expression inhibited E2F3 mRNA and protein expression; compared with NC inhibitors, down-regulating miR-1205 expression worked oppositely . It was also revealed that knocking down circ_0000644 inhibited E2F3 mRNA and protein expression in SW579 and TPC-1 cells, yet the co-transfection of miR-1205 inhibitors counteracted this inhibitory effect . In addition, it was found that E2F3 mRNA expression was notably up-regulated in PTC tissues . Correlation analysis implied that in PTC tissues, E2F3 mRNA expression was negatively correlated with miR-1205 expression and positively correlated with circ_0000644 expression . These findings suggested that in PTC cells, E2F3 was the downstream target of miR-1205, and its expression was negatively and positively regulated by miR-1205 and circ_0000644, respectively.
Figure 5. E2F3 was the downstream target of miR-1205 in PTC cells (a) The sequence of E2F3 3ʹUTR contained the binding site for miR-1205 and the mutant sequence was designed. (b) The dual-luciferase reporter gene assay was used to validate the binding relationship between miR-1205 and E2F3. (c-d) qRT-PCR and Western blot were used to detect the expressions of E2F3 mRNA and protein in TPC-1 and SW579 cells transfected with miR-1205 mimics or inhibitors. (e-f) qRT-PCR and Western blot were used to detect the expressions of E2F3 mRNA and protein in TPC-1 and SW579 cells transfected with si-circ_0000644#1 or co-transfected with si-circ_0000644#1 and miR-1205 inhibitors. (g) E2F3 mRNA expression in PTC tissues and adjacent tissues was detected by qRT-PCR. (h-i) Pearson’s correlation analysis was used to detect the correlation between E2F3 mRNA expression and miR-1205 expression or circ_0000644 expression in PTC tissues. **P< 0.01 and ***P< 0.001.
3.6 E2F3 took part in PTC cell growth, migration, invasion and apoptosis mediated by circ_0000644
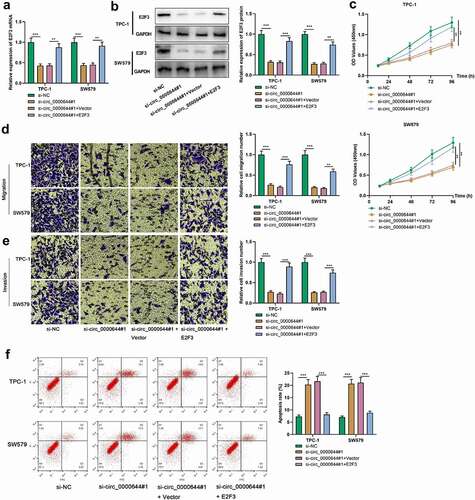
To delve into whether E2F3 played a role in circ_0000644-mediated PTC progression, E2F3 overexpression plasmids were transfected into SW579 and TPC-1 cells with circ_0000644 knockdown. It was found that E2F3 overexpression could reverse the inhibiting impacts of circ_0000644 knockdown on E2F3 mRNA and protein expression . CCK-8 and Transwell assays showed that the cell growth, migration and invasion capabilities in the si-circ_0000644#1+ E2F3 group, compared with the si-circ_0000644#1+ Vector group, were significantly enhanced . Moreover, flow cytometry suggested that E2F3 overexpression could attenuate the promoting effect of circ_0000644 knockdown on apoptosis . The above-mentioned results demonstrated that circ_0000644 took part in PTC development by regulating E2F3 expression.
Figure 6. Overexpression of E2F3 reversed the effects of knocking down circ_0000644 on PTC cell proliferation, migration, invasion and apoptosis TPC-1 and SW579 cells were transfected with si-circ_0000644 or co-transfected with si-circ_0000644 and E2F3 overexpression plasmids. (a-b) qRT-PCR and Western blot were used to detect the expression of E2F3 mRNA and protein in TPC-1 and SW579 cells. (a) CCK-8 assay was used to detect the proliferation of TPC-1 and SW579 cells. (d-e) Transwell assays were used to detect the migration and invasion of TPC-1 and SW579 cells. (A) The apoptosis of TPC-1 and SW579 cells was detected by flow cytometry. **P< 0.01 and ***P< 0.001.
4 Discussion
CircRNAs are widely expressed in human tissues and cells [Citation20]. CircRNAs function importantly in regulating the pathogenesis of multiple diseases, such as diabetes, cardiovascular disease and cancers [Citation21–23]. Reportedly, the abnormal expression of circRNAs is associated with the tumor progression of PTC [Citation23–25]. For instance, circ_0067934 is highly expressed in PTC cells and tissues and can promote PTC progression by promoting epithelial-mesenchymal transition and activating the PI3K/AKT signaling pathway [Citation23]; highly expressed circ_0058124 is related to the poor prognosis of PTC patients and it can promote PTC cell proliferation and invasion by modulating NOTCH3/GATAD2A axis [Citation24]. In this study, it was substantiated that circ_0000644 was highly expressed in PTC tissues and cells. Its high expression was associated with unfavorable pathological characteristics of the patients. Additionally, it was discovered that knocking down circ_0000644 remarkably repressed PTC cell growth, migration and invasion, and induced apoptosis. Therefore, circ_0000644 played a carcinogenic part in PTC occurrence and development.
MiRNAs have been identified as crucial regulators in various biological processes, for example, cell growth, migration, adhesion and differentiation [Citation25]. More than one-third of all human genes are targeted by miRNAs [Citation26]. Furthermore, the role of miRNA in PTC has been extensively studied [Citation27,Citation28]. For instance, miR-148a inhibits PTC cell growth by suppressing STAT3 and PI3K/AKT signal pathways [Citation27]; down-regulating miR-1270 expression represses PTC cell growth and migration by regulating SCAI [Citation28]. Importantly, the sequences of some circRNAs have miRNA response elements (MREs), indicating that circRNAs may serve as miRNA sponges to reduce miRNAs’ expression [Citation29,Citation30]. For instance, circ_0025033 facilitates PTC cell growth and invasion by sponging miR-1231 and miR-1304 [Citation29]; circ_0004458 promotes PTC development by inhibiting miR-885-5p expression and activating RAC1 [Citation30]. In the current study, for the first time we authenticated that circ_0000644 could serve as a molecular sponge of miR-1205 and negatively modulate miR-1205 expression in PTC cells. Furthermore, down-regulating miR-1205 expression could abolish the inhibiting effects of circ_0000644 knockdown on PTC cell growth, migration and invasion, and the promoting effect on apoptosis. It is concluded that the circ_0000644/miR-11205 axis plays a vital role in modulating PTC progression.
E2F transcription factor family includes 8 members (E2F1-8), which can activate the early region 2 (E2) promoter and participate in modulating cell progression, cell growth and cell differentiation [Citation31]. E2F3 is an important regulator in modulating cell cycle and DNA replication [Citation32]; E2F3 belongs to the same subgroup as E2F1 and E2F2, and they synergistically participate in the p16(Ink4a)-cycD/cdk4-Rb-E2F and Arf-mdm2-P53 pathways for regulating cell proliferation and tumorigenesis [Citation33,Citation34]. In melanoma tissues, E2F3 is highly expressed, and the knockdown of E2F3 inhibits melanoma cell growth and induces cell cycle arrest [Citation35]; E2F3 facilitates gastric carcinoma cell migration and invasion via modulating the miR-125a/DKK3 axis [Citation36]. Additionally, E2F3 is targeted, and its expression is regulated by many miRNAs, such as miR-194-5p, miR-432 and miR-210 [Citation37–39]. This study found that E2F3 was the direct target of miR-1205 in PTC cells. Additionally, circ_0000644 could positively modulate E2F3 expression in PTC cells through sponging miR-1205, and E2F3 overexpression counteracted the inhibiting effects of knocking down circ_0000644 on cell growth, migration and invasion, and the promoting impact on the apoptosis. The above-mentioned results suggested that circ_0000644 up-regulated E2F3 expression via sponging miR-1205 to promote PTC progression.
To sum up, our study shows that circ_0000644 is highly expressed in PTC, and its high expression may predict adverse prognosis of the patients. Circ_0000644 up-regulates E2F3 expression through sponging miR-1205 to facilitate the growth, migration and invasion, and restrain the apoptosis of PTC cells. The study deepened the understanding of the molecular mechanism underlying the development of PTC.
Contribution of authors
All of the authors participates in designing the study, performing the experiments, analyzing the data, and preparing the manuscript. All of the authors read and approved the final manuscript.
Statement of data availability
The data used to support the findings of this study are available from the corresponding author upon request.
Statement of ethics
Our study was approved by the Ethics Committee of Harbin Medical University Cancer Hospital.
Disclosure statement
No potential conflict of interest was reported by the author(s).
Additional information
Funding
References
- Wang LY, Ganly I. Post-treatment surveillance of thyroid cancer. Eur J Surg Oncol. 2018 Mar;44(3):357–366.
- Janjua N, Wreesmann VB. Aggressive differentiated thyroid cancer. Eur J Surg Oncol. 2018 Mar;44(3):367–377.
- Chou CK, Liu RT, Kang HY. MicroRNA-146b: A novel biomarker and therapeutic target for human papillary thyroid cancer. Int J Mol Sci. 2017 Mar 15;18(3):636.
- Haugen BR, Alexander EK, Bible KC, et al. 2015 american thyroid association management guidelines for adult patients with thyroid nodules and differentiated thyroid cancer: The american thyroid association guidelines task force on thyroid nodules and differentiated thyroid cancer. Thyroid. 2016 Jan;26(1):1–133.
- Wilusz JE, Sharp PA. Molecular biology. A circuitous route to noncoding RNA. Science. 2013 Apr 26;340(6131):440–441.
- Cai D, Liu Z, Kong G. Molecular and bioinformatics analyses identify 7 circular RNAs involved in regulation of oncogenic transformation and cell proliferation in human bladder cancer. Med Sci Monit. 2018 Mar 20;24:1654–1661.
- Zhou J, Zhou LY, Tang X, et al. Circ-Foxo3 is positively associated with the Foxo3 gene and leads to better prognosis of acute myeloid leukemia patients. BMC Cancer. 2019 Sep 18;19(1):930.
- Yang F, Hu A, Li D, et al. Circ-HuR suppresses HuR expression and gastric cancer progression by inhibiting CNBP transactivation. Mol Cancer. 2019 Nov13;18(1):158.
- Wang F, Wang J, Cao X, et al. Hsa_circ_0014717 is downregulated in colorectal cancer and inhibits tumor growth by promoting p16 expression. Biomed Pharmacother. 2018 Feb;98:775–782.
- Wang M, Chen B, Ru Z, et al. CircRNA circ-ITCH suppresses papillary thyroid cancer progression through miR-22-3p/CBL/β-catenin pathway. Biochem Biophys Res Commun. 2018 Sep 26;504(1):283–288.
- Yang Y, Ding L, Li Y, et al. Hsa_circ_0039411 promotes tumorigenesis and progression of papillary thyroid cancer by miR-1179/ABCA9 and miR-1205/MTA1 signaling pathways. J Cell Physiol. 2020 Feb;235(2):1321–1329.
- Jiao X, Ye J, Wang X, et al. KIAA1199, a Target of MicoRNA-486-5p, promotes papillary thyroid cancer invasion by influencing Epithelial-Mesenchymal Transition (EMT). Med Sci Monit. 2019 Sep 10;25:6788–6796.
- Ding Q, He K, Luo T, et al. SSRP1 contributes to the malignancy of hepatocellular carcinoma and is negatively regulated by miR-497. Mol Ther. 2016 May;24(5):903–914.
- Çakmak HA, Demir M. MicroRNA and cardiovascular diseases. Balkan Med J. 2020 Feb 28;37(2):60–71.
- Li M, Li W, Ren FQ, et al. miRNA-186 improves sepsis induced renal injury Via PTEN/PI3K/AKT/P53 Pathway. Open Med (Wars). 2020 Apr 4;15(1):254–260.
- Wu W, He K, Guo Q, et al. SSRP1 promotes colorectal cancer progression and is negatively regulated by miR-28-5p. J Cell Mol Med. 2019 May;23(5):3118–3129.
- Yan H, Chen X, Li Y, et al. MiR-1205 functions as a tumor suppressor by disconnecting the synergy between KRAS and MDM4/E2F1 in non-small cell lung cancer. Am J Cancer Res. 2019 Feb 1;9(2):312–329.
- Shi F, Deng Z, Zhou Z, et al. QKI-6 inhibits bladder cancer malignant behaviours through down-regulating E2F3 and NF-κB signalling. J Cell Mol Med. 2019 Oct;23(10):6578–6594.
- Xue C, Cheng Y, Wu J, et al. Circular RNA CircPRMT5 accelerates proliferation and invasion of papillary thyroid cancer through regulation of miR-30c/E2F3 Axis. Cancer Manag Res. 2020 May 11;18:3285–3291.
- Ebbesen KK, Kjems J, Hansen TB. Circular RNAs: Identification, biogenesis and function. Biochim Biophys Acta. 2016 Jan;1859(1):254–260.
- Dong W, Bi J, Liu H, et al. Circular RNA ACVR2A suppresses bladder cancer cells proliferation and metastasis through miR-626/EYA4 axis. Mol Cancer. 2019 May 17;18(1):95.
- Hu W, Han Q, Zhao L, et al. Circular RNA circRNA_15698 aggravates the extracellular matrix of diabetic nephropathy mesangial cells via miR-185/TGF-β1. J Cell Physiol. 2019 Feb;234(2):1469–1476.
- Wang H, Yan X, Zhang H, et al. CircRNA circ_0067934 overexpression correlates with poor prognosis and promotes thyroid carcinoma progression. Med Sci Monit. 2019 Feb 19;25:1342–1349.
- Yao Y, Chen X, Yang H, et al. Hsa_circ_0058124 promotes papillary thyroid cancer tumorigenesis and invasiveness through the NOTCH3/GATAD2A axis. J Exp Clin Cancer Res. 2019 Jul 19;38(1):318.
- Sun T, Leung F, Lu WW. MiR-9-5p, miR-675-5p and miR-138-5p damages the strontium and LRP5-Mediated skeletal cell proliferation, differentiation, and adhesion. Int J Mol Sci. 2016 Feb 15;17(2):236.
- Guo J, Miao Y, Xiao B, et al. Differential expression of microRNA species in human gastric cancer versus non-tumorous tissues. J Gastroenterol Hepatol. 2009 Apr;24(4):652–657.
- Xu Y, Han YF, Zhu SJ, et al. miRNA-148a inhibits cell growth of papillary thyroid cancer through STAT3 and PI3K/AKT signaling pathways. Oncol Rep. 2017 Nov;38(5):3085–3093.
- Yi T, Zhou X, Sang K, et al. MicroRNA-1270 modulates papillary thyroid cancer cell development by regulating SCAI. Biomed Pharmacother. 2019 Jan;109:2357–2364.
- Pan Y, Xu T, Liu Y, et al. Upregulated circular RNA circ_0025033 promotes papillary thyroid cancer cell proliferation and invasion via sponging miR-1231 and miR-1304. Biochem Biophys Res Commun. 2019 Mar 5;510(2):334–338.
- Jin X, Wang Z, Pang W, et al. Upregulated hsa_circ_0004458 contributes to progression of papillary thyroid carcinoma by inhibition of miR-885-5p and activation of RAC1. Med Sci Monit. 2018 Aug 7;24:5488–5500.
- Parisi T, Yuan TL, Faust AM, et al. Selective requirements for E2f3 in the development and tumorigenicity of Rb-deficient chimeric tissues. Mol Cell Biol. 2007 Mar;27(6):2283–2293.
- Rodríguez JL, Boukaba A, Sandoval J, et al. Transcription of the MAT2A gene, coding for methionine adenosyltransferase, is up-regulated by E2F and Sp1 at a chromatin level during proliferation of liver cells. Int J Biochem Cell Biol. 2007;39(4):842–850.
- Hurst CD, Tomlinson DC, Williams SV, et al. Inactivation of the Rb pathway and overexpression of both isoforms of E2F3 are obligate events in bladder tumours with 6p22 amplification. Oncogene. 2008 Apr 24;27(19):2716–2727.
- Vimala K, Sundarraj S, Sujitha MV, et al. Curtailing overexpression of E2F3 in breast cancer using siRNA (E2F3)-based gene silencing. Arch Med Res. 2012 Aug;43(6):415–422.
- Feng Z, Peng C, Li D, et al. E2F3 promotes cancer growth and is overexpressed through copy number variation in human melanoma. Onco Targets Ther. 2018 Aug 30;11:5303–5313.
- Pei Y, Tang Z, Cai M, et al. The E2F3/miR-125a/DKK3 regulatory axis promotes the development and progression of gastric cancer. Cancer Cell Int. 2019 Aug 13;19(1):212.
- Wang T, Du M, Zhang W, et al. MicroRNA-432 suppresses invasion and migration via E2F3 in nasopharyngeal carcinoma. Onco Targets Ther. 2019 Dec 19;19:11271–11280.
- Wang Y, Sun G, Wang C, et al. MiR-194-5p inhibits cell migration and invasion in bladder cancer by targeting E2F3. J BUON. 2018 Sep-Oct;23(5):1492–1499.
- Sun FB, Lin Y, Li SJ, et al. MiR-210 knockdown promotes the development of pancreatic cancer via upregulating E2F3 expression. Eur Rev Med Pharmacol Sci. 2018 Dec;22(24):8640–8648.