
ABSTRACT
Cornelia de Lange syndrome (CdLS) and Roberts syndrome (RBS) are severe developmental maladies that arise from mutation of cohesin (including SMC3, CdLS) and ESCO2 (RBS). Though ESCO2 activates cohesin, CdLS and RBS etiologies are currently considered non-synonymous and for which pharmacological treatments are unavailable. Here, we identify a unifying mechanism that integrates these genetic maladies to pharmacologically-induced teratogenicity via thalidomide. Our results reveal that Esco2 and cohesin co-regulate the transcription of a component of CRL4 ubiquitin ligase through which thalidomide exerts teratogenic effects. These findings are the first to link RBS and CdLS to thalidomide teratogenicity and offer new insights into treatments.
Introduction
Thalidomide was an over-the-counter drug used to relieve morning sickness during pregnancy, among other uses in the late 1950s, which lead to a suite of birth defects that include phocomelia, organ malformation, craniofacial abnormalities, and intellectual disabilities [Citation1]. These teratogenic effects result from inhibition of Cullin4 Ring Ligase (CRL4), the most common E3 ubiquitin ligase in eukaryotes and which contains Cullin4 (CUL4), DNA Damage Binding Protein 1 (DDB1), and DDB1-CUL4-Associated Factor (DCAF) Cereblon (CRBN) [Citation2,Citation3]. Inhibition of CRL4 function is solely responsible for thalidomide teratogenicity: 1) development proceeds normally upon thalidomide exposure in zebrafish embryos expressing thalidomide-resistant CRL4 and 2) mutation of CRL4 subunits are sufficient to produce embryonic damage and intellectual disabilities [Citation4]. Roberts syndrome (RBS) and Cornelia de Lange syndrome (CdLS) are severe genetic maladies in which manifestations highly resemble those observed in thalidomide babies [Citation5,Citation6]. RBS arises through mutation of ESCO2 while CdLS arises through mutation of cohesin subunits (including SMC1, SMC3, and RAD21) and regulators (NIPBL and HDAC) [Citation6]. ESCO2 acetylates SMC3 to activate cohesin. Despite the direct link between ESCO2 and SMC3, CdLS and RBS etiologies are currently considered non-synonymous and for which pharmacological access is largely unavailable. Here, we document that Smc3 and Esco2 knockdowns (KDs) in zebrafish embryos provide robust models for CdLS and RBS and identify a unifying mechanism that integrates these genetic maladies to the pharmacologically-induced teratogenicity produced by thalidomide. Our results reveal that Esco2 and cohesin co-regulate ddb1 transcription, which is a key component of CRL4 ubiquitin ligase through which thalidomide exerts teratogenic effects. Importantly, Ddb1 KD embryo phenotypes overlap with Smc3 KD and Esco2 KD embryos and exogenous ddb1 expression rescues developmental defects that otherwise arise in Smc3 KD embryos. These findings are the first to directly link both RBS and CdLS to thalidomide teratogenicity and transform current notions of cohesinopathies.
Results & discussion
Conservation of phenotypes derived from Esco2 (RBS) and Smc3 (CdLS) KDs, and thalidomide exposure, in zebrafish embryos
Esco2 acetyltransferase activates cohesin through acetylation of the cohesin subunit Smc3 [Citation7–9]. The prevailing models of RBS (mutated ESCO2) and CdLS (mutated cohesin, including SMC3, and cohesin regulators), however, are quite different. Based on the initial discovery that Ctf7/Eco1 (herein Eco1, the homolog of human ESCO2) is critical for chromosome segregation [Citation10–12], and that mutations in ESCO2 lead to increase mitotic failure and apoptosis [Citation6,Citation13–16], the prevailing model for RBS is based on mitotic failure that leads to proliferative stem cell loss [Citation16,Citation17]. In contrast, CdLS cells typically do not exhibit increased mitotic failure or apoptosis, even though CdLS arises due to cohesin pathway gene mutations [Citation6,Citation18]. NIPBL (homolog of drosophila nipped-B and yeast Scc2) mutation produces the highest incidence of CdLS and early studies documented that NIPBL plays a critical role in transcription regulation [Citation19,Citation20]. This and other findings led to the prevailing model of CdLS as one of transcription dysregulation [Citation6,Citation18]. The phenotypic similarities between both RBS and CdLS genetic maladies, and the pharmacologically-induced birth defects that result from in utero exposure to thalidomide, however, made it important to test whether all three are directly linked.
To address the role of Esco2 and cohesins in developing zebrafish embryos, we used previously well-characterized esco2 and smc3-targetting morpholinos (MOs) [Citation13,Citation21,Citation22]. Targeted protein KDs of Esco2 and Smc3 were independently validated in the current study as well by Western blot of lysates obtained from MO-injected embryos, compared to lysates from standard control (SC) MO injected embryos. A significant reduction of Esco2 and Smc3 protein levels in 24 hpf embryos were obtained with esco2-ATG MO and smc3-ATG MO respectively (Fig S1 a, b). These findings extend the previously validated target specificity and KD efficacy of both MOs [Citation13,Citation21,Citation22].
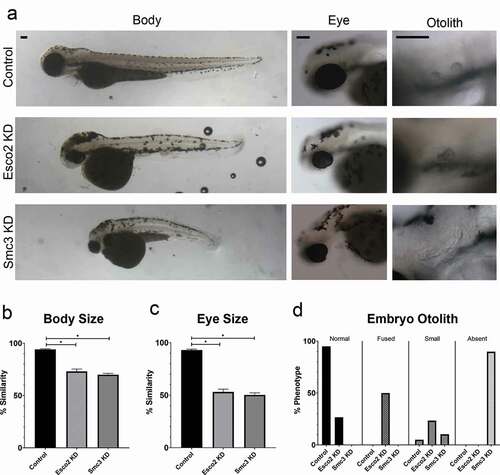
We next assessed the effect of Esco2 KD and Smc3 in developing zebrafish embryos compared to the SC-MO that does not recognize target genes in zebrafish. MO injections were performed at the 1-cell stage and embryo phenotypes were assessed at 72 hours post fertilization (hpf). esco2 MO injected embryos exhibited defects that include shorter body length ()), smaller eye size ()) and abnormal otolith development (, compared to SC MO injected embryos. These phenotypes are consistent with the short stature phenotypes, and vision and hearing losses observed in RBS patients. Note that these phenotypes are also consistent with those previously observed in embryos injected with esco2-directed MOs and by esco2 mutations in zebrafish [Citation13,Citation15,Citation23]. Compared to SC MO, smc3 MO injected embryos also exhibited smaller body size (, reduced eye size (), and a notable absence of otoliths within the otic vesicle (, consistent with analogous phenotypes present in CdLS patients. Critically, the phenotypes obtained by smc3-directed MO are consistent with transgenic zebrafish lines deficient for rad21 or smc1a cohesin subunits and also embryos injected with rad21-directed MOs or smc3-directed MOs [Citation24–28]. In combination, these results document that both Esco2 and cohesin are critical for proper craniofacial and body development in zebrafish embryos and that MO-based strategies provide for robust zebrafish models of RBS and CdLS phenotypes.
Figure 1. Esco2 KD and Smc3 KD phenotypes include reduced body and eye size, and an increase in abnormal otolith development. (a) Representative images of control embryos (SC MO injected), Esco2 KD (esco2-ATG MO injected) and Smc3 KD (smc3-ATG MO injected) embryos. For all experiments 24–40 replicates were analyzed and at least 3 independent trials were performed. (b) Quantification of body size from MO injected embryos were compared to un-injected WT embryos to obtain percent similarity. Graph reveals significant reductions of body length in Esco2 KD and Smc3 KD compared to control embryos (error bars represent s.e.m., one-way ANOVA with Turkey’s multiple comparison, *P < 0.05). (c) Quantification of eye size from MO injected embryos were compared to un-injected WT embryos to obtain percent similarity. Graph reveals significant reductions of eye size in Esco2 KD and Smc3 KD compared to control embryos (error bars represent s.e.m., one-way ANOVA with Turkey’s multiple comparison, *P < 0.05). (d) Graph shows percent of normal, fused, small, or absent otolith phenotypes with MO treatments. Data reveals 95% of control embryo otoliths exhibit normal phenotype, while Esco2 KD and Smc3 KD embryos exhibited 27% and 0% normal otolith phenotypes, respectively. An increase in abnormal otolith phenotypes was observed with KD treatments with predominantly fused phenotypes in Esco2 KDs and absent phenotypes in Smc3 KDs. Scale bar: 100 μm.
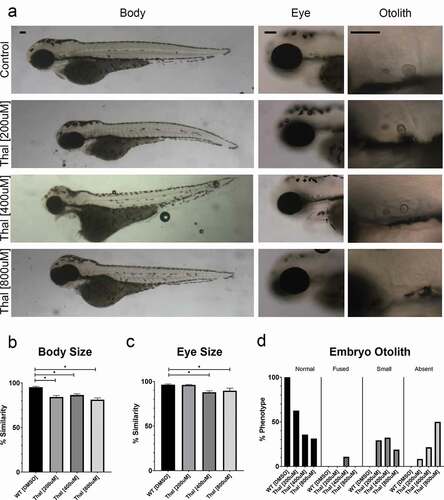
Thalidomide is a well-established teratogen that elicits developmental defects also observed in RBS individuals [Citation1]. We thus exposed wild-type (WT) zebrafish embryos to 200 µM, 400 µM and 800 µM concentrations of thalidomide, compared to DMSO treated control embryos ()). Significantly reduced body length was observed after treatment with 400 µM and 800 µM concentrations of thalidomide (). Eye size was significantly reduced at all concentrations of thalidomide (). Abnormalities in otolith development increased in a dose-dependent manner (). These findings are consistent with thalidomide-dependent developmental defects [Citation1,Citation3]. Importantly, the phenotypic overlap obtained from thalidomide treatment, and both in Esco2 KD and Smc3 KD embryos, spurred efforts to ascertain the extent to which these pharmacological and genetic maladies are linked.
Figure 2. Phenotypes of thalidomide treated embryos overlap with Esco2 KD and Smc3 KD embryos. (a) Representative images of control embryos (WT treated with DMSO) and thalidomide (thal.) treatments (WT treated with 200 μM, 400 μM, and 800 μM concentrations of thalidomide). For all experiments 16–28 replicates were analyzed and at least 3 independent trials were performed. (b) Quantification of body size after drug treatment were compared to un-treated WT embryos to obtain percent similarity. Bar graph reveals a significant reduction of body length with thal. treatments compared to DMSO treated controls (error bars represent s.e.m., one-way ANOVA with Turkey’s multiple comparison, *P < 0.05). (c) Quantification of eye size after drug treatment were compared to un-treated WT embryos to obtain percent similarity. Bar graph reveals a significant reduction of eye size with all thal. treatments compared to DMSO treated controls (error bars represent s.e.m., one-way ANOVA with Turkey’s multiple comparison, *P < 0.05). (d) Graph shows percent of normal, fused, small, or absent otolith phenotypes with drug treatments. Data reveals 100% of control embryo otoliths exhibit normal phenotype, while 200 μM, 400 μM, and 800 μM thal. treatments had 31%, 36% and 63% normal otolith phenotypes, respectively. An increase in absent otolith phenotypes was observed with increasing concentrations of thalidomide. Scale bar: 100 μm.
Smc3 and Esco2 regulate expression of the CRL4 ligase gene ddb1
Thalidomide teratogenicity results from inhibition of CRL4 ubiquitin ligase function [Citation3]. Given the prevailing model that CdLS arises from transcription dysregulation [Citation6,Citation18–20], we tested Smc3 KD embryos for transcriptional deregulation of cul4a, ddb1, and crbn genes, each of which encodes a key component of CRL4 ligase. cDNA obtained from smc3-ATG MO injected embryos were assessed by qRT-PCR at 24 hpf and compared to cDNA obtained from SC MO injected embryos. Fold changes in gene expression were calculated using Keratin as a housekeeping gene control. Neither crbn nor cul4a exhibited significant fold differences in gene expression. In contrast, ddb1 was significantly reduced in Smc3 KD embryos (Fig. S2a). The prevailing model of RBS, based on mitotic failure and stem cell apoptosis [Citation13–17], excludes a role for transcription dysregulation. Regardless, ddb1 expression was significantly downregulated in embryos injected with esco2-ATG MO at 24 hpf (i.e. cul4a and crbn were not significantly deregulated, Fig. S2a), similar to Smc3 KD embryos. These results provide compelling evidence for an emerging transcription dysregulation-based model of RBS [Citation6,Citation21,Citation22] and link, for the first time, Esco2 and cohesin pathways to CRL4 regulation and thalidomide teratogenicity.
Exogenous ddb1 rescues severe growth defects associated with Smc3 KD
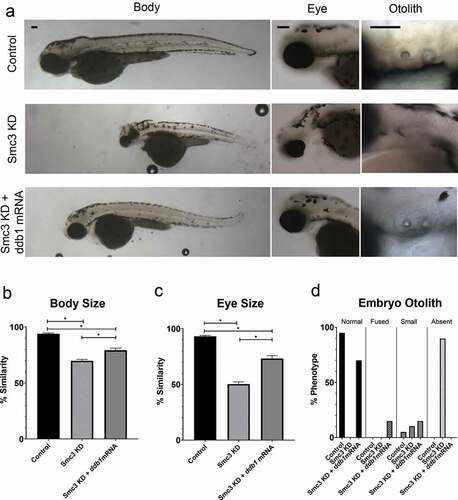
If our finding that CRL4 is regulated by cohesin-dependent expression of ddb1 is correct, consistent with the transcriptional model of CdLS etiology, then it should be possible to rescue Smc3 KD phenotypes by endogenous expression of ddb1. To test this hypothesis, embryos were injected with smc3-ATG MO, immediately followed by injection with ddb1 mRNA (100ng/μl). When smc3-ATG MO injection was immediately followed by ddb1 mRNA injection, developmental defects otherwise present in singly-injected smc3-ATG MO embryos were significantly reduced. For instance, both body and eye growth defects were significantly rescued by ddb1 mRNA expression (), and 70% of dual-injected embryos exhibited a normal otolith phenotype, compared to 0% normal phenotypes with smc3 MO injection alone (). Reduced levels (25ng/μl) of ddb1 mRNA led to a partial rescue of Smc3 KD eye and otolith phenotypes, revealing a dose-dependent response (Fig. S3a,b,c,d). In comparison, control embryos injected with ddb1 mRNA alone produced embryo development indistinguishable from un-injected WT embryos (Fig. S2b). Our findings that exogenous ddb1 expression rescues developmental defects that arise in Smc3 KD embryos provide critical support for a model in which cohesins perform a transcriptional role upstream of CRL4 which, when abrogated, result in thalidomide-like teratogenicity.
Figure 3. Exogenous ddb1 overexpression rescues Smc3 KD phenotypes. (a) Representative images of control embryos (WT injected with ddb1 mRNA), Smc3 KD (smc3-ATG MO injected) and Smc3 KD + ddb1 mRNA (smc3-ATG MO co-injected with ddb1 mRNA) embryos. For all experiments 26–40 replicates were analyzed and at least 3 independent trials were performed. (b) Quantification of body size from injected embryos were compared to un-injected WT embryos to obtain percent similarity. Bar graph reveals a significant rescue of body length in Smc3 KD + ddb1 mRNA compared to Smc3 KD alone (error bars represent s.e.m., one-way ANOVA with Turkey’s multiple comparison, *P < 0.05). (c) Quantification of eye size from injected embryos were compared to un-injected WT embryos to obtain percent similarity. Bar graph reveals a significant rescue of eye size in Smc3 KD + ddb1 mRNA compared to Smc3 KD alone (error bars represent s.e.m., one-way ANOVA with Turkey’s multiple comparison, *P < 0.05). (d) Graph shows percent of normal, fused, small, or absent otolith phenotypes with MO treatments. Data reveals 0% of Smc3 KD embryos exhibited normal otoliths, while 70% of Smc3 KD + ddb1 mRNA embryo otoliths were rescued to normal levels. A decrease in absent otolith phenotypes was observed with ddb1 mRNA co-injections compared to KD alone. Scale bar: 100 μm.
Exacerbation of Esco2 KD phenotypes by exogenous ddb1 reveals a feedback loop that is critical for development
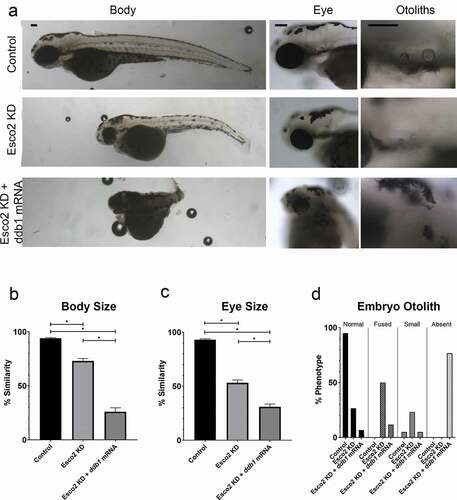
Recent evidence revealed that CRL4 targets, and thus promotes, Esco2 degradation [Citation29,Citation30]. These findings suggest that, instead of rescuing phenotypes, elevated Ddb1 levels might instead exacerbate developmental defects in Esco2 KD zebrafish embryos. To test this possibility, embryos were injected with esco2-ATG MO, immediately followed by injection with ddb1 mRNA (100ng/μl). Indeed, as opposed to rescuing esco2-ATG MO phenotypes, ddb1 mRNA injection exacerbated the embryonic developmental defects. Body length and eye size were significantly decreased in the dual-injected embryos, compared to Esco2 KD alone embryos (). Otoliths, if formed, were increasingly abnormal with a major fraction of embryos devoid of otoliths (). Reduced levels (25ng/μl) of ddb1 mRNA co-injected with esco2 MO, caused similar defects in body and otolith phenotypes compared to MO-only injected embryos, also revealing a dose-dependent response (Fig. S4a,b,c,d). While we cannot rule out the possibility that Esco2 and Ddb1 impact development via different or more complex mechanisms, we favor a model in which ddb1 mRNA injection counteracts the reduction of Ddb1, caused by esco2-ATG MO, and elevates CRL4 activity. In turn, CRL4 upregulation further decreases Esco2 levels and exacerbates Esco2 KD embryonic developmental defects. It is important to note that the experiments that showed negative regulation of Esco2 by Ddb1 required the use of a synchronous population of cells in culture [Citation29,Citation30]. Not surprisingly, we were not able to detect a significant reduction in Esco2 levels in unsynchronized embryos co-injected with esco2-ATG MO and ddb1 mRNA (data not shown). Future studies will be required to assess this novel feedback loop through which Esco2 is regulated.
Figure 4. Exogenous ddb1 overexpression exacerbates Esco2 KD phenotypes. (a) Representative images of control embryos (WT injected with ddb1 mRNA), Esco2 KD (esco2-ATG MO injected) and Esco2 KD + ddb1 mRNA (esco2-ATG MO co-injected with ddb1 mRNA) embryos. For all experiments 29–38 replicates were analyzed and at least 3 independent trials were performed. (b) Quantification of body size from injected embryos were compared to un-injected WT embryos to obtain percent similarity. Bar graph reveals a significant reduction of body length in Esco2 KD + ddb1 mRNA compared to Esco2 KD alone (error bars represent s.e.m., one-way ANOVA with Turkey’s multiple comparison, *P < 0.05). (c) Quantification of eye size from injected embryos were compared to un-injected WT embryos to obtain percent similarity. Bar graph reveals a significant reduction of eye size in Esco2 KD + ddb1 mRNA compared to Esco2 KD alone (error bars represent s.e.m., one-way ANOVA with Turkey’s multiple comparison, *P < 0.05). (d) Graph shows percent of normal, fused, small, or absent otolith phenotypes with MO treatments. Data reveals 27% of Esco2 KD embryos exhibited normal otoliths, while only 7% of Esco2 KD + ddb1 mRNA embryo otoliths were normal with an absent phenotype largely observed. Scale bar: 100 μm.
Ddb1 KD embryos recapitulate phenotypes observed in cohesinopathy and thalidomide zebrafish models
Our model linking RBS and CdLS to thalidomide teratogenicity predicts that Ddb1 KD embryos should recapitulate the developmental phenotypes obtained by Esco2 KD and Smc3 KD. To validate ddb1-directed MO efficacy, we first injected zebrafish embryos with either SC MO or ddb1 MO (Fig. S5a) at the 1-cell stage and then harvested embryos at 24hpf to obtain RNA. RNA was converted to cDNA to confirm the splice blocking effect of the ddb1 MO (Fig. S5a). In parallel, protein lysates of ddb1 MO injected embryos, injected with 2 different MO concentrations (0.25 mM and 0.5 mM), were analyzed by Western blots. The results document that Ddb1 levels are significantly reduced in ddb1 MO injected embryos, compared to control embryos (Fig. S5b,c).
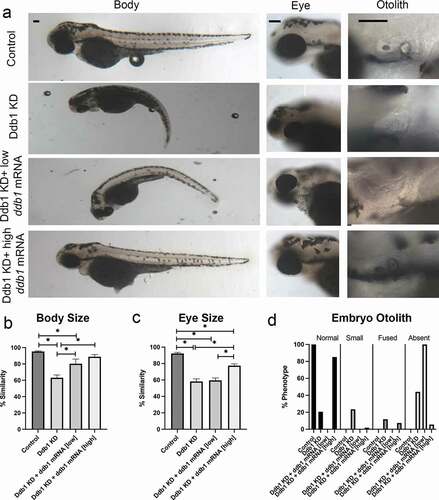
To assess the effect of Ddb1 KD on development, we injected zebrafish embryos with ddb1 MO, or SC MO, at the 1-cell stage and assessed embryos at 72hpf. Our results show that both body size and eye size were significantly reduced in ddb1 MO injected embryos, compared to SC MO injected embryos (). Otolith formation was also abnormal in ddb1 MO embryos, compared to SC-MO injected embryos (). We next validated that ddb1 MO phenotypes are due to appropriate targeting of ddb1 mRNA and not off target effects. To test this, we performed double injections in which ddb1-SB MO was immediately followed by ddb1 mRNA injection at the 1-cell stage. Embryo phenotypes were then assessed at 72hpf. A significant rescue of both body size and eye size were observed in co-injected embryos, compared to embryos injected solely with ddb1 MO (). Otolith development also improved significantly in co-injected embryos, compared to embryos injected solely with ddb1 MO. Importantly, the rescue in otolith development depended on the ddb1 mRNA concentration, revealing a dose-dependent effect (). The results that Ddb1 KD embryos recapitulate phenotypes observed upon Smc3 KD, Esco2 KD, and also thalidomide treatment support a unified pathway through which Ddb1 levels exist in a delicate balance that depend on Esco2 and cohesin pathways.
Figure 5. Ddb1 KD phenotypes overlap cohesinopathies and thalidomide teratogenicity phenotypes. (a) Representative images of control embryos (WT injected with ddb1 mRNA), Ddb1 KD (ddb1-SB MO injected), Ddb1 KD + low ddb1 mRNA (ddb1-SB MO co-injected with 25ng/μl ddb1 mRNA) and Ddb1 KD + high ddb1 mRNA (ddb1-SB MO co-injected with 100ng/μl ddb1 mRNA) embryos. For all experiments 24–60 replicates were analyzed and at least 3 independent trials were performed. (b) Quantification of body size from injected embryos were compared to un-injected WT embryos to obtain percent similarity. Bar graph reveals a significant reduction of body length in Ddb1 KD that is rescued by ddb1 mRNA (error bars represent s.e.m., one-way ANOVA with Turkey’s multiple comparison, *P < 0.05). (c) Quantification of eye size from injected embryos were compared to un-injected WT embryos to obtain percent similarity. Bar graph reveals a significant reduction of eye size in Ddb1 KD that is partially rescued with ddb1 mRNA (error bars represent s.e.m., one-way ANOVA with Turkey’s multiple comparison, *P < 0.05). (d) Graph shows percent of normal, fused, small, or absent otolith phenotypes with MO treatments. Data reveals 21% of Ddb1 KD embryos exhibited normal otoliths, while 85% of Ddb1 KD + high ddb1 mRNA embryo otoliths were normal. Scale bars: 100 μm.
Discovering a pharmacologically based mechanism through which cohesinopathies converge on CRL4 represents a major advancement in our understanding of human development. We note that cohesins redistribute to over 18,000 new loci during zebrafish development [Citation31], suggesting that regulating CRL4 subunit expression is only one example of many regulatory circuits through which Esco2 and cohesin function. A second example is cx43, a gap junction gene involved in skeletal development that is similarly under control of the Esco2-cohesin axis [Citation21,Citation22]. Mutations in CX43 cause oculodentodigital dysplasia (ODDD) in humans, and defects in bone segment regrowth in zebrafish [Citation6,Citation32]. The extent to which Esco2 and cohesin regulate genes independent of one another remains an important issue in development. Our findings that RBS and CdLS phenotypes are impacted by exogenous Ddb1 levels suggest that the identification of CRL4 targets, downstream of Esco2 and cohesin, will profoundly impact both current models of birth defects and their treatment. Moreover, the discovery that Ddb1 overexpression exacerbates, rather than rescues, Esco2 KD phenotypes provides new opportunities for analyzing feedback mechanisms during development. Regardless, mitotic failure-based models of RBS require significant revision with a new emphasis on transcriptional dysregulation, similar to CdLS. Such a transformation could reveal potential new treatment options for RBS and CdLS individuals. For instance, DDB1 and CRBN mutations result in elevated BKCa high conductance channel trafficking to the plasma membrane, increased ion conductivity, high neuronal excitation, and seizures [Citation33–35]. Paxilline, a BKCa channel blocker, reduces the incidence and severity of seizures that arise due to CRBN loss [Citation34]. CLR4 knock-out mice also exhibit learning and memory deficits, an effect attributed to reduced translation of hippocampal glutamatergic synapse proteins via AMPK hyperphosphorylation. Compound C (an AMPK inhibitor) treatment normalizes glutamatergic protein levels and rescues both learning and memory deficits in CRBN knockout mice [Citation36]. The extent to which RBS and CdLS patients may benefit from analogous strategies represents exciting possibilities. The novel link between CRL4 and RBS and CdLS reported here may extend to numerous other transcriptional dysregulated-based developmental disorders, as well as cancers that are tightly correlated with cohesin mutations [Citation37,Citation38]. We look forward to future experiments that test the extent to which the molecular mechanisms revealed here provide for new strategies of treatment for a broad range of developmental maladies and cancers.
Materials and methods
Zebrafish (Danio rerio) strain C32 was used. This study was performed in accordance with the recommendations in the Guide for the Care and Use of Laboratory Animals of the National Institutes of Health. These protocols were approved by Lehigh’s Institutional Animal Care and Use Committee (IACUC) (Protocol 187). Lehigh University’s Animal Welfare Assurance Number is A-3877-01.
Morpholino (MO) injections
MO purchased from GeneTools, LLC (Philomath, OR) were dissolved in sterile dH₂O, for a 1 mM concentration (sequences available upon request). These were heated to 65°C for 15 minutes prior to use. Full MO concentration resulted in embryo lethality, thus smc3 MO was diluted in 1X phenol red to a concentration of 0.5 mM to allow for embryo comparisons at 72 hours post fertilization (hpf), and esco2 MO was diluted in 1X phenol red to a concentration of 0.25 mM. A standard control (SC) MO with no target sequence in zebrafish was used as control. Microinjections were performed at the 1-cell stage using the Narishige IM 300 Microinjector and Nikon SMZ 800 for visualization. Zygotes were sorted for viability and fertilized embryos were kept in egg water and Ampicillin solution at 28°C. Embryos were de-chorionated using pronase if needed, then harvested for lysate or cDNA preparations or fixed in 4% paraformaldehyde (PFA), and kept at 4°C overnight for phenotype analysis. Embryos were stored in 100% methanol at −20°C for long term use after fixing.
Thalidomide treatments
As adapted from Ito et al. 2010 [Citation3], a stock 400 mM solution of thalidomide dissolved in DMSO was made in order to keep the final DMSO concentration under 0.1%. The 400 mM stock solution was diluted in E3 medium prewarmed at 65°C and mixed for 1 or 2 min to make 200 μM, 400 μM and 800 μM final concentrations. Zebrafish embryos were manually dechorionated prior to thalidomide treatment by use of forceps. After chorion removal, embryos were immediately transferred to E3 medium containing thalidomide or DMSO only control and further incubated at 28°C until the 72 hpf timepoint was reached. E3 medium was replaced with freshly prepared medium every 12 hours. Embryos were fixed in 4% PFA and kept at 4°C overnight for phenotypes analysis. Embryos were stored in 100% methanol at −20°C for long term use after fixing.
Embryo lysates and immunoblotting
MO injected embryo lysates were made at 24 hpf for Esco2, Smc3 and SC. Protocol was adapted from Schabel et al., 2019 [Citation39]. In short, embryos were de-chorinated with pronase then washed in E3 egg water. Individual embryos were placed in 1.5 mL centrifuge tubes and all excess egg water was removed. 500 μl of heptane were added then immediatly after 500 μl of cold methanol were added and sample was fixed for 5 mins. Embryo was washed two times with 500 μl of cold methanol then 2 times with 100 μl of Embryo Buffer (EB). Embryos were homogenized in 20 μl of EB. Three single embryo lysate preps were pulled to create one biological replicate. Lysates were stored at −80°C, 5X SDS Loading buffer was added and samples were boiled before use. A primary antibody specifically for zebrafish was used to detect Esco2 (1:1000, GenScript) [Citation22]. Alexa 546 anti-rabbit (1:1000, Invitrogen) was used to detect Esco2 primary antibody. A primary antibody specifically for zebrafish was used to detect Smc3 (1:1000, Santa Cruz Biotechnology, sc-8198). Alexa 568 anti-goat (1:1000, Invitrogen) was used to detect Smc3 primary antibody. An antibody for human Ddb1 protein sharing 97% homology to zebrafish Ddb1 was used to detect Ddb1 (1:500, Abcam, ab124672). Alexa 488 anti-rabbit (1:1000, Invitrogen) was used to detect Ddb1 primary antibody. Mouse anti-α-tubulin (1:1000, Sigma-Aldrich, T9026) was used as a loading control. Alexa 647 anti-mouse (1:1000, Invitrogen) was used to detect the tubulin primary antibody. For measurement of band intensities, ImageJ software (https://imagej.nih. gov/ij/) was used. Relative pixel densities of gel bands were measured using the gel analysis tool in ImageJ software as previously described in Bhadra and Iovine, 2015 [Citation40]. Tubulin was used as a loading control and thus the relative expression calculations were based on the ratio of Esco2 or Smc3 to Tubulin.
RT-PCR
For RT-PCR, total mRNA was extracted from around 15 embryos to make one biological replicate using Trizol reagent and the standard protocol. The resulting mRNA pellet was resuspended in a solution of DEPC H2O and RNAse Inhibitor, then the concentration of RNA was recorded using the Thermo Scientific Nanodrop 2000. For making cDNA, 1 μg of total RNA was reverse transcribed with SuperScript III reverse transcriptase (Invitrogen) using oligo (dT) primers. The resulting cDNA was diluted 1:10 for RT-PCR. Control primers (F: 5’-CAGAAGCCCACGGCGGTGAA-3’, R: 5’-CCTGAACAGCTCCATCACCGC-3’) were used that expand a region within exon 2 of ddb1 mRNA, unaffected by the MO. Target primers (F: 5’-CGGCCAAATACAACGCCTGC-3’ R: 5’-CTGGAATGACCATCGATGCC-3’) were used expanding from exon 3 – exon 5. PCR was set up for SC MO injected embryos and ddb1 MO injected embryos. A 1% agarose gel was poured, and PCR products ran at 100 V for ~ 1 hour.
mRNA rescue
Full length mRNA encoding for ddb1 was designed using the sequence from the ZFin database. The 5’ UTR and coding sequence was inserted into the pcDNA3.1(+) plasmid . Plasmid was diluted to 0.2 μg/μl in sterile water. The Qiagen Mini-Prep kit was used to isolate plasmid DNA from DH5alpha cells . The plasmid DNA was then linearized by performing an AvrII digest. A transcription reaction was then performed using the Invitrogen mMessage mMachine kit. The concentration of the resulting mRNA was assessed using the Thermo Scientific Nanodrop 2000. This was also run on a formaldehyde gel and imaged using the BioRad Gel Doc. The mRNA was then diluted to concentrations of 25ng/μl and 100ng/μl in phenol red. Diluted mRNA was heated at 65°C for 5 minutes prior to injections into zebrafish embryos at the 1-cell stage as previously described. The mRNA was also co-injected into embryos that had been injected with the smc3 and esco2-ATG start site blocker MOs. Both the mRNA injected embryos and co-injected rescue embryos were fixed at 72 hpf in 4% PFA overnight at 4°C and for phenotypes analysis. Embryos were stored in 100% methanol at −20°C for long term use after fixing.
qRT-PCR
For qRT-PCR, total mRNA was extracted from around 15 embryos to make one biological replicate using Trizol reagent and the standard protocol. The resulting mRNA pellet was resuspended in a solution of DEPC H2O and RNAse Inhibitor, then the concentration of RNA was recorded using the Thermo Scientific Nanodrop 2000. For making cDNA, 1 μg of total RNA was reverse transcribed with SuperScript III reverse transcriptase (Invitrogen) using oligo (dT) primers. The resulting cDNA was diluted 1:10 for qRT-PCR, using the Rotor-Gene 6000. cDNA was made on esco2-ATG MO injected embryos, smc3-ATG MO injected embryos and SC MO injected embryos. For each cDNA used, primers at a 10 μM concentrations were used. Three primers were specific for components of the CRL4 E3 Ligase affected by thalidomide, Cul4a (F: 5’-GCGGAATATGGAGTGTGTATGA-3’, R: 5’-TCCTGCTTTGGCGGATTT-3’), Crbn (F: 5’-CTTGTTCAGAGCGGATTGTAAAC-3’, R: 5’-TGGCAGACTCGTGTCAAAG-3’) and Ddb1 (F: 5’-GCACACTGCAGATTGATGAC-3’, R: 5’-GACGACTCCACTAACACTACAG-3’). keratin4 primers (F: 5’-TCATCGACAAAGTGCGCTTC-3’; R: 5’-TCGATGTTGGAACGTGTGGT-3’) were used as a housekeeping gene control. For each PCR tube, 7.5 μl of Sybr Green, 3 μl 10 μM Primers, 3.5 μl sterile H2O, and 1 μl cDNA was added. Analyses of the samples were done using Rotor‐Gene 6000 series software (Corbette Research) and the average cycle number (CT) determined for each amplicon. Delta CT (ΔCT) between housekeeping gene and CRL4 genes were calculated to represent expression levels normalized to keratin values. ΔΔCT values were calculated to represent the relative level of gene expression and the fold difference was determined using the ΔΔCT method (2‐ΔΔ CT) as previously described [Citation21,Citation41].
Imaging analysis of embryos
Zebrafish embryos fixed at 72 hpf were mounted on double cavity slides using 3% methyl cellulose for embedding. Embryo phenotypes were observed using the Nikon SMZ 1500, 1X objective at room temperature and the Nikon Eclipse 80i Microscope, 10X and 20X objectives at room temperature. Microscopes were equipped with SPOT-RTKE digital camera (Diagnostic Instruments) and SPOT software (Diagnostic Instruments) for image acquisition. The images obtained were then used to quantify whole embryo length, eye diameter, and otolith phenotypes. Percent similarities were obtained for body and eye measurements for each treatment compared to wild-type (WT) un-treated embryos. First, percent difference was calculated by taking the change in value between treated/injected embryo and un-treated/un-injected WT embryos, divided by the average of the numbers, all multiplied by 100. Percent similarities were then obtained by subtracting percent difference from 100. Otolith phenotypes were observed and scored into four categories: normal otoliths, fused otoliths, small otoliths, and absent otoliths. Otolith diameters were measured to distinguish between normal and small otoliths. Anterior and posterior otolith diameters were added; a sum less than 50 μm was classified as small. Percent of embryos with each otolith phenotype were calculated by taking number of embryos in each category divided by total embryos analyzed.
Statistical analysis
ANOVA tests were used to determine if there was a statistically significant difference in body size, and eye size between KDs and controls. Statistical analysis was performed using ordinary one-way ANOVA tests. Two-tailed paired t-tests were used to determine if there was a statistically significant difference in qRT-PCR analysis between KDs and controls. N values of at least 16 were used in every experiment. Only values giving P < 0.05 are reported.
Data availabilty statement
All data is available within the article or its supplementary materials.
Supplemental Material
Download Zip (20.6 MB)Acknowledgments
The authors thank Emma Anderson for help with the Ddb1 KD experiments, Rebbecca Bowman for the care of the zebrafish colony, and members of the Iovine and Skibbens labs for critical discussions throughout this study. This work was supported by a Lehigh University Faculty Research Grant and a Nemes Graduate Student Research Fellowship. The authors declare no competing interests.
Disclosure statement
No potential conflict of interest was reported by the author(s).
Supplementary material
Supplemental data for this article can be accessed here.
Additional information
Funding
References
- Smithells RW, Newman CG. Recognition of thalidomide defects. J Med Genet. 1992;29:716–723.
- Petroski M, Deshaies R. Function and regulation of cullin-RING ubiquitin ligases. Nat Rev Mol Cell Biol. 2005;6:9–20.
- Ito T, Ando H, Suzuki T, et al. Identification of a primary target of thalidomide teratogenicity. Science. 2010;327:1345–1350.
- Asatsuma-Okumura T, Ito T, Handa H. Molecular mechanism of cereblon-based drugs. Pharmacol Ther. 2019;202:132–139.
- Cheng J, Guo J, North BJ, et al. The emerging role for Cullin 4 family of E3 ligases in tumorigenesis. Biochim Biophys Acta Rev Cancer. 2019;1871:138–159.
- Banerji R, Skibbens RV, Iovine MK. How many roads lead to cohesinopathies? Dev Dyn. 2017;246:881–888.
- Rolef Ben-Shahar T, Heeger S, Lehane C, et al. Eco1-dependent cohesin acetylation during establishment of sister chromatid cohesion. Science. 2008;321:563–566.
- Zhang J, Shi X, Li Y, et al. Acetylation of Smc3 by Eco1 is required for S phase sister chromatid cohesion in both human and yeast. Mol Cell. 2008;31:143–151.
- Unal E, Heidinger-Pauli JM, Kim W, et al. A molecular determinant for establishment of sister chromatid cohesion. Science. 2008;321:566–569.
- Skibbens RV, Corson LB, Koshland D, et al. Ctf7p is essential for sister chromatid cohesion and links mitotic chromosome structure to the DNA replication machinery. Genes Dev. 1999;13:307–310.
- Toth A, Ciosk R, Uhlmann F, et al. Yeast cohesin complex requires a conserved protein, Eco1p(Ctf7), to establish cohesion between sister chromatids during DNA replication. Genes Dev. 1999;13(3):320–333.
- Hou F, Zou H. Two human orthologues of Eco1/Ctf7 acetyltransferases are both required for proper sister-chromatid cohesion. Mol Biol Cell. 2005;16:3908–3918.
- Monnich M, Kuriger Z, Print CG, et al. A zebrafish model of Roberts syndrome reveals that Esco2 depletion interferes with development by disrupting the cell cycle. PLoS One. 2011;6:e20051.
- Morita A, Nakahira K, Hasegawa T, et al. Establishment and characterization of Roberts syndrome and SC phocomelia model medaka (oryzias latipes). Dev Growth Differ. 2012;54:588–604.
- Percival SM, Thomas HR, Amsterdam A, et al. Variations in dysfunction of sister chromatid cohesion in esco2 mutant zebrafish reflect the phenotypic diversity of Roberts syndrome. Dis Model Mech. 2015;8:941–955.
- Percival SM, Parant JM. Observing mitotic division and dynamics in a live zebrafish embryo. J Vis Exp. 2016;113:https://doi.org/10.3791/54218.
- Zakari M, Yuen K, Gerton JL. Etiology and pathogenesis of the cohesinopathies. Wiley Interdiscip Rev Dev Biol. 2015;4:489–504.
- Dorsett D, Krantz ID. On the molecular etiology of cornelia de lange syndrome. Ann N Y Acad Sci. 2009;1151:22–37.
- Rollins RA, Morcillo P, Dorsett D. Nipped-B, a drosophila homologue of chromosomal adherins, participates in activation by remote enhancers in the cut and ultrabithorax genes. Genetics. 1999;152:577–593.
- Rollins RA, Korom M, Aulner N, et al. Drosophila nipped-B protein supports sister chromatid cohesion and opposes the stromalin/Scc3 cohesion factor to facilitate long-range activation of the cut gene. Mol Cell Biol. 2004;24:3100–3111.
- Banerji R, Eble DM, Iovine MK, et al. Esco2 regulates cx43 expression during skeletal regeneration in the zebrafish fin. Dev Dyn. 2016;245:7–21.
- Banerji R, Skibbens RV, Iovine MK. Cohesin mediates Esco2-dependent transcriptional regulation in a zebrafish regenerating fin model of Roberts syndrome. Biol Open. 2017;6:1802–1813.
- Xu B, Lee KK, Zhang L, et al. Stimulation of mTORC1 with L-leucine rescues defects associated with Roberts syndrome. PLoS Genet. 2013;9:e1003857.
- Muto A, Calof AL, Lander AD, et al. Multifactorial origins of heart and gut defects in nipbl-deficient zebrafish, a model of cornelia de lange syndrome. PLoS Biol. 2011;9:e1001181.
- Ghiselli G. SMC3 knockdown triggers genomic instability and p53-dependent apoptosis in human and zebrafish cells. Mol Cancer. 2006;5:52.
- Horsfield JA, Anagnostou SH, Hu JK, et al. Cohesin-dependent regulation of runx genes. Development. 2007;134:2639–2649.
- Schuster K, Leeke B, Meier M, et al. A neural crest origin for cohesinopathy heart defects. Hum Mol Genet. 2015;24:7005–7016.
- Cukrov D, Newman TAC, Leask M, et al. Antioxidant treatment ameliorates phenotypic features of SMC1A-mutated cornelia de lange syndrome in vitro and in vivo. Hum Mol Genet. 2018;27:3002–3011.
- Minamino M, Tei S, Negishi L, et al. Temporal regulation of ESCO2 degradation by the MCM Complex, the CUL4-DDB1-VPRBP complex, and the anaphase-promoting complex. Curr Biol. 2018;28:2665–2672.
- Sun H, Zhang J, Xin S, et al. Cul4-Ddb1 ubiquitin ligases facilitate DNA replication-coupled sister chromatid cohesion through regulation of cohesin acetyltransferase Esco2. PLoS Genet. 2019;15:e1007685.
- Meier M, Grant J, Dowdle A, et al. Cohesin facilitates zygotic genome activation in zebrafish. Development. 2018;145:dev156521.
- Paznekas WA, Boyadjiev SA, Shapiro RE, et al. Jabs, Connexin 43 (GJA1) mutations cause the pleiotropic phenotype of oculodentodigital dysplasia. Am J Hum Genet. 2003;72:408–418.
- Jo S, Lee KH, Song S, et al. Identification and functional characterization of Cereblon as a binding protein for large-conductance calcium-activated potassium channel in rat brain. J Neurochem. 2005;94:1212–1224.
- Liu J, Ye J, Zou X, et al. CRL4A(CRBN) E3 ubiquitin ligase restricts BK channel activity and prevents epileptogenesis. Nat Commun. 2014;5:3924.
- Sun P, Zhang Q, Zhang Y, et al. Fear conditioning suppresses large-conductance calcium-activated potassium channels in lateral amygdala neurons. Physiol Behav. 2015;138:279–284.
- Bavley CC, Rice RC, Fischer DK, et al. Rescue of learning and memory deficits in the human nonsyndromic intellectual disability cereblon knock-out mouse model by targeting the AMP-activated protein kinase–mTORC1 translational pathway. J Neurosci. 2018;14:2780–2795.
- Bose T, Lee KK, Lu S, et al. Cohesin protein promotes ribosomal RNA production and protein translation in yeast and human cells. PLoS Genet. 2012;8:e1002749.
- Mannini L, Musio A. The dark side of cohesin: the carcinogenic point of view. Mutat Res. 2011;728:81–87.
- Schnabel D, Castillo-Robles J, Lomeli H. Protein purification and Western blot detection from single zebrafish embryo. Zebrafish. 2019;6:505–507.
- Bhadra J, Iovine MK. Hsp47 midiates Cx43-dependent skeletal growth and patterning in the regenerating fin. Mech Dev. 2015;138:364–374.
- Ton Q, Iovine MK. Semaphorin3d mediates Cx43-dependent phenotypes during fin regeneration. Dev Biol. 2012;366:195–203.