
ABSTRACT
Long non-coding RNA tumor protein 53 target gene 1 (TP53TG1) has been unraveled to exert regulatory effects on cancer progression, while the regulatory function of TP53TG1 on cervical cancer (CC) via regulating microRNA (miR)-33a-5p/Forkhead box K2 (FOXK2) axis remains rarely explored. This study aims to unearth the regulatory mechanism of TP53TG1/miR-33a-5p/FOXK2 axis in CC. The CC clinical samples were collected, and CC cells were cultured. TP53TG1, miR-33a-5p and FOXK2 levels were examined in CC tissues and cells. The CC cells were transfected with high- or low-expressed TP53TG1, FOXK2 or miR-33a-5p to determine the changes of CC cell biological activities and the status of phosphatidylinositol 3-kinase/protein kinase B/mammalian target of rapamycin (PI3K/AKT/mTOR) pathway. The tumorigenesis in nude mice was conducted. The relationship among TP53TG1, miR-33a-5p and FOXK2 was validated. TP53TG1 and FOXK2 expression levels were increased and miR-33a-5p expression level was reduced in CC cells and tissues. The silenced TP53TG1 or FOXK2, or elevated miR-33a-5p decelerated the CC cell development and restrained the activation of PI3K/AKT/mTOR signaling pathway. The depleted FOXK2 or elevated miR-33a-5p reversed the effects of decreased TP53TG1 on CC cell progression. TP53TG1 sponged miR-33a-5p, which targeted FOXK2. The experiment in vivo validated the outcomes of the experiment in vitro. TP53TG1 accelerates the CC development via regulating miR-33a-5p to target FOXK2 with the involvement of PI3K/AKT/mTOR signaling pathway. This study provides novel theory basis and distinct therapeutic targets for CC treatment.
Introduction
Cervical cancer (CC) ranks the third most common cancer in women globally [Citation1]. CC is a rare long-term consequence derived from persistent infection of the lower genital tract by high-risk human papillomavirus (HPV) types [Citation2]. The carcinogenesis and metastasis of CC are mainly ascribed to HPV infection, genetic mutation and epigenetic alterations [Citation3]. However, the elimination of CC can be achieved through primary and secondary prevention [Citation4]. Cytological screening programs have been widely adopted for the diagnosis of CC. Specifically, the Papanicolaou test and HPV test are two major types of diagnostic tests currently, reducing the incidence of CC in the developed world [Citation5]. However, the CC incidence rate remains especially high in developing countries mainly due to suboptimal sensitivities and limited access to effective diagnostic tests [Citation6]. Therefore, it is necessary to extensively explore more effective therapeutic strategies of CC.
Long non-coding RNAs (lncRNAs) are essential regulators involved in multiple biological functions and disease processes [Citation7]. As a member of lncRNAs, long non-coding RNA tumor protein 53 target gene 1 (TP53TG1), a target gene of tumor suppressor protein 53, has been reported to induce cellular damage in breast cancer [Citation8] and up-regulation of TP53TG1 facilitates the biological functions of glioma cells [Citation9]. Moreover, Zhang et al. have clarified that the TP53TG1 level is enriched in pancreatic ductal adenocarcinoma (PDAC), and the silenced TP53TG1 decelerates the biological activity of PDAC cells [Citation10]. However, the concrete regulatory function of TP53TG1 in CC remained obscure. The bioinformatics website predicted that there was a targeting relationship between TP53TG1 and microRNA (miR)-33a-5p. miR-33a functions as a pivotal player in modulating cholesterol and lipid metabolism and is associated with their host genes [Citation11]. Moreover, miR-33a has been illustrated to display a low level in endometrial cancer cells [Citation12] and in triple-negative breast cancer cells, while the elevation of miR-33a-5p facilitates the doxorubicin sensitivity of triple-negative breast cancer cells, thus further attenuating the drug-resistant phenomenon in breast cancer [Citation13]. The bioinformatics website further validated that miR-33a-5p targeted forkhead box K2 (FOXK2). As forkhead box transcription factor, FOXK2 has been uncovered to serve as a regulator of various cancer characteristics, for instance, cell growth and survival as well as DNA damage [Citation14]. Specifically, FOXK2 has been disclosed to exhibit elevated levels in hepatocellular carcinoma, and also implicated in poor clinical outcomes of hepatocellular carcinoma patients [Citation15]. In locally advanced rectal cancer, the patients with low disease-free survival also display amplified FOXK2 expression [Citation16]. Furthermore, miR-33a-5p has also been revealed to dampen the progression of melanoma via inactivation of the phosphatidylinositol 3-kinase/protein kinase-B/mammalian target of rapamycin (PI3K/AKT/mTOR) signaling pathway [Citation17]. Previous literature has elucidated that the PI3k/Akt/mTOR levels are augmented in the tissues of CC patients. Nevertheless, the concrete regulatory mechanism and the relationship among TP53TG1, miR-33a-5p, FOXK2 in CC remain largely unknown. Therefore, this study is committed to probing the impacts of TP53TG1 on CC progression via regulating miR-33a-5p to target FOXK2 with PI3K/AKT/mTOR signaling pathways, thus affording novel therapeutic strategies and a distinguished research direction for CC treatment.
Material and Methods
Ethics statement
The study was approved by the Ethics Committee of SSL Central Hospital of Dongguan, Affiliated Dongguan Shilong People’s Hospital of Southern Medical University. All patients received informed consent before the study. All experimental protocols shall be implemented according to relevant regulations. Our animal experiment was approved by the Ethics Committee of SSL Central Hospital of Dongguan, Affiliated Dongguan Shilong People’s Hospital of Southern Medical University (ethical approval code: 201902011).
Clinical sample collection
Ninety CC tissues and normal epithelial tissues were obtained from CC patients who received an operation in SSL Central Hospital of Dongguan. The inclusion criteria [Citation18] are as follows: (1) all patients were diagnosed with primary CC and did not receive preoperative radiotherapy, chemotherapy, targeted therapy, and immunotherapy; (2) complete data of cases were available; and (3) patients were in stage Ia2 to IIa2. The exclusion criteria are as follows: with concurrent other malignancies; with incomplete clinical data; and with severe cardiac, renal and pulmonary dysfunction. General clinical data and concrete pathological records were obtained.
Cell culture
Human cervical epithelial cell line HcerEpic (American Type Culture Collection, VA, USA) and human cervical cancer cell lines SiHa, Caski, HeLa and C33A were all provided by the Cell Bank of Chinese Academy of Sciences (Shanghai, China). Cells were cultured in Dulbecco’s modified Eagle’s medium (DMEM) or Roswell Park Memorial Institute-1640 medium containing 10% fetal bovine serum (FBS) (Gibco, Grand Island, NY, USA), 100 U/mL cyanomycin (Gibco) and 100 μg/mL streptomycin (Gibco) [Citation19].
Cell transfection
With reference to the known TP53TG1 and miR-33a-5p sequences in the National Center for Biotechnology Information, the required plasmids were constructed by GenePharma Co. Ltd. (Shanghai, China). HeLa cells were cultured in the 6-well plates at the density of 4 × 10⁵ cells/mL. When the cell confluence reached 80%, the Lipofectamine 3000 reagent (Life Technologies Corporation, Carlsbad, CA, USA) was adopted for transfection. The cells were divided into TP53TG1-negative control (NC) group (transfected with TP53TG1-NC vector), short hairpin RNA (sh)-TP53TG1 group (transfected with sh-TP53TG1 vector), overexpression (oe)-TP53TG1 group (transfected with high-expressed TP53TG1 vector), miR-33a-5p-NC group (transfected with miR-33a-5p-NC), miR-33a-5p mimic group (transfected with miR-33a-5p mimic), miR-33a-5p inhibitor group (transfected with miR-33a-5p inhibitor), FOXK2-NC group (transfected with FOXK2-NC vector), sh-FOXK2 group (transfected with sh- FOXK2 vector), oe-FOXK2 group (transfected with high-expressed FOXK2 vector), sh-TP53TG1 + miR-33a-5p-NC group (transfected with sh-TP53TG1 vector + miR-33a-5p-NC), sh-TP53TG1 + miR-33a-5p inhibitor group (transfected with sh- TP53TG1 vector + miR-33a-5p inhibitor), sh-TP53TG1 + FOXK2-NC group (transfected with sh- TP53TG1 vector + FOXK2-NC vector), and sh-TP53TG1 + oe-FOXK2 group (transfected with sh- TP53TG1 vector + high-expressed FOXK2 vector). After transfection, cells in different groups were cultured at 37°C with 5% CO2 for 48 h and then used for subsequent experiments.
Cell counting kit (CCK-8) assay
The transfected cells were detached, and the cell density was adjusted to 5 × 10⁴/mL. Then, each well of the 96-well plates was added with 100 μL cell suspension, and 4 replicates were set for each well. After seeding, the cells adhered to the wall. As mentioned in the manufacturer’s instructions, each well was added with 10 μL of CCK-8 reagent (Dojindo Molecular Technologies, Inc., Kumamoto, Japan) without light. After 4-h incubation in darkness, 10 μL CCK-8 reagent was added to each well at 24, 48, and 72 h, respectively. After incubation in darkness, the optical density was detected by a microplate reader. The experiment was repeated 3 times.
Scratch test
The back of the 6-well plates was drawn with a horizontal line at intervals of 0.5 ~ 1 cm with a marker pen and a ruler. Each group was added with around 5 × 10⁵ cells for overnight culture. The next day, the pipette head was used to make a vertical scratch on the horizontal line on the back of the 6-well plates. Exfoliated cells were extracted. Thereafter, cells were added with serum-free medium and cultured in an incubator with 5% CO2. Cells were collected and photographed at 0, and 24 h. The scratch distance was determined by an inverted microscope after picture-taking. The experiment was repeatedly conducted 3 times.
Transwell assay
The 24-well plates and transwell chamber were prepared and then added with 500 μL medium containing 20% FBS (Gibco). The cells were detached after transfection and resuspended in a serum-free medium. The cell density was adjusted to 5 × 10⁵/mL. The transwell upper chamber was filled with 100 μL cell suspension and incubated in a thermostatic cell incubator. After 24 h, each well was added with 500 μL of paraformaldehyde and 100 μL of 1% solution of crystal violet (Sigma-Aldrich, SF, CA, USA) and dyed for 20 min. Then, cells were counted under an inverted microscope (Olympus, Tokyo, Japan) and photographed.
Flow cytometry
After 48-h transfection, cells were detached with 0.25% trypsin, collected in flow tubes, and centrifuged and the supernatant was discarded. After washing 3 times with PBS, cells were centrifuged and the supernatant was discarded. The Annexin-V-fluorescein isothiocyanate (FITC)/propidium iodide (PI) staining solution was prepared concerning the instructions of the Annexin-V-FITC Apoptosis Assay Kit (Biovision, USA) in a 1:2:50 ratio of Annexin-V-FITC, PI, and HEPES buffer solution. Then, 1 × 10⁶ cells were resuspended per 100 μL of staining solution, shaken, mixed, and incubated for 15 min at room temperature. Afterward, 1 mL of HEPES buffer solution (Procell, Wuhan, China) was added, shaken and mixed. The fluorescence of FITC and PI was detected by excitation of 525 and 620 nm bandpass filters at 488 nm, and the cell apoptosis was examined.
Reverse transcription quantitative polymerase chain reaction (RT-qPCR)
Total RNA (Invitrogen, Car, USA) was extracted using Trizol method. RNA and antisense microRNA were reversely transcribed into cDNA using a PrimeScript RT kit (Takara, Japan). Then, the reaction solution was taken for fluorescence quantitative PCR referring to the instructions of SYBR®Premix ExTaqTMII Kit (TaKaRa). The RT-PCR reaction system was prepared with the following components: 25 μL of Sybr green premix taq II (2 ×), 2 μL of primer 1 (10 μM), 2 μL of primer 2 (10 μM), 5 μL of cDNA, and 16 μL of dH2O. Samples were analyzed on the real-time quantitative fluorescence PCR instrument (ABI 7500, ABI, Foster City, CA, USA) system and the fluorescence PCR was performed. PCR amplification conditions are as follows: heat activation at 95°C for 10 min and heat denaturation at 95°C for 60 s (95°C for 15 s, 60°C for 15 s, 72°C for 45 s) for 40 cycles. Glyceraldehyde-3-phosphate dehydrogenase (GAPDH) was set as a control to detect TP53TG1 and FOXK2 mRNA expression, and the U6 was set as control to examine miR-33a-5p expression. The relative level of TP53TG1, miR-33a-5p and FOXK2 was calculated by the 2−ΔΔCt method. The primer sequences listed in Supplementary Table 1. The experiment was repeated 3 times.
Western blot assay
Total protein was extracted with a proper amount of protein lysis and then isolated by sodium dodecyl sulfate polyacrylamide gel electrophoresis. Thereafter, the protein was transferred to the cellulose nitrate membrane and sealed thoroughly with 5% skim milk for 2 h followed by overnight incubation with primary antibodies FOXK2 (1:1000 dilution; Abcam, MA, USA) or GAPDH (1:1000 dilution; Abcam) at 4°C. After washing in tris-buffered saline with Tween 20 for 3 times, the protein was incubated with the secondary antibody for 2 h. The target protein expression was detected by the enhanced chemiluminescence reagent. GAPDH was set as the endogenous control. The experiment was repeated 3 times.
Dual luciferase reporter gene assay
Cultured cells were resuscitated. When the cells grew well, cells were made into the single-cell suspension with DMEM. The cells were then seeded evenly into the 24-well plate with 5 × 10⁴ cells in each well and cultured overnight at 5% CO2. The cell culture solution was absorbed thoroughly. Then, 200 μL of reporter gene cell lysate was prepared and added, mixed well, and centrifuged for 5 min to extract the required supernatant. The firefly luciferase assay reagent and renilla luciferase assay buffer were dissolved. The renilla luciferase assay substrate (100 ×) was placed on an ice box. The required amount of renilla luciferase detection buffer was measured and added into the renilla luciferase detection substrate (100 ×) at the ratio of 1:100 (100 μL for per sample). The renilla luciferase detection working solution was prepared. The luminometer was operated for measurement for 10 s at the interval of 2 s. Then, 100 μL of each sample was extracted, supplemented with 100 μL of firefly luciferase detection reagent, and mixed well and the relative light unit (RLU) was determined. The luciferase activity was measured using a dual luciferase reporter assay system (Promega, Madison, WI, USA). The reporter gene cell lysate was set as the blank control, added with 100 μL of renilla luciferase detection solution and mixed well to determine RLU. Renilla luciferase was set as an endogenous reference. The activation extent of the target reporter gene between different samples = the RLU value assessed by firefly luciferase/the RLU value assessed by renilla luciferase.
RNA pull-down assay
Biotin-labeled TP53TG1 RNA (Bio-TP53TG1-probe) was prepared by Thermo Fisher Scientific (Massachusetts, USA) and Bio-NC-probe was set as NC. Cells were collected and resuspended in radioimmunoprecipitation assay cell lysis buffer (Beyotime, Shanghai, China). The cell lysate and Bio-TP53TG1-probe were then incubated for 1 h. Every binding reaction was supplemented with 50 μL of streptavidin agar beads (Sigma-Aldrich) for further 1 h incubation. The complex was incubated with RNase-free DNase I (Takara, Dalian, China) for 15 min and proteinase K (Takara) at 45°C for half an hour. Finally, RT-qPCR was conducted to examine the enrichment level of miR-33a-5p. The experiment was repeated 3 times.
Tumorigenesis in nude mice
The 6-week-old BALB/c female nude mice were purchased, and the back of nude mice in each group (n = 6) was subcutaneously injected with transfected HeLa cells. The tumor size and volume were measured every week. After 35 days, the mice were euthanized and the tumor was immediately removed and weighed.
Statistical analysis
All the data were processed using SPSS 21.0 statistical software (IBM Corp. Armonk, NY, USA). The measurement data were expressed in the form of mean ± standard deviation. The t-test was used for the comparison between two groups, analysis of variance (ANOVA) was adopted for the comparison among multiple groups and Tukey’s post hoc test was used for pairwise comparisons after ANOVA. P < 0.05 was considered to be statistically significant.
Results
TP53TG1 is upregulated in CC tissues and cells and reduced TP53TG1 represses cell growth and promotes apoptosis of CC cells
A previous study has confirmed TP53TG1 is upregulated in PDAC cells and tissues [Citation10]. To examine the expression of TP53TG1 in CC tissues and cells, we detected TP53TG1 expression by RT-qPCR. The results reflected that TP53TG1 was elevated in CC tissues()), and TP53TG1 was elevated in CC cells, thus, we selected HeLa cells with the highest TP53TG1 expression level for subsequent experiments ()).
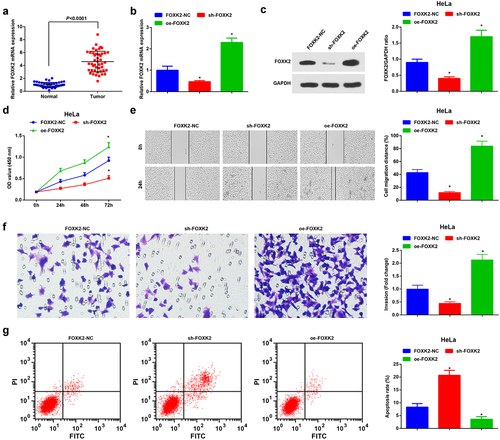
Figure 1. TP53TG1 is elevated in CC tissues and cells and reduced TP53TG1 represses cell growth and promotes apoptosis of CC cells. (a), TP53TG1 level in CC tissues and normal tissues (n = 45) was detected by RT-qPCR; (b), TP53TG1 level in CC cell lines and normal cervical epithelial cells (HcerEpic) was examined by RT-qPCR; (c), TP53TG1 expression in HeLa cells after the transfection with sh-TP53TG1 or oe-TP53TG1 was assessed by RT-qPCR; (d), cell proliferation after transfection with sh-TP53TG1 or oe-TP53TG1 was assessed by CCK-8 assay; (e), cell migration after transfection with sh-TP53TG1 or oe-TP53TG1 was detected by the scratch test; (f), cell invasion after transfection with sh-TP53TG1 or oe-TP53TG1 was determined by Transwell assay; (g), cell apoptosis after transfection with sh-TP53TG1 or oe-TP53TG1 was assessed by flow cytometry. (h), the change of tumor size and volume after transfection with sh-TP53TG1 or oe-TP53TG1 in nude mice. The data in the figure were all measurement data, and the values were represented by mean ± standard deviation, the t-test was used for the comparison between two groups, ANOVA was adopted for the comparison among multiple groups and Tukey’s post hoc test was used for pairwise comparisons after ANOVA; * P < 0.05 vs. HcerEpic cells; # P < 0.05 vs. the TP53TG1-NC group; n = 6; the cell experiment was repeated at least three times independently.
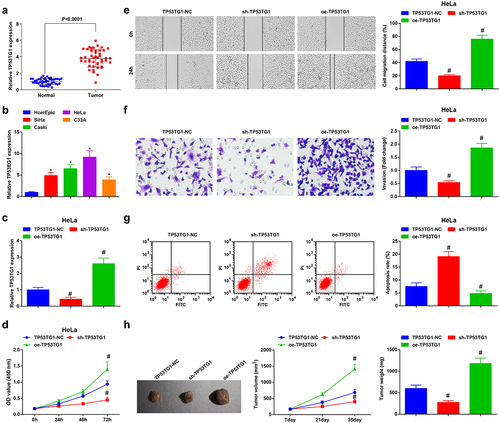
To further reveal the role of TP53TG1 in CC, we transfected TP53TG1-NC, sh-TP53TG1, or oe-TP53TG1 into HeLa cells. TP53TG1 was markedly reduced in CC cells after transfection with sh-TP53TG1 and enriched after transfection with oe-TP53TG1 in CC cells ()). Through the outcomes of CCK-8 assay, Transwell assay, scratch test and flow cytometry, it was observed that after the depletion of TP53TG1, CC cells displayed impaired proliferation, migration and invasion ability and accelerated apoptosis level. Decreased TP53TG1 reduced tumor volume and size by tumorigenesis in nude mice (–h)). Nevertheless, the high-expressed TP53TG1 exerted oppositely on CC cell growth and tumor volume and size. The results uncovered that the decreased TP53TG1 inhibited the growth and tumorigenesis of CC cells, whereas the enriched TP53TG1 exerted the opposite effect.
TP53TG1 targets miR-33a-5p
The bioinformatic website (https://starbase.sysu.edu.cn/) ()) predicted the direct target relationship between TP53TG1 and miR-33a-5p, which was then verified by luciferase reporter gene assay and RNA pull-down assay. The luciferase activity was impaired in CC cells transfected with the miR-33a-5p mimic + TP53TG1-wild type (WT) (), p = 0.004). Similarly, miR-33a-5p was enriched in CC cells after Bio-TP53TG1-probe transfection, indicating a direct interaction between TP53TG1 and miR-33a-5p ()). In addition, the linear regression analysis also reflected that TP53TG1 expression was negatively correlated with the miR-33a-5p level by RT-qPCR in 90 tissue specimens ()).
Figure 2. TP53TG1 targets miR-33a-5p. (a), the binding site for TP53TG1 and miR-33a-5p was predicted by the bioinformatic website; (b), the targeting relationship between miR-33a-5p and TP53TG1 was validated by luciferase reporter gene assay; (c), the effects of TP53TG1 on miR-33a-5p enrichment were detected by RNA pull-down assay; (d), the correlation between TP53TG1 and miR-33a-5p in CC tissues was assessed by linear regression analysis; The data in the figure were all measurement data, and the values were represented by mean ± standard deviation, the t-test was used for the comparison between two groups; P < 0.05 was regarded as the indicator of statistical significance. The cell experiment was repeated at least three times independently.
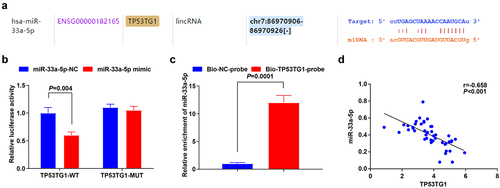
The above outcomes demonstrated that TP53TG1 had a targeting relationship with miR-33a-5p.
MiR-33a-5p is depleted in CC tissues and cells, and miR-33a-5p elevation hinders HeLa cell growth and tumorigenesis, whereas reduced miR-33a-5p has the opposite impacts on CC cells
Dedicated to assessing the miR-33a-5p level in CC tissues and cells, we detected miR-33a-5p expression by RT-qPCR. The outcomes implied that miR-33a-5p was downregulated in CC tissues ()).
Figure 3. MiR-33a-5p is depleted in CC tissues, and miR-33a-5p elevation hinders HeLa cell growth and tumorigenesis whereas reduced miR-33a-5p has the opposite impacts on CC cells. (a), miR-33a-5p expression in CC tissues and normal tissues (n = 45) was detected by RT-qPCR; (b), miR-33a-5p expression after transfection with miR-33a-5p mimic or miR-33a-5p inhibitor was examined by RT-qPCR; (c), cell proliferation after transfection with miR-33a-5p mimic or miR-33a-5p inhibitor was assessed by CCK-8 assay; (d), cell migration after transfection with miR-33a-5p mimic or miR-33a-5p inhibitor was detected by scratch test; (e), cell invasion after transfection with miR-33a-5p mimic or miR-33a-5p inhibitor was determined by Transwell assay; (f), cell apoptosis after transfection with miR-33a-5p mimic or miR-33a-5p inhibitor was assessed by flow cytometry. The data in the figure were all measurement data, and the values were represented by mean ± standard deviation, the t-test was used for the comparison between two groups, ANOVA was adopted for the comparison among multiple groups and Tukey’s post hoc test was used for pairwise comparisons after ANOVA; * P < 0.05 vs. the miR-33a-5p NC group. the cell experiment was repeated at least three times independently.
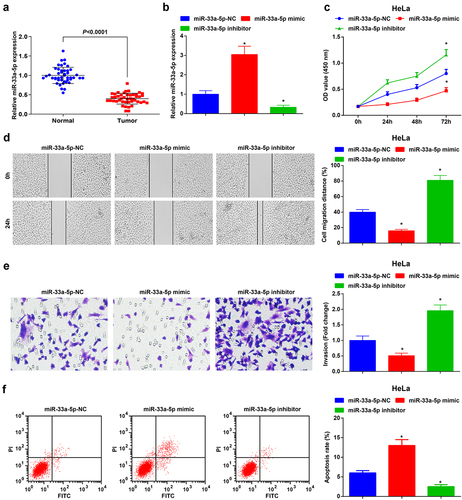
To further probe the regulatory mechanism of miR-33a-5p in CC, we transfected HeLa cells with miR-33a-5p-NC, miR-33a-5p mimic or miR-33a-5p inhibitor. After being transfected with miR-33a-5p mimic, miR-33a-5p was augmented in CC cells, while miR-33a-5p was depleted after miR-33a-5p inhibitor transfection ()). It turns out that the augmentation of miR-33a-5p decelerated the proliferation, migration, and invasion of HeLa cells, whereas induced cell apoptosis. However, the reduction of miR-33a-5p exerted the opposite effect on HeLa cells (–f)).
These findings disclosed that the enrichment of miR-33a-5p mitigated proliferation, migration, and invasion and facilitated apoptosis of HeLa cells, while the downregulation of miR-33a-5p had the contrary effect.
FOXK2 is targeted by miR-33a-5p
The bioinformatic website (https://starbase.sysu.edu.cn/) predicted that miR-33a-5p targeted FOXK2 ()). It was found that miR-33a-5p hindered the luciferase activity of cells transfected with pmirGLO-FOXK2-WT through dual luciferase reporter gene assay ()), reflecting that FOXK2 was targeted by miR-33a-5p. In addition, FOXK2 expression was reduced after the elevation of miR-33a-5p, while increased after the decrement of miR-33a-5p by RT-qPCR and Western blot assay (,d)). It was also observed that FOXK2 was highly expressed in CC tissues and negatively correlated with the miR-33a-5p level ()). The above outcomes implied that miR-33a-5p targeted FOXK2.
Figure 4. FOXK2 is targeted by miR-33a-5p. (a), the binding site of miR-33a-5p and FOXK2 was predicted by bioinformatic website; (b), the targeting relationship between miR-33a-5p and FOXK2 was verified by luciferase reporter gene assay; (c/d), the effects of the up- or down-regulation of miR-33a-5p on FOXK2 expression were examined by RT-qPCR and Western blot assay; (e), the correlation between FOXK2 and miR-33a-5p in CC tissues was assessed by linear regression analysis. The data in the figure were all measurement data, and the values were represented by mean ± standard deviation, the t-test was used for the comparison between two groups; ANOVA was adopted for the comparison among multiple groups and Tukey’s post hoc test was used for pairwise comparisons after ANOVA; * P< 0.05 vs. the miR-33a-5p NC group
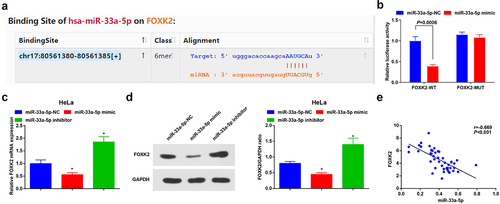
. The cell experiment was repeated at least three times independently.
Inhibition of FOXK2 represses the development of CC cells
It has been reported that FOXK2 was augmented in hepatocellular carcinoma and esophageal squamous cell carcinoma [Citation20,Citation21]. To measure FOXK2 expression in CC tissues, we performed RT-qPCR, and it was reflected that FOXK2 was augmented in CC tissues ()).
Figure 5. Inhibition of FOXK2 represses the development of CC cells. (a), FOXK2 expression in CC tissues and normal tissues (n = 45) was detected by RT-qPCR; (b/c), FOXK2 level after transfection with sh-FOXK2 or oe-FOXK2 was examined by RT-qPCR and Western blot assay; (d), cell proliferation after transfection with sh-FOXK2 or oe-FOXK2 was assessed by CCK-8 assay; (e), cell migration after transfection with sh-FOXK2 or oe-FOXK2 was detected by scratch test; (f), cell invasion after transfection with sh-FOXK2 or oe-FOXK2 was determined by Transwell assay; (g), cell apoptosis after transfection with sh-FOXK2 or oe-FOXK2 was assessed by flow cytometry. The data in the figure were all measurement data, and the values were represented by mean ± standard deviation, the t-test was used for the comparison between two groups; ANOVA was adopted for the comparison among multiple groups and Tukey’s post hoc test was used for pairwise comparisons after ANOVA; * P < 0.05 vs. the FOXK2-NC group. the cell experiment was repeated at least three times independently.
Furthermore, CC cells were transfected with sh-FOXK2 or oe-FOXK2. After transfection with sh-FOXK2, FOXK2 was reduced in CC cells, whereas FOXK2 was elevated after transfection with oe-FOXK2 (,c)). The silenced FOXK2 in CC cells induced suppressed cell proliferation, migration, and invasion and promoted cell apoptosis. The enrichment of FOXK2 in CC cells exhibited opposite influences on CC cell development (–g)).
The above results indicated that the silence of FOXK2 inhibited the cancer cell growth, but the augment of FOXK2 exerted the opposite effects on CC cells.
Reduced TP53TG1 inhibits the development of CC via up-regulating miR-33a-5p to suppress FOXK2
In CC cells transfected with sh-TP53TG1, it was found that the FOXK2 level was reduced, while miR-33a-5p expression was enriched, yet CC cells transfected with oe-TP53TG1 exhibited enriched FOXK2 and silenced miR-33a-5p expression by RT-qPCR and Western blot assay (,b)). Furthermore, increased FOXK2 or depleted miR-33a-5p could reverse the effects of TP53TG1 knockdown on proliferation, migration, invasion, and apoptosis (–f)).
Figure 6. Reduced TP53TG1 inhibits the development of CC via up-regulating miR-33a-5p to suppress FOXK2. (a/b), miR-33a-5p and FOXK2 level in HeLa cells after transfection with sh-TP53TG1 or oe-TP53TG1 was detected by RT-qPCR and Western blot assay; (c), cell proliferation after transfection with sh-TP53TG1 + miR-33a-5p inhibitor or sh-TP53TG1 + oe-FOXK2 was assessed by CCK-8 assay; (d), cell migration after transfection with sh-TP53TG1 + miR-33a-5p inhibitor or sh-TP53TG1 + oe-FOXK2 was detected by scratch test; (e), cell invasion after transfection with sh-TP53TG1 + miR-33a-5p inhibitor or sh-TP53TG1 + oe-FOXK2 was determined by Transwell assay; (f), cell apoptosis after transfection with sh-TP53TG1 + miR-33a-5p inhibitor or sh-TP53TG1 + oe-FOXK2 was assessed by flow cytometry. The data in the figure were all measurement data, and the values were represented by mean ± standard deviation; ANOVA was adopted for the comparison among multiple groups and Tukey’s post hoc test was used for pairwise comparisons after ANOVA; in panel 6a and 6b, * P < 0.05 vs. the sh-TP53TG1-NC group; # P < 0.05 vs. the sh-TP53TG1 + FOXK2-NC group; $ P < 0.05 vs. the sh-TP53TG1 + miR-33a-5p-NC group.
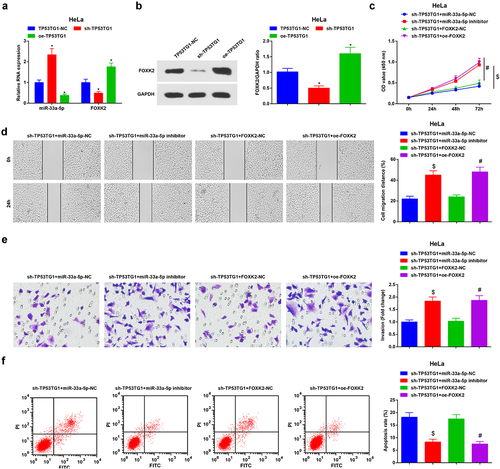
Therefore, it was concluded that TP53TG1 repressed the expression of FOXK2 by up-regulating miR-33a-5p, thus mitigating the development of CC.
TP53TG1/miR-33a-5p/FOXK2 activates the PI3K/AKT/mTOR signaling pathway via promoting related protein activity
The phosphorylation levels of PI3K, AKT and mTOR were detected by Western blot assay. The phosphorylation levels of PI3K, AKT and mTOR were depleted saliently in CC cells transfected with sh-TP53TG1, miR-33a-5p mimic or sh-FOXK2, while augmented significantly in CC cells transfected with oe-TP53TG1, miR-33a-5p inhibitor or oe-FOXK2. The reduced miR-33a-5p or enriched FOXK2 reversed the impacts of silenced TP53TG1 on phosphorylation levels of PI3K, AKT and mTOR (,b)).
Figure 7. TP53TG1/miR-33a-5p/FOXK2 activates the PI3K/AKT/mTOR signaling pathway via promoting related protein activity. (a-b), the phosphorylation levels of PI3K, AKT and mTOR in HeLa cells were detected by Western blot assay. The data in the figure were all measurement data, and the values were represented by mean ± standard deviation, one-way ANOVA was adopted for the comparison among multiple groups and Tukey’s post hoc test was used for pairwise comparisons after one-way ANOVA; * P < 0.05 vs. the TP53TG1-NC group; # P < 0.05 vs. the miR-33a-5p-NC group; & P < 0.05 vs. the FOXK2-NC group; ^ P < 0.05 vs. the sh-TP53TG1 + miR-33a-5p-NC group; % P < 0.05 vs. the sh-TP53TG1 + FOXK2-NC group.
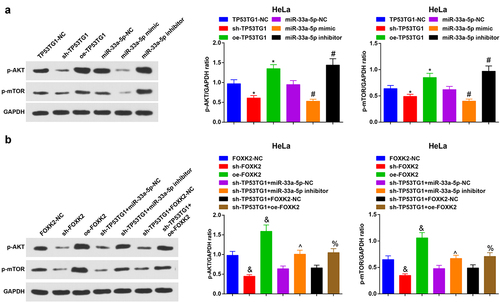
Thus, it was concluded that the silence of TP53TG1 or FOXK2 or the overexpression of miR-33a-5p inhibited the PI3K/AKT/mTOR signaling pathway. Collectively, TP53TG1/miR-33a-5p/FOXK2 activated the PI3K/AKT/mTOR signaling pathway.
Discussion
CC is one of the most malignant and life-threatening tumors with high mortality among women globally [Citation22]. In this study, we focused on the regulatory mechanism of TP53TG1 on CC progression through miR-33a-5p-mediated FOXK2 and PI3K/AKT/mTOR signaling pathways. Collectively, it was demonstrated that TP53TG1 facilitated the CC development by miR-33a-5p-mediated FOXK2 activation on PI3K/AKT/mTOR signaling pathway.
As a cancer regulator, TP53TG1 has been unveiled to display a high level in the carcinogenesis of PDAC, and the depletion of TP53TG1 blocks the development of PDAC cells, while the overexpression of TP53TG1 exhibits opposite impacts [Citation10]. Additionally, TP53TG1 also displays high expression in human glioma tissues or cell lines, whereas the reduction of TP53TG1 decelerates cell growth [Citation9]. Similarly, Yuan et al. have also elucidated that nasopharyngeal carcinoma exhibits high-expressed TP53TG1, whose augmentation functionally facilitates the malignant phenotype of nasopharyngeal carcinoma [Citation23]. Nevertheless, the studies for the exploration of the function and expression of TP53TG1 in CC were inadequate, yet the previous findings still provided valuable references for our current study. Anchored in those evidences, our study probed the function of TP53TG1 in CC, and it was found that TP53TG1 was upregulated in CC cells and tissues. The reduction of TP53TG1 effectively repressed the development of CC.
The binding relationship between TP53TG1 and miR-33a-5p was validated. It has been demonstrated that miR-33a-5p enhancement hinders cell growth and mitigates the metastatic lesion of cells in lung cancer [Citation24]. Lin et al. have also revealed that miR-33a-5p is reduced in hepatocellular carcinoma, and the amplification of miR-33a-5p induces the biological dysfunction of hepatocellular carcinoma cells [Citation25]. Furthermore, miR-33a-5p is also low-expressed in prostate cancer tissues, and the deficiency of miR-33a-5p is responsible for inducing shorter metastasis-free survival of prostate cancer patients and exacerbated pathological features [Citation26]. However, there were limited studies that had ever investigated the regulatory mechanism of miR-33a-5p in CC cells. We thus explored and verified that miR-33a-5p was depleted in CC cells and tissues, and the elevation of miR- 33a-5p suppressed the biological functions of CC cells.
Moreover, miR-33a-5p was revealed to target FOXK2 by the bioinformatic website and dual luciferase assay. Kong et al. have unearthed that the inhibition of FOXK2 effectively represses the cell growth and epithelial-mesenchymal transition in hepatocellular carcinoma [Citation27]. Identically, another study also has further validated that FOXK2 is positive-expressed in human colorectal cancer and the elevation of FOXK2 promotes the biological function of colorectal cancer cells [Citation28]. Moreover, the enrichment of FOXK2 is also related to drug resistance and malignant clinical outcomes in breast cancer patients [Citation29] as well as the poor disease-free survival time in patients with renal cell carcinoma [Citation30]. However, the research for investigating the function of FOXK2 in CC was quite insufficient. Anchored in these related studies, our research probed the impact of FOXK2 in CC, and it was demonstrated that FOXK2 was augmented in CC cells and tissues and the silence of FOXK2 drastically blocked the progression of CC cells.
Furthermore, miR-33a-5p has been revealed to decelerate the progression of melanoma via inactivation of the PI3K/AKT/mTOR signaling pathway [Citation15]. Concretely, it has been found that PI3k/Akt/mTOR protein levels were enhanced in CC patients, and the activation of PI3k/Akt/mTOR signaling pathways exacerbates the malignancy degree of CC, whereas the inactivation of PI3k/Akt/mTOR signaling pathways executes the opposite effects on CC development [Citation17,Citation31]. Concerning these previous conclusions, our study further illustrated that TP53TG1/miR-33a-5p/FOXK2 axis could regulate the PI3k/Akt/mTOR signaling pathway during the development of CC.
Collectively, this study reveals that TP53TG1 and FOXK2 are enriched and miR-33a-5p is decreased in CC cells and tissues. TP53TG1 facilitates the CC progression via mediating miR-33a-5p to target FOXK2 with the involvement of PI3K/AKT/mTOR signaling pathway. The current discovery contributes to exploring novel therapeutic strategies for CC by highlighting the importance of TP53TG1/miR-33a-5p/FOXK2 axis and PI3k/Akt/mTOR signaling pathway. However, restricted by the small sample size and limited time, whether the regulatory mechanism of TP53TG1/miR-33a-5p/FOXK2 axis was specific in CC was not discussed in the current study; gene expression and protein expression studies are also required to get more in-depth data about how TP53TG1 induces CC. These two issues could be novel research points in our future works.
Supplemental Material
Download Zip (3.6 KB)Disclosure statement
No potential conflict of interest was reported by the author(s).
Supplementary material
Supplemental data for this article can be accessed here.
Additional information
Funding
References
- Hu Z, Ma D. The precision prevention and therapy of HPV-related cervical cancer: new concepts and clinical implications. Cancer Med. 2018;7(10):5217–5236.
- Bhatla N, Aoki D, Sharma DN, et al. Cancer of the cervix uteri. Int J Gynaecol Obstet. 2018;143(Suppl 2):22–36.
- Fang J, Zhang H, Jin S. Epigenetics and cervical cancer: from pathogenesis to therapy. Tumour Biol. 2014;35(6):5083–5093.
- Bernard L, Fearon D, McFaul S, et al. Role of primary care enrolment in advanced cervical cancer diagnosis: a population-based case-control study. Int J Gynecol Cancer. 2020;30(1):29–34.
- Tsikouras P, Zervoudis S, Manav B, et al. Cervical cancer: screening, diagnosis and staging. J BUON. 2016;21(2):320–325.
- Kontostathi G, Zoidakis J, Anagnou NP, et al. Proteomics approaches in cervical cancer: focus on the discovery of biomarkers for diagnosis and drug treatment monitoring. Expert Rev Proteomics. 2016;13(8):731–745.
- Xu J, Bai J, Zhang X, et al. A comprehensive overview of lncRNA annotation resources. Brief Bioinform. 2017;18(2):236–249.
- Shao M, Ma H, Wan X, et al. Survival analysis for long noncoding RNAs identifies TP53TG1 as an antioncogenic target for the breast cancer. J Cell Physiol. 2020;235(10):6574–6581.
- Chen X, Gao Y, Li D, et al. LncRNA-TP53TG1 participated in the stress response under glucose deprivation in glioma. J Cell Biochem. 2017;118(12):4897–4904.
- Zhang Y, Yang H, Du Y, et al. Long noncoding RNA TP53TG1 promotes pancreatic ductal adenocarcinoma development by acting as a molecular sponge of microRNA-96. Cancer Sci. 2019;110(9):2760–2772.
- Rottiers V, Naar AM. MicroRNAs in metabolism and metabolic disorders. Nat Rev Mol Cell Biol. 2012;13(4):239–250.
- Talkowski K, Kiełbasiński K, Peszek W, et al. Salinomycin modulates the expression of mRNAs and miRNAs related to stemness in endometrial cancer. Curr Pharm Biotechnol. 2021;22(2):317–326.
- Guan X, Gu S, Yuan M, et al. MicroRNA-33a-5p overexpression sensitizes triple-negative breast cancer to doxorubicin by inhibiting eIF5A2 and epithelial-mesenchymal transition. Oncol Lett. 2019;18(6):5986–5994.
- Nestal de Moraes G, Carneiro L, Maia R, et al. FOXK2 transcription factor and its emerging roles in cancer. Cancers (Basel). 2019;11(3):393.
- Zhang ZR, Yang N. MiR-33a-5p inhibits the growth and metastasis of melanoma cells by targeting SNAI2. Neoplasma. 2020;67(4):813–824.
- Zhang Y, Xu M, Chen J, et al. Prognostic value of the FOXK family expression in patients with locally advanced rectal cancer following neoadjuvant chemoradiotherapy. Onco Targets Ther. 2020;13:9185–9201.
- Zhang W, Zhou Q, Wei Y, et al. The exosome-mediated PI3k/Akt/mTOR signaling pathway in cervical cancer. Int J Clin Exp Pathol. 2019;12(7):2474–2484.
- Zhang C, Liu P, Huang J, et al. Circular RNA hsa_circ_0043280 inhibits cervical cancer tumor growth and metastasis via miR-203a-3p/PAQR3 axis. Cell Death Dis. 2021 Sep 29;12(10):888.
- Li J, Guo R, Liu Q, et al. Circular RNA Circ-ITCH inhibits the malignant behaviors of cervical cancer by microRNA-93-5p/FOXK2 axis. Reprod Sci. 2020;27(3):860–868.
- Liu M, Yu J, Wang D, et al. Epigenetically upregulated MicroRNA-602 is involved in a negative feedback loop with FOXK2 in esophageal squamous cell carcinoma. Mol Ther. 2019;27(10):1796–1809.
- Lin MF, Yang Y-F, Peng Z-P, et al. FOXK2, regulated by miR-1271-5p, promotes cell growth and indicates unfavorable prognosis in hepatocellular carcinoma. Int J Biochem Cell Biol. 2017;88:155–161.
- Wang L, Zhao Y, Wang Y, et al. The role of galectins in cervical cancer biology and progression. Biomed Res Int. 2018;2018:2175927.
- Yuan J, Jiang -Y-Y, Mayakonda A, et al. Super-enhancers promote transcriptional dysregulation in nasopharyngeal carcinoma. Cancer Res. 2017;77(23):6614–6626.
- Pan J, Fang S, Tian H, et al. lncRNA JPX/miR-33a-5p/Twist1 axis regulates tumorigenesis and metastasis of lung cancer by activating Wnt/beta-catenin signaling. Mol Cancer. 2020;19(1):9.
- Lin C, Xiang Y, Sheng J, et al. Long non-coding RNA CRNDE promotes malignant progression of hepatocellular carcinoma through the miR-33a-5p/CDK6 axis. J Physiol Biochem. 2020;76(3):469–481.
- Dai Y, Wu Z, Lang C, et al. Copy number gain of ZEB1 mediates a double-negative feedback loop with miR-33a-5p that regulates EMT and bone metastasis of prostate cancer dependent on TGF-beta signaling. Theranostics. 2019;9(21):6063–6079.
- Kong J, Zhang Q, Liang X, et al. FOXK2 downregulation suppresses EMT in hepatocellular carcinoma. Open Med (Wars). 2020;15(1):702–708.
- Du F, Qiao C, Li X, et al. Forkhead box K2 promotes human colorectal cancer metastasis by upregulating ZEB1 and EGFR. Theranostics. 2019;9(13):3879–3902.
- Nestal de Moraes G, Khongkow P, Gong C, et al. Forkhead box K2 modulates epirubicin and paclitaxel sensitivity through FOXO3a in breast cancer. Oncogenesis. 2015;4(9):e167.
- Jia Z, Wan F, Zhu Y, et al. Forkhead-box series expression network is associated with outcome of clear-cell renal cell carcinoma. Oncol Lett. 2018;15(6):8669–8680.
- Li YJ, Wang Y, Wang YY. MicroRNA-99b suppresses human cervical cancer cell activity by inhibiting the PI3K/AKT/mTOR signaling pathway. J Cell Physiol. 2019;234(6):9577–9591.