
ABSTRACT
Osteosarcoma (OS) is a malignant tumor with a low survival rate and a high incidence rate worldwide. Although research has reported the involvement of long non-coding RNAs (lncRNAs) in the pathogenesis of OS cells, the role of TRPM2-AS, miR-15b-5p, and PPM1D in OS progression remains unclear. This study aimed to examine the interaction of the TRPM2-AS/miR-15b-5p/PPM1D axis in OS cells to gain new insights into the molecular mechanism and pathogenesis of OS. After performing in vitro functional assays, we discovered that TRPM2-AS was overexpressed in OS cells. TRPM2-AS silencing impaired OS cell viability, proliferation, and migration, while it induced apoptosis in OS cells in vitro. Our experimental analysis also revealed that PPM1D is a direct target of miR-15b-5p. TRPM2-AS silencing was found to reverse the tumorigenic effect of the miR-15b-5p inhibitor, while the miR-15b-5p inhibitor restored the inhibition of OS caused by silencing PPM1D. Moreover, our findings revealed that miR-15b-5p exerted its tumor-suppressive role by directly targeting PPM1D. In conclusion, this study suggests that TRPM2-AS could promote OS cell malignancy by sponging miR-15b-5p/PPM1D axis.
KEYWORDS:
Introduction
Osteosarcoma (OS) is an aggressive malignant tumor that originates from the bones and is prevalent among adolescents and young adults [Citation1]. Because this tumor poses a severe health threat, early diagnosis and treatment are crucial in improving a patient’s chances of survival. To date, surgery, radiotherapy, and chemotherapy are the most common treatment methods for OS [Citation1]. However, the clinical efficacy of these therapeutic strategies falls far short compared to the actual health needs of patients. Some of these treatment approaches are often associated with the risk of recurrence and many side effects. Hence, alternative clinical strategies are needed to improve the well-being and quality of life of patients with this disease.
In recent years, the clinical usefulness of biomarkers, such as non-coding RNAs, in cancer treatment has been considered. Long non-coding RNAs (lncRNAs) are generally defined as RNA molecules with lengths >200 nucleotides [Citation2]. Although lncRNAs have no protein-coding functions, they are essential regulators of gene expression and they influence various tumorigenic processes [Citation3,Citation4]. TRPM2 antisense RNA (TRPM2-AS), an lncRNA, plays a significant role in carcinogenesis. TRPM2-AS knockdown induces cell apoptosis and cell cycle arrest in prostate cancer cells [Citation5]. On the other hand, overexpression of TRPM2-AS exerted proliferation-promoting and apoptosis-inhibiting effects on breast cancer cell lines [Citation6]. Expression of TRPM2-AS represses metastasis in gastric cancer cells [Citation7]. However, the function of TRPM2-AS requires further investigation.
MicroRNAs (miRNAs), a class of small non-coding RNAs, have been reported to be involved in carcinogenesis. Studies have also reported that miR-15b exerts different effects on different types of cancer. In the literature, a lower expression miR-15b was found in cells of gliomas [Citation8], tongue cancer [Citation9], and ovarian cancer [Citation10]. However, other studies revealed that miR-15b promotes liver cancer [Citation11], mantle cell lymphoma [Citation12], and gastric cancer [Citation13], thereby resulting in the poor prognosis of patients. However, there remains a paucity of evidence on the regulatory effects of miR-15b-5p on OS cells.
Protein phosphatase magnesium/manganese-dependent 1D (PPM1D) has been found to function as an oncogene in several cancers, such as breast carcinoma [Citation14], esophageal carcinoma [Citation15], and lung carcinoma [Citation16]. In 2002, researchers demonstrated for the first time that PPM1D was highly expressed in breast cancer cells, a finding that was considered novel in the field of cancer biomarkers that time [Citation17]. Since then, there has been an explosion of tumor-associated research on PPM1D, including its effects on OS progression. In WIP1, PPM1D has been shown to be upregulated in OS [Citation18]. Nonetheless, in the cancer literature, there are no studies regarding the relationship between PPM1D, TRPM2-AS, and miR-15b-5p in OS cells.
In the present study, we investigated the regulatory interactions of the TRPM2-AS/miR-15b-5p/PPM1D axis in OS cells to gain new insights into the molecular mechanism and pathogenesis of OS. We believe that the identification of OS-associated molecules would provide novel clues for the diagnosis and treatment of OS.
Materials and methods
Tissue collection
We collected tumor tissues and adjacent healthy tissues from 18 patients with OS from our hospital. This collection was performed with the approval of the ethics committee of our hospital. The tissues collected from patients were immediately stored in liquid nitrogen. Patients who received radiotherapy or chemotherapy were not allowed to participate in the study. All participants signed an informed consent form before enrolling in the experimental study. Supplemental Table S1 shows the clinical characteristics of the 18 patients with OS.
Cell culture
OS cell lines (HOS, U2OS, Saos-2, and SJSA-1) and the human normal osteoblast cell line (hFOB 1.19) were purchased from the American Type Culture Collection (ATCC, USA). The cells were cultured in DMEM (Solarbio, China) supplemented with 10% (v/v) fetal calf serum (Invitrogen, USA) and 1% penicillin-streptomycin solution (Sigma, USA). Cell culture was performed at 37°C in a humidified atmosphere containing 5% CO2.
Cell transfection
A TRPM2-AS overexpression plasmid, TRPM2-AS shRNA (sh-TRPM2-AS), miR-15b-5p mimic, miR-15b-5p inhibitor, sh-PPM1D, and their corresponding negative controls, including pcDNA3.1 empty vector, shRNA negative control, miRNA mimic negative control, and miRNA inhibitor negative control were constructed by GenePharma (Shanghai, China) and were transfected into the cells used in this study.
For cell transfection, 2 × 10⁵ HOS and SJSA-1 cells were plated into each well of a 6-well plate and cultured in a humidified atmosphere containing 5% CO2 at 37°C. After the cells reached a density of 50%, 50 nM oligonucleotides or 1 µg plasmid were transfected into HOS and SJSA-1 cells using Lipofectamine 2000 Transfection Reagent (Invitrogen). Cells that were not subject to transfection were deemed as the blank control. After 48 h of transfection, the transfected cells were collected and subjected to subsequent experiments.
qRT-PCR
Total RNA from tissue samples and cells was extracted using TRIzol Reagent (Invitrogen) and quantified using a NanoDrop 2000 (Thermo Fisher Scientific, USA). Next, for the detection of TRPM2-AS and PPM1D, reverse transcription PCR was performed by transcribing 1 µg of total RNA using the PrimeScript RT Reagent Kit (Takara, Japan). qPCR was then conducted to determine the expression of TRPM2-AS and PPM1D using the Roche Diagnostics-produced SYBR Green Real-Time PCR Master Mix (Switzerland) in an ABI 7500 PCR System. GAPDH was used as an internal control. For miR-15b-5p detection, the extracted total RNA was first reverse-transcribed using the miRcute miRNA First Strand cDNA Synthesis kit (TIANGEN, China). The expression level of miR-15b-5p was detected using the TaqMan microRNA Assay Kit (Thermo Fisher Scientific), with U6 as the reference control. Relative expression was analyzed using the 2−ΔΔCt method. The sequences of the primers are presented in Supplemental Table S2.
Subcellular localization assay
For the determination of lncRNA subcellular localization, total RNA in the cytoplasmic and nuclear fractions was first isolated separately using the PARIS™ Kit (Thermo Fisher Scientific), according to the manufacturer’s instructions. Afterward, the total RNA in the cytoplasm and nucleus was reverse-transcribed, and the expression level of TRPM2-AS was determined via qRT-PCR.
CCK-8 assay
Cell viability was measured using the Cell Counting Kit-8 (CCK-8, GlpBio, USA) assay. HOS and SJSA-1 cells (2 × 10³ cells/well) were seeded into 96-well plates and incubated for 0, 24, 48, and 72 h at 37°C in a humidified atmosphere containing 5% CO2. Subsequently, the CCK-8 solution (10 µL/well) was added, and the mixture was incubated for another 2 h. Finally, the relative absorbance at 450 nm was measured using a microplate reader (Bio-Rad, USA).
5-bromo-2-deoxyuridine (BrdU) assay
The Cell Proliferation ELISA-BrdU Kit (Roche Diagnostics, USA) was utilized in this study according to the manufacturer’s instructions to detect OS cell proliferation. In brief, HOS and SJSA-1 cells (2 × 10³ cells/well) were seeded into 96-well plates and cultured overnight at 37°C. The cells were then incubated with 10 μM BrdU for 3 h to label the DNA of proliferating cells. Next, the cells were washed twice with PBS. Then, the cells were fixed for 30 min in 200 μL followed by staining with 100 μL anti-BrdU antibody working solution for 1.5 h at room temperature. The cells were then washed with PBS three times and incubated with 100 μL of substrate solution for 15 min. Finally, the absorbance of each well was measured at 370 nm using a microplate reader.
Wound healing assay
HOS and SJSA-1 cells (2.5 × 10⁶ cells/well) were cultured in 6-well plates. After the cell confluence reached 100%, the cells monolayers were scratched with a 200-μL pipette tip, and the floating cells were gently removed by washing the wells three times with PBS. Then, the cells were cultured for another 24 h in serum-free culture medium. Representative images were captured at 0 and 24 h, and the distances between the cells were measured using ImageJ software (National Institutes of Health, USA). The relative migration rate was measured using the formula: (W0h−W24 h)/W0 h × 100%, where W represents the wound width.
Caspase-3 activity assay
The Caspase-3 Activity Assay Kit (Abcam, UK) was used to assess cell apoptosis. As per the manufacturer’s instructions, HOS and SJSA-1 cells (2 × 10³ cells/well) were seeded in 96-well plates and cultured overnight with DMEM containing 10% fetal calf serum (FCS). Then, the culture medium was removed, and the cells were gently washed with FCS-free phenol-red free media (PRFM). Next, 90 µL of PRFM (+5% FCS) and 10 µL of 100 µM staurosporine was consecutively added into each cell well and incubated for 4.5 h at 37°C. Subsequently, the cells were washed three times with ice-cold PBS and lysed with 100 µL of cold caspase cell lysis buffer on ice for 10 min. The cell lysates were then collected and 100 µL of the reaction mix was added to the samples, controls, and standards. Then, the absorbance at 405 nm was measured and recorded every minute for 1–2 h at room temperature using a microplate reader.
Dual-luciferase reporter assay
HOS and SJSA-1 cells (2 × 10³ cells/well) were seeded in 96-well-pates. To confirm the interaction between miR-15b-5p and TRPM2-AS, wild-type or mutant TRPM2-AS sequences with or without the predicted binding site of miR-15b-5p were subcloned into pGL3-basic vectors (Promega, USA). After that, they were transfected into HOS and SJSA-1 cells together with a miR-15b-5p mimic or miRNA mimic NC. To examine the interaction between miR-15b-5p and PPM1D, wild-type and mutant PPM1D sequences with or without the predicted binding site of miR-15b-5p were subcloned into pmiR-GLO vectors (Promega). They were then transfected into HOS and SJSA-1 cells together with a miR-15b-5p mimic or miRNA mimic NC. HOS and SJSA-1 cells were harvested and lysed after 48 h of transfection, and their firefly and Renilla luciferase activities were measured using the Dual-Luciferase Reporter Assay Kit (Promega, USA). Firefly luciferase activity was normalized to Renilla luciferase activity.
RNA binding protein immunoprecipitation (RIP) assay
This assay was performed using the Magna RIP RNA-Binding Protein Immunoprecipitation Kit (Millipore, USA). Briefly, 100 μL of RIP lysis buffer was added to lyse the cells. Then, magnetic beads, which were conjugated with 5 μg anti-Ago2 antibody or normal mouse IgG as the negative control, were added to 200 μL cell lysates and incubated at 4°C overnight. The beads were then collected via centrifugation and Proteinase K buffer was subsequently added to degrade the proteins in the cell lysates. Next, the immunoprecipitated RNA was extracted and reverse-transcribed, and the abundance of TRPM2-AS was detected via qRT-PCR.
RNA pull-down assay
The Pierce RNA 3’ End Desthiobiotinylation Kit (Thermo Fisher Scientific) was used to perform the RNA pull-down assay, according to the manufacturer’s instructions. Briefly, HOS and SJSA-1 cells (2 × 10⁴ cells/well) were plated in 24-well plates. After overnight culture, the cells were transfected with 50 nM of biotinylated miR-15b-5p mimic or negative control (GenePharma). The cells were then lysed with a lysis buffer and incubated for 3 h with streptavidin magnetic beads (Life Technologies, USA). After incubation, the beads were washed with PBS, and the RNA interacting with miRNA was extracted. The abundance of PPM1D was evaluated through qRT-PCR analysis.
Detection of protein levels
Total protein was extracted from OS cells using a RIPA Buffer (Beyotime, China), performed according to the manufacturer’s instructions. After separating the proteins using SDS-PAGE (10% gel), they were electronically transferred onto PVDF membranes (BioRad). Afterward, the membranes were blocked with 5% bovine serum albumin (BSA)/PBS at room temperature for 2 h, and then incubated with primary antibodies (PPMID, caspase-3, cleaved-caspase-3, Bax, Bcl-2, and GAPDH; 1:2000) at 4°C overnight. After washing the membranes five times with PBS to remove the primary antibodies, the membranes were incubated with HRP-conjugated secondary antibody. Finally, the protein signal was detected using the Enhanced Chemiluminescent (ECL) Reagent Kit (Amersham Life Science, UK). All antibodies used in this study were obtained from Abcam (Cambridge, UK).
Statistical analysis
All experimental analyses were performed in triplicate, and all statistical computations were performed using GraphPad Prism version 8. Data are presented as means ± standard deviation (SD). Student’s t-test and one-way ANOVA were used to statistically compare two groups and more than two groups, respectively. Statistical significance was set at P < 0.05. Notably, *P < 0.05, and **P < 0.001 were obtained by comparing the blank control group in . #P < 0.05, and ##P < 0.001 were obtained by comparing the sh-TRPM2-AS group in and comparing the inhibitor group in .
Results
Identification of the miRNA of interest
A bioinformatics method was used in this study to identify potential molecules of interest in OS. Previous studies have explored the impact of TRPM2-AS in a variety of human cancers, such as gastric carcinoma [Citation19] and lung carcinoma [Citation20]. However, the role of TRPM2-AS in OS has not yet been explored. Here, three miRNAs were identified by finding the intersection of the predicted target miRNAs of TRPM2-AS and the differentially expressed miRNAs in the GSE65071 data series, with adjusted P < 0.05 and log FC<-1 (). Among the three miRNAs (miR-15b-5p, miR-103a-3p, and miR-107), miR-15b-5p was selected as the miRNA of interest because it was significantly downregulated in OS [Citation21]. After examining the intersection of the predicted target mRNAs of miR-15b-5p using the TargetScan Human 7.2 database and the differentially expressed mRNAs from the GSE11416 data series with adjusted P < 0.05 and log FC>1.5, 73 mRNAs were identified (). We then uploaded the 73 mRNAs to WebGestalt (http://www.webgestalt.org/option.php) to enrich the 73 corresponding genes. The P53 signaling pathway was found to be the most significantly enriched term. Of the 73 genes identified, CCND2, CCNE1, CDK1, CDK6, and PPM1D were involved in this pathway (). Among these five genes, PPM1D was found to function as an oncogene in human cancers, such as lung cancer [Citation22], pancreatic cancer [Citation23], and colorectal cancer [Citation24]. However, the effect of PPM1D has only been studied in OS [Citation25], and more comprehensive studies are needed to elucidate the role of PPM1D in OS.
Figure 1. Identification of miR-15b-5p and PPM1D as study objects. (a) Venn diagram showing the intersection between the TRPM2-AS target miRNAs predicted via the ENCORI starBase (http://starbase.sysu.edu.cn) and the differentially expressed miRNAs of the GSE65071 data series with the criteria of adjusted P < 0.05 and log FC < −1. FC: fold change. (b) Venn diagram showing the intersection between the target miR-15b-5p mRNAs predicted via TargetScan Human 7.2 (http://targetscan.org/vert_72) and the differentially expressed mRNAs of the GSE11416 data series with the criteria of adjusted P < 0.05 and log FC > 1.5. (c) Bar graph showing the enriched KEGG pathways that the intersected genes in Figure 1(b) were involved in. (d) TRPM2-AS expression in osteosarcoma and corresponding non-tumor tissues derived from 18 OS patients, as measured via RT-qPCR. (e) TRPM2-AS expression in osteosarcoma cell lines (HOS, U2OS, Saos-2, and SJSA-1) and human normal osteoblast cell line (hFOB1.19), as measured via RT-qPCR. GAPDH served as a control. The relative target gene level was calculated by normalizing them to GAPDH in each group to its corresponding value in the hFOB1.19 group. **P < 0.001 compared with the hFOB1.19 cells. (f) Intracellular distribution of TRPM2-AS in HOS and SJSA-1 cells, determined by detecting the nuclear and cytoplasmic TRPM2-AS expression via RT-qPCR. Data are represented as the mean ± SD. All cellular experiments were performed in triplicates.
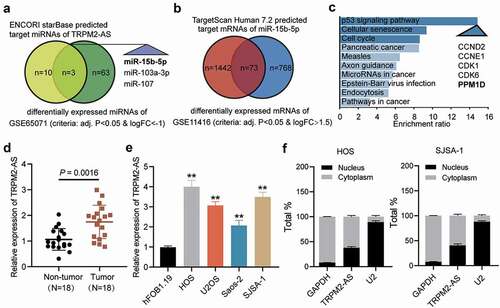
Briefly, qRT-PCR was performed to determine the expression of TRPM2-AS in OS tumor tissues and corresponding non-tumor tissues. As shown in , TRPM2-AS expression in tumor tissues was approximately 50% higher than those in the corresponding non-tumor tissues. We also analyzed TRPM2-AS expression in OS cell lines (HOS, U2OS, Saos-2, and SJSA-1) and the human osteoblastic cell line (hFOB1.19) and found that TRPM2-AS expression in the four OS cell lines was more than twice that in hFOB1.19 (). Because HOS and SJSA-1 cells had the highest TRPM2-AS expression, they were selected for further verification. In the cell, TRPM2-AS was found mainly in the cytoplasm (). Taken together, our results revealed that TRPM2-AS might facilitate OS progression.
TRPM2-AS facilitates OS progression
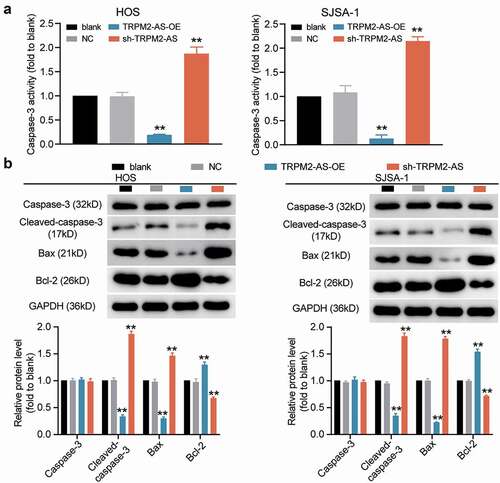
To explore the biological functions of TRPM2-AS in OS progression, we transfected TRPM2-AS shRNA and its corresponding overexpression plasmid in HOS and SJSA-1 cells. The RT-qPCR results indicated that TRPM2-AS expression was enhanced 2-fold after transfecting the TRPM2-AS overexpression plasmid, and it was reduced by about 70% after transfection with shRNA (). Based on this high transfection efficiency, several downstream verification assays were performed. First, the CCK-8 assay results showed that silencing TRPM2-AS remarkably inhibited the viability of HOS and SJSA-1 cells, while overexpression of TRPM2-AS showed the opposite effect (). The BrdU assay data revealed that TRPM2-AS knockdown repressed the proliferation ability of HOS and SJSA-1 cells by 50%; however, TRPM2-AS overexpression accelerated it by 50% compared to the blank control group (). The wound-healing assay results showed that, compared to the blank control group, TRPM2-AS knockdown inhibited the migration ability of OS cells by 50%, while TRPM2-AS overexpression promoted migration in HOS and SJSA-1 cells (). As for the outcome of the caspase-3 activity assay, compared to the blank control group, TRPM2-AS silencing increased the caspase-3 activity of HOS and SJSA-1 cells by 2-fold, whereas TRPM2-AS overexpression suppressed it by 70% (). Furthermore, the Western blot assay results indicated that TRPM2-AS silencing increased the levels of pro-apoptotic proteins (cleaved-caspase-3 and Bax); however, a decrease in anti-apoptotic proteins (Bcl-2) was found in contrast to the blank control group. At the same time, TRPM2-AS overexpression suppressed the expression of cleaved-caspase-3 and Bax, while it promoted the expression of Bcl-2 in both HOS and SJSA-1 cells, in contrast to the blank control group (). These results suggest that TRPM2-AS can 8facilitate the progression of OS.
Figure 2. TRPM2-AS facilitates osteosarcoma cell proliferation and migration. (a) TRPM2-AS expression level in HOS and SJSA-1 cells with TRPM2-AS overexpression (TRPM2-AS-OE) and TRPM2-AS knockdown (sh-TRPM2-AS), as detected via qRT-PCR. GAPDH served as a control. The relative target gene level was calculated by normalizing them to GAPDH in each group to its corresponding value in the blank group. (b) The viability of HOS and SJSA-1 cells was detected at 0, 24, 48, and 72 h using a CCK-8 assay. (c) The proliferation of HOS and SJSA-1 cells was detected using a BrdU assay. Statistical data were obtained by normalizing the original OD value in each group to those in the blank group. (d) Cell migration ability of HOS and SJSA-1 cells was detected using a wound healing assay. The migration rate was calculated as follows: (Width0h – Width24h)/ Width0h × 100%. Width: the mean wound width. (a–d) Cells were transfected with TRPM2-AS-OE or sh-TRPM2-AS. Blank: blank control; NC: shRNA negative control together with the pcDNA3.1 empty vector; TRPM2-AS-OE: TRPM2-AS overexpression vector; sh-TRPM2-AS: TRPM2-AS shRNA. Data are represented as the mean ± SD. All cellular experiments were performed in triplicates. *P < 0.05, **P < 0.001 compared with the blank control group.
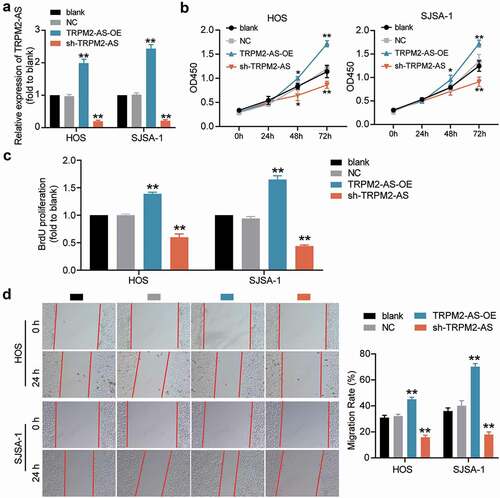
Figure 3. TRPM2-AS inhibits osteosarcoma cell apoptosis. (a) Apoptosis of HOS and SJSA-1 cells was detected using a caspase-3 activity assay. Statistical data were obtained by normalizing the original OD value in each group to its corresponding value in the blank group. (b) The relative protein level of proapoptotic proteins (Cleaved-caspase-3 and Bax) and antiapoptotic protein (Bcl-2) in HOS and SJSA-1 cells was evaluated via Western blot assay. GAPDH served as a control. The relative level of the target proteins was calculated by normalizing their relative density to GAPDH in each group to their corresponding value in the blank group. (a–b) Cells were transfected with TRPM2-AS-OE or sh-TRPM2-AS. Blank: blank control; NC: shRNA negative control together with the pcDNA3.1 empty vector; TRPM2-AS-OE: TRPM2-AS overexpression vector; sh-TRPM2-AS: TRPM2-AS shRNA. Data are represented as the mean ± SD. All cellular experiments were performed in triplicates. **P < 0.001 compared with the blank control group.
TRPM2-AS sponges miR-15b-5p in OS
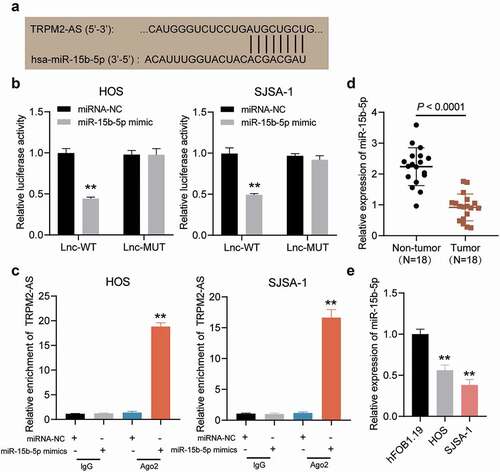
The ENCORI starBase platform was used to examine whether miR-15b-5p could be a target of TRPM2-AS. depicts the potential matching sites of TRPM2-AS with miR-15b-5p. The target relationship was confirmed, and it was discovered that luciferase activity was suppressed by 50% in HOS and SJSA-1 cells co-transfected with miR-15b-5p mimic and TRPM2-AS-WT (). In addition, the RIP assay results confirmed that TRPM2-AS could be pulled down by anti-Ago2 in HOS and SJSA-1 cells compared to the blank control group (). Moreover, miR-15b-5p expression in OS tissues was lower in the corresponding non-tumor tissues (). In addition, miR-15b-5p expression was negatively correlated with TRPM2-AS expression in OS tissues (). Collectively, these results indicated that TRPM2-AS could act as a sponge for miR-15b-5p in OS.
Figure 4. TRPM2-AS sponges miR-15b-5p in osteosarcoma. (a) The potential matching site between TRPM2-AS and miR-15b-5p, as predicted via ENCORI starBase. (b) Dual-luciferase reporter assay in HOS and SJSA-1 cells co-transfected with miR-15b-5p mimic or miRNA mimic-NC (miRNA-NC) and TRPM2-AS-WT (Lnc-WT) or TRPM2-AS-MUT (Lnc-MUT) reporter plasmids. **P < 0.001 compared with miRNA-NC. (c) The interaction between TRPM2-AS and miR-15b-5p in HOS and SJSA-1 cells, as evaluated via RIP analysis. **P < 0.001 compared with anti-IgG. (d) miR-15b-5p expression in osteosarcoma tissues, as detected via RT-qPCR. (e) miR-15b-5p expression in HOS and SJSA-1 cells, as detected via RT-qPCR. All cellular experiments were performed in triplicates. **P < 0.001 compared with hFOB1.19 cells. Data are represented as the mean ± SD.
TRPM2-AS facilitates OS progression by inhibiting miR-15b-5p
Given that TRPM2-AS acted as a sponge for miR-15b-5p in OS, we designed rescue experiments to determine whether TRPM2-AS facilitated OS progression through miR-15b-5p. As shown in Supplementary Figure S1, compared to the blank control group, TRPM2-AS silencing decreased TRPM2-AS expression by 60%; however, it increased miR-15b-5p expression by more than 80%. The miR-15b-5p inhibitor had no effect on TRPM2-AS expression, but it decreased miR-15b-5p expression by 70%. The results of the CCK-8 assay indicated that the miR-15b-5p inhibitor enhanced the viability of HOS and SJSA-1 cells; however, this enhancement was abolished by silencing TRPM2-AS (). Next, a BrdU assay was conducted to explore the effect of miR-15b-5p on the proliferation of HOS and SJSA-1 cells. The results demonstrated that, compared to the blank control group, the miR-15b-5p inhibitor exerted a positive effect on cell proliferation, increasing it by almost 50%; however, TRPM2-AS silencing reversed this effect (). The wound healing assay revealed that the miR-15b-5p inhibitor enhanced the migration abilities of HOS and SJSA-1 cells; however, this enhancement was reversed by silencing TRPM2-AS (). The caspase-3 activity assay findings showed that the miR-15b-5p inhibitor suppressed the caspase-3 activity of the cells by 60% compared to the blank control group; however, this suppression was restored by co-transfecting the miR-15b-5p inhibitor with sh-TRPM2-AS (). Moreover, the Western blot assay data demonstrated that the miR-15b-5p inhibitor reduced the expression of pro-apoptotic proteins (Cleaved-caspase-3 and Bax) in HOS and SJSA-1 cells, while it elevated the expression of an anti-apoptotic protein (Bcl-2) compared to the blank control group. However, these effects were reversed by silencing TRPM2-AS (). Taken together, our data demonstrated that TRPM2-AS facilitates OS progression by inhibiting miR-15b-5p.
Figure 5. TRPM2-AS facilitates osteosarcoma cell proliferation and migration through the inhibition of miR-15b-5p. (a) CCK-8 assay was performed to detect OS cell viability at 0, 24, 48, and 72 h. (b) BrdU assay was used to detect cell proliferation. Statistical data were obtained by normalizing the original OD value in each group to its corresponding value in the blank group. (c) Wound healing assay was used to detect cell migration. The relative migration rate was measured using the following formula: (W0h−W24 h)/W0 h × 100%, where W represented wound width. (a-c) HOS and SJSA-1 cells were transfected with TRPM2-AS knockdown, miR-15b-5p inhibitor, TRPM2-AS knockdown plus miR-15b-5p inhibitor, or negative control. Blank: blank control; NC: shRNA negative control together with miRNA inhibitor negative control; sh-TRPM2-AS: TRPM2-AS shRNA; inhibitor: miR-15b-5p inhibitor. Data are represented as the mean ± SD. All cellular experiments were performed in triplicates. * P < 0.05, ** P < 0.001 compared with the blank control group. ## P < 0.001 compared with the sh-TRPM2-AS group.
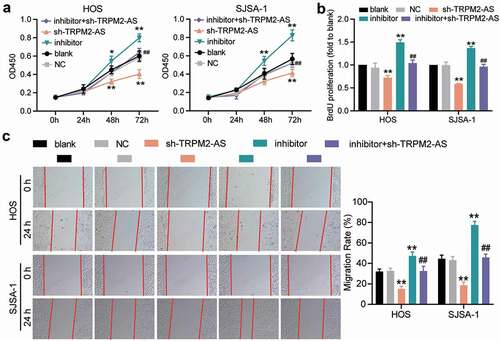
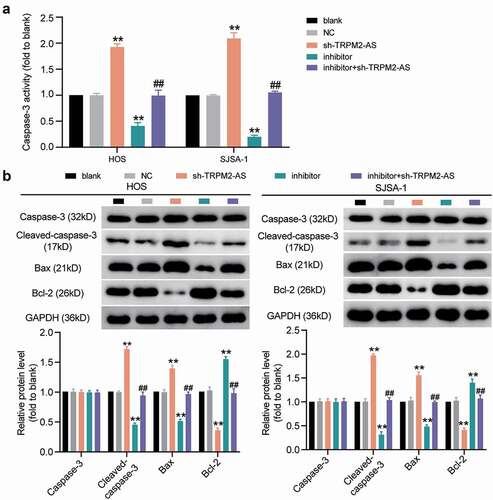
Figure 6. TRPM2-AS inhibits osteosarcoma cell apoptosis through the inhibition of miR-15b-5p. (a) Caspase-3 activity assay was used to detect cell apoptosis. Statistical data were obtained by normalizing the original OD value in each group to its corresponding value in the blank group. (b) Western blot assay was used to measure the relative protein level of proapoptotic proteins (Cleaved-caspase-3 and Bax) and antiapoptotic protein (Bcl-2) in HOS and SJSA-1 cells. GAPDH served as a control. The relative level of target proteins was calculated by normalizing their relative density to GAPDH in each group to its corresponding value in the blank group. (a-b) HOS and SJSA-1 cells were transfected with TRPM2-AS knockdown, miR-15b-5p inhibitor, TRPM2-AS knockdown plus miR-15b-5p inhibitor, or negative control. Blank: blank control; NC: shRNA negative control together with miRNA inhibitor negative control; sh-TRPM2-AS: TRPM2-AS shRNA; inhibitor: miR-15b-5p inhibitor. Data are represented as the mean ± SD. All cellular experiments were performed in triplicates. ** P < 0.001 compared with the blank control group. ## P < 0.001 compared with the sh-TRPM2-AS group.
PPM1D is a target of miR-15b-5p in OS cells
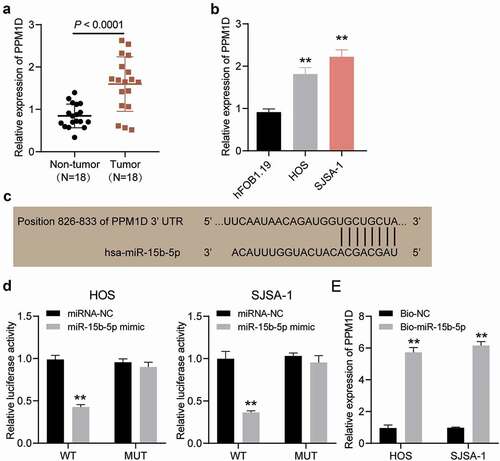
We observed PPM1D expression in OS tumor tissues and non-tumor tissues and found that PPM1D expression levels in tumor tissues were almost twice as much as those in non-tumor tissues (). Subsequently, we performed qRT-PCR and observed that PPM1D expression in HOS and SJSA-1 cells was higher than that in hFOB1.19 cells (). The binding site on the 3′-untranslated region (3′-UTR) of PPM1D was predicted using TargetScan (). A luciferase assay was performed to determine the target relationship of these molecules, and the results of this assay indicated that the luciferase activity of HOS and SJSA-1 cells was repressed by approximately 60%, but there was no significant change in other co-transfection groups (). In addition, the RNA pull-down assay results showed that PPM1D was significantly suppressed in HOS and SJSA-1 cells by 6-fold compared to the Bio-NC group (). Hence, PPM1D could be targeted by miR-15b-5p in OS cells.
Figure 7. PPM1D is a target of miR-15b-5p in osteosarcoma cells. (a) PPM1D expression in osteosarcoma tissues and corresponding normal tissues, as detected via RT-qPCR. (b) PPM1D mRNA expression in HOS and SJSA-1 cells, as detected via RT-qPCR. ** P < 0.001 compared with hFOB1.19. (c) Detection of binding sites of miR-15b-5p and PPM1D via TargetScan. (d) Dual-luciferase reporter assay was conducted in HOS and SJSA-1 cells co-transfected with miR-15b-5p mimic or mimic NC and wild type or mutant type of PPM1D 3’-UTR luciferase reporter plasmids. ** P < 0.001 compared with miR-15b-5p mimic NC. WT: PPM1D 3’-UTR wild type; MUT: PPM1D 3’-UTR mutant type. (e) RNA pull-down assay was performed to determine the interaction between PPM1D and miR-15b-5p in HOS and SJSA-1 cells. ** P < 0.001 compared to Bio-NC. Bio-miR-15b-5p: biotin-labeled miR-15b-5p mimic; Bio-NC: biotin-labeled miRNA mimic negative control. Data are represented as the mean ± SD. All cellular experiments were performed in triplicates.
miR-15b-5p regulates the promotive effect of PPM1D on OS
To understand the interaction between miR-15b-5p and PPM1D in OS cells, rescue experiments were performed. The transfection efficiency of PPM1D shRNA (for PPM1D knockdown) in HOS and SJSA-1 cells was determined by performing a Western blot assay (), which revealed that PPM1D shRNA attenuated PPM1D protein expression. Subsequently, a CCK-8 assay was carried out, and the results indicated that PPM1D shRNA reduced the viability of OS cells; however, this effect was restored upon treatment with the miR-15b-5p inhibitor (). In addition, the BrdU assay results demonstrated that, compared to the blank control group, the knockdown of PPM1D in HOS and SJSA-1 cells led to an approximately 30% reduction in cell proliferation, and this reduction could be restored by the miR-15b-5p inhibitor (). The wound healing assay revealed that PPM1D knockdown suppressed the migration of HOS and SJSA-1 cells by 55% compared to the blank control group, while the miR-15b-5p inhibitor abrogated this suppression of cell migration caused by PPM1D shRNA (). Finally, caspase-3 activity assay results revealed that PPM1D shRNA promoted the caspase-3 activity of HOS and SJSA-1 cells by 2-fold compared to the blank control group; however, this effect was reversed by the miR-15b-5p inhibitor (). Similarly, the Western blot assay results showed that PPM1D knockdown significantly elevated the level of pro-apoptotic proteins (cleaved-caspase-3 and Bax), while it suppressed the protein level of anti-apoptotic proteins (Bcl-2) compared to the blank control group. More importantly, these consequences could be effectively abrogated via transfection with a miR-15b-5p inhibitor (). Our data showed that miR-15b-5p suppressed the viability, proliferation, and migration of OS cells, but induced cell apoptosis in OS by inhibiting PPM1D. Overall, these results confirmed that TRPM2-AS promoted OS carcinogenesis by sponging miR-15b-5p and releasing PPM1D.
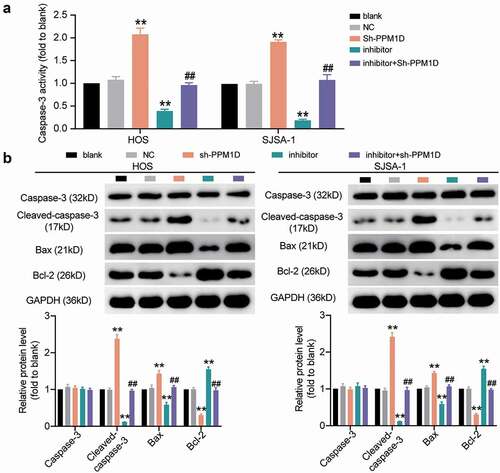
Figure 8. The promoting effect of PPM1D on osteosarcoma cell proliferation and migration is negatively regulated by miR-15b-5p. (a) The relative expression of PPM1D in HOS and SJSA-1 cells transfected with PPM1D shRNA and/or miR-15b-5p inhibitor, as determined via Western blot assay. GAPDH served as a control. The relative level of target proteins was calculated by normalizing their relative density to GAPDH in each group to their corresponding value in the blank group. (b) CCK-8 assay was performed to detect OS cell viability at 0, 24, 48, and 72 h. (c) BrdU assay was used to detect cell proliferation. Statistical data were obtained by normalizing the original OD value in each group to that in the blank group. (d) Wound healing assay was used to detect cell migration. The relative migration rate was measured using the following formula: (W0h−W24 h)/W0 h × 100%, where W represented wound width. (a-d) HOS and SJSA-1 cells were transfected with PPM1D shRNA, miR-15b-5p inhibitor, PPM1D shRNA plus miR-15b-5p inhibitor, or negative control. Blank: blank control; NC: shRNA negative control together with miRNA inhibitor negative control; sh-PPM1D: PPM1D shRNA; inhibitor: miR-15b-5p inhibitor. Data are represented as the mean ± SD. All cellular experiments were performed in triplicates. ** P < 0.001 compared with blank control group. ## P < 0.001 compared with inhibitor group.
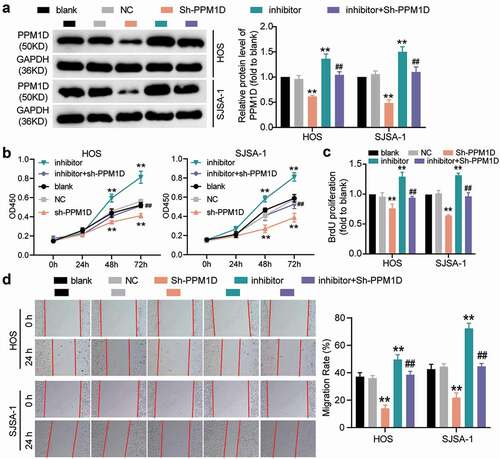
Figure 9. The negative effect of PPM1D on osteosarcoma cell apoptosis is negatively regulated by miR-15b-5p. (a) Caspase-3 activity assay was used to detect cell apoptosis. Statistical data were obtained by normalizing the original OD value in each group to its corresponding value in the blank group. (b) Western blot assay was used to measure the relative protein level of proapoptotic proteins (Cleaved-caspase-3 and Bax) and antiapoptotic protein (Bcl-2) in HOS and SJSA-1 cells. GAPDH served as a control. The relative level of target proteins was calculated by normalizing their relative density to GAPDH in each group to their corresponding value in the blank group. (a-b) HOS and SJSA-1 cells were transfected with PPM1D shRNA, miR-15b-5p inhibitor, PPM1D shRNA plus miR-15b-5p inhibitor, or negative control. Blank: blank control; NC: shRNA negative control together with miRNA inhibitor negative control; sh-PPM1D: PPM1D shRNA; inhibitor: miR-15b-5p inhibitor. Data are represented as the mean ± SD. All cellular experiments were performed in triplicates. ** P < 0.001 compared with blank control group. ## P < 0.001 compared with inhibitor group.
Discussion
In this study, we first observed that TRPM2-AS and PPM1D were upregulated in OS tissues and cell lines, while miR-15b-5p exhibited the opposite trend. We also found that TRPM2-AS promoted the viability, proliferation, and migration abilities of OS cells, while it suppressed the apoptosis of OS cells. Furthermore, we demonstrated that TRPM2-AS promoted OS progression by sponging and inhibiting miR-15b-5p, which negatively regulated the expression of the oncogene PPM1D.
The tumorigenic effect of TRPM2-AS has been illustrated in several cancer types, including prostate carcinoma [Citation26], gastric carcinoma [Citation19], and breast carcinoma [Citation6]. In line with these findings, in this study, we found that TRPM2-AS overexpression in OS tissues and cells has a positive impact on OS development. Previous studies have documented that miRNAs can regulate the expression of target genes by binding to their 3′-UTR and that lncRNAs can bind to miRNAs through sponge adsorption, thus reducing their ability to interfere with the mRNA protein-encoding process [Citation27]. This mode of regulation has also been shown to be involved in the pathogenesis of numerous cancer types. For example, lnc-SNHG1 promotes OS progression via miR-577 and WNT2B [Citation28]. In addition, MALAT1 was demonstrated to accelerate OS development by sponging miR‑34a to increase CCND1 expression [Citation29]. In the present study, we discovered that TRPM2-AS remarkably promoted cell viability, proliferation, and migration while inhibiting the apoptosis of OS cells, and this effect was mainly achieved by sponging miR-15b-5p. This finding, together with many other studies involving the role of TRPM2-AS in cancer [Citation7,Citation30,Citation31], sheds light on the oncogenic role of TRPM2-AS in multiple cancers and its potential to serve as a biomarker for cancer diagnosis.
Increasing amount of research suggests that by targeting protein-coding genes, miRNAs can function as oncogenes and/or tumor suppressors in various cancer types. For instance, miR-532-3p was found to promote HCC progression by targeting PTPRT [Citation32]. In another study, this miRNA was found to inhibit cell growth and metastasis in colorectal adenoma by regulating ETS1/TGM2 axis-mediated Wnt/β-catenin signaling [Citation33]. In addition, miR-590-3p promoted ovarian cancer by influencing the FOXA2-versican pathway [Citation34], whereas it suppressed breast cancer progression by targeting and activating transcription factor 3 [Citation35]. Similarly, miR-15b-5p plays a dual role in different types of carcinomas. A study reported that miR-15b-5p facilitated breast cancer by targeting HPSE2 [Citation36]. Meanwhile, miR-15b-5p was discovered to promote the proliferation and invasion of liver cancer cells by targeting and downregulating Axin2 [Citation11]. However, in another study, miR-15b-5p functioned as a tumor suppressor in colorectal cancer cells by regulating the NF-κB/XIAP axis [Citation37]. Moreover, miR‑15b‑5p was reported to exert tumor repressive function by targeting GDI2 in the pathogenesis of thyroid carcinoma [Citation38]. These dual effects could be attributed to the fact that miRNAs could be regulated by different upstream factors as well as regulate different downstream genes. In this study, we revealed that miR-15b-5p was downregulated in OS and presented a strong tumor-suppressive effect. Mechanistically, it was found that miR-15b-5p could be regulated by the lncRNA TRPM2-AS to influence PPM1D expression, thus exerting its function in the pathogenesis of OS. Although the dual function of miR-15b-5p in cancer development has been widely observed, our observations highlighted its tumor-suppressive role in OS progression. Nevertheless, whether miR-15b-5p could regulate or be regulated by other tumor-related factors to exert different functions in OS development remains to be further explored.
PPM1D plays an essential role in cell stress, DNA damage repair, and tumor metabolism. In the literature, PPM1D was identified as an oncogene that could regulate a variety of cancers, including glioma [Citation39], lung cancer [Citation22], and ovarian cancer [Citation40]. The effect of PPM1D on OS cell lines has been explored, and it was found that PPM1D was the target of miR-590 and that it promoted OS cell viability and suppressed OS cell apoptosis [Citation18]. Similarly, in this study, we demonstrated that PPM1D could promote the cell viability, proliferation, and migration of OS cells while hindering their apoptosis, which further confirmed its oncogenic function. Moreover, we identified a new miRNA, miR-15b-5p, that could directly target PPM1D to limit its oncogenic function in OS progression. These findings underline the significance of the regulatory network between miRNAs and protein-coding genes in the pathogenesis of OS.
However, this study has several limitations. One limitation was that this experiment was performed in vitro, indicating that the results of in vivo experiments are needed to confirm the effects of the TRPM2-AS/miR-15b-5p/PPM1D axis observed on OS cells. Another limitation was that this study did not investigate the interaction between PPM1D and P53. This limitation should be considered in future research as PPM1D could be involved in the P53 signaling pathway [Citation17].
Conclusion
Our research showed that TRPM2-AS and PPM1D expression levels were enhanced, while miR-15b-5p expression was reduced, in OS tissues and cell lines. Our experimental results further revealed that TRPM2-AS reduced OS cell apoptosis but increased OS cell viability, proliferation, and migration by sponging miR-15b-5p to enhance PPM1D. Overall, this study suggests that the TRPM2-AS/miR-15b-5p/PPM1D axis could regulate OS progression, which may provide new insights into the mechanism and pathogenesis of OS.
Supplemental Material
Download Zip (225.6 KB)Disclosure statement
No potential conflict of interest was reported by the author(s).
Data availability statement
By intersecting the predicted target miRNAs of TRPM2-AS and the differentially expressed miRNAs of GSE65071 data series (adjusted P<0.05, log FC<-1), three miRNAs were identified. By intersecting the predicted target mRNAs of miR-15b-5p by TargetScan Human 7.2 database and the differentially expressed mRNAs of GSE11416 data series (adjusted P<0.05, log FC>1.5), 73 mRNAs were identified. We then uploaded the 73 mRNAs to WebGestalt (http://www.webgestalt.org/option.php) to enrich the terms that the 73 genes were involved. P53 signaling pathway was found to be the most significantly enriched term, and CCND2, CCNE1, CDK1, CDK6 and PPM1D out of the 73 genes were on this pathway
Supplementary material
Supplemental data for this article can be accessed here.
Additional information
Funding
References
- Isakoff MS, Bielack SS, Meltzer P, et al. Osteosarcoma: current treatment and a collaborative pathway to success. J Clin Oncol. 2015;33(27):3029–3035.
- Wilusz JE, Sunwoo H, Spector DL. Long noncoding RNAs: functional surprises from the RNA world. Genes Dev. 2009;23(13):1494–1504.
- Ponting CP, Oliver PL, Reik W. Evolution and functions of long noncoding RNAs. Cell. 2009;136(4):629–641.
- Huarte M. The emerging role of lncRNAs in cancer. Nat Med. 2015;21(11):1253–1261.
- Orfanelli U, Jachetti E, Chiacchiera F, et al. Antisense transcription at the TRPM2 locus as a novel prognostic marker and therapeutic target in prostate cancer. Oncogene. 2015;34(16):2094–2102.
- Sun T, Song Y, Yu H, et al. Identification of lncRNA TRPM2-AS/miR-140-3p/PYCR1 axis’s proliferates and anti-apoptotic effect on breast cancer using co-expression network analysis. Cancer Biol Ther. 2019;20(6):760–773.
- Xiao J, Lin L, Luo D, et al. Long noncoding RNA TRPM2-AS acts as a microRNA sponge of miR-612 to promote gastric cancer progression and radioresistance. Oncogenesis. 2020;9(3):29.
- Sun G, Yan S, Shi L, et al. Decreased expression of miR-15b in human gliomas is associated with poor prognosis. Cancer Biother Radiopharm. 2015;30(4):169–173.
- Sun L, Yao Y, Liu B, et al. MiR-200b and miR-15b regulate chemotherapy-induced epithelial-mesenchymal transition in human tongue cancer cells by targeting BMI1. Oncogene. 2012;31(4):432–445.
- MacLean JA 2nd, King ML, Okuda H, et al. WNT7A regulation by miR-15b in ovarian cancer. PLoS One. 2016;11(5):e0156109.
- Dong Y, Zhang N, Zhao S, et al. miR-221-3p and miR-15b-5p promote cell proliferation and invasion by targeting Axin2 in liver cancer. Oncol Lett. 2019;18(6):6491–6500.
- Arakawa F, Kimura Y, Yoshida N, et al. Identification of miR-15b as a transformation-related factor in mantle cell lymphoma. Int J Oncol. 2016;48(2):485–492.
- Zhao C, Li Y, Chen G, et al. Overexpression of miR-15b-5p promotes gastric cancer metastasis by regulating PAQR3. Oncol Rep. 2017;38(1):352–358.
- Lambros MB, Natrajan R, Geyer FC, et al. PPM1D gene amplification and overexpression in breast cancer: a qRT-PCR and chromogenic in situ hybridization study. Mod Pathol. 2010;23(10):1334–1345.
- Li K, Liu Y, Xu S, et al. PPM1D functions as oncogene and is associated with poor prognosis in esophageal squamous cell carcinoma. Pathol Oncol Res. 2020;26(1):387–395.
- Yang S, Dong S, Qu X, et al. Clinical significance of Wip1 overexpression and its association with the p38MAPK/p53/p16 pathway in NSCLC. Mol Med Rep. 2017;15(2):719–723.
- Bulavin DV, Demidov ON, Saito S, et al. Amplification of PPM1D in human tumors abrogates p53 tumor-suppressor activity. Nat Genet. 2002;31(2):210–215.
- Long X, Lin XJ. P65-mediated miR-590 inhibition modulates the chemoresistance of osteosarcoma to doxorubicin through targeting wild-type p53-induced phosphatase 1. J Cell Biochem. 2019;120(4):5652–5665.
- Huang B, Chang C, Wang BL, et al. ELK1-induced upregulation of lncRNA TRPM2-AS promotes tumor progression in gastric cancer by regulating miR-195/ HMGA1 axis. J Cell Biochem. 2019;120(10):16921–16933.
- Huang C, Qin Y, Liu H, et al. Downregulation of a novel long noncoding RNA TRPM2-AS promotes apoptosis in non-small cell lung cancer. Tumour Biol. 2017;39(2):1010428317691191.
- Weng Y, Shen Y, He Y, et al. The miR-15b-5p/PDK4 axis regulates osteosarcoma proliferation through modulation of the Warburg effect. Biochem Biophys Res Commun. 2018;503(4):2749–2757.
- Zhang C, Chen Y, Wang M, et al. PPM1D silencing by RNA interference inhibits the proliferation of lung cancer cells. World J Surg Oncol. 2014;12(1):258.
- Wu B, Guo BM, Kang J, et al. PPM1D exerts its oncogenic properties in human pancreatic cancer through multiple mechanisms. Apoptosis. 2016;21(3):365–378.
- Peng TS, He YH, Nie T, et al. PPM1D is a prognostic marker and therapeutic target in colorectal cancer. Exp Ther Med. 2014;8(2):430–434.
- Liu J, Huang L, Su P, et al. MicroRNA-499a-5p inhibits osteosarcoma cell proliferation and differentiation by targeting protein phosphatase 1D through protein kinase B/glycogen synthase kinase 3beta signaling. Oncol Lett. 2018;15(4):4113–4120.
- Lavorgna G, Chiacchiera F, Briganti A, et al. Expression-profiling of apoptosis induced by ablation of the long ncRNA TRPM2-AS in prostate cancer cell. Genom Data. 2015;3:4–5.
- Beermann J, Piccoli MT, Viereck J, et al. Non-coding RNAs in development and disease: background, mechanisms, and therapeutic approaches. Physiol Rev. 2016;96(4):1297–1325.
- Jiang Z, Jiang C, Fang J. Up-regulated lnc-SNHG1 contributes to osteosarcoma progression through sequestration of miR-577 and activation of WNT2B/Wnt/beta-catenin pathway. Biochem Biophys Res Commun. 2018;495(1):238–245.
- Duan G, Zhang C, Xu C, et al. Knockdown of MALAT1 inhibits osteosarcoma progression via regulating the miR34a/cyclin D1 axis. Int J Oncol. 2019;54(1):17–28.
- Wang N, Wang L, Pan X. Long non-coding RNA TRPM2-AS promotes cell migration and invasion by serving as a ceRNA of miR-138 and inducing SOX4-mediated EMT in laryngeal squamous cell carcinoma. Cancer Manag Res. 2020;12:7805–7812.
- Pan L, Li Y, Jin L, et al. TRPM2-AS promotes cancer cell proliferation through control of TAF15. Int J Biochem Cell Biol. 2020;120:105683.
- Wang Y, Yang Z, Wang L, et al. miR-532-3p promotes hepatocellular carcinoma progression by targeting PTPRT. Biomed Pharmacother. 2019;109:991–999.
- Wang Y, Hu Y, Guo J, et al. miR-148a-3p suppresses the proliferation and invasion of esophageal cancer by targeting DNMT1. Genet Test Mol Biomarkers. 2019;23(2):98–104.
- Salem M, O’Brien JA, Bernaudo S, et al. miR-590-3p promotes ovarian cancer growth and metastasis via a novel FOXA2-versican pathway. Cancer Res. 2018;78(15):4175–4190.
- Rohini M, Gokulnath M, Miranda PJ, et al. miR-590-3p inhibits proliferation and promotes apoptosis by targeting activating transcription factor 3 in human breast cancer cells. Biochimie. 2018;154:10–18.
- Wu B, Liu G, Jin Y, et al. miR-15b-5p promotes growth and metastasis in breast cancer by targeting HPSE2. Front Oncol. 2020;10:108.
- Sun LN, Zhi Z, Chen LY, et al. SIRT1 suppresses colorectal cancer metastasis by transcriptional repression of miR-15b-5p. Cancer Lett. 2017;409:104–115.
- Zou J, Qian J, Fu H, et al. MicroRNA‑15b‑5p exerts its tumor repressive role via targeting GDI2: a novel insight into the pathogenesis of thyroid carcinoma. Mol Med Rep. 2020;22(4):2723–2732.
- Fons NR, Sundaram RK, Breuer GA, et al. PPM1D mutations silence NAPRT gene expression and confer NAMPT inhibitor sensitivity in glioma. Nat Commun. 2019;10(1):3790.
- Tedaldi G, Tebaldi M, Zampiga V, et al. Multiple-gene panel analysis in a case series of 255 women with hereditary breast and ovarian cancer. Oncotarget. 2017;8(29):47064–47075.