
ABSTRACT
Long non-coding RNA long intergenic non-protein coding RNA 01315 (LncRNA LINC01315) has been found to be implicated in various cancers, but its role and functions in colorectal cancer (CRC) remain to be addressed. Data on LINC01315 expression in CRC were gathered using bioinformatics analysis, and cancer stem cells (CSCs) were sorted by aldehyde dehydrogenase (ALDH) assay and flow cytometry. Migration, invasion, and stemness of CSCs isolated from CRC cells after transfection were determined by scratch, Transwell, and sphere-formation assays, respectively. Tumor xenograft model was constructed. Target genes and potential-binding sites were predicted using online databases and further confirmed via dual-luciferase reporter assay. Relative factors expressions were determined via quantitative real-time polymerase-chain reaction and Western blot as needed. LINC01315 was high-expressed in CRC and ALDH+ cells. LINC01315 silencing suppressed the migration, invasion, and sphere formation of CRC cells and tumor growth, and downregulated expressions of CSC molecules (ALDH, cluster of difference 44 (CD44), Prominin, and sex determining region Y-box 2 (SOX2)), Zinc Finger E-Box Binding Homeobox 1 (ZEB1) and Vimentin but upregulated E-Cadherin expression. MiR-484 could competitively bind with LINC01315, and LINC01315 silencing promoted miR-484 expression. The level of Delta Like Non-Canonical Notch Ligand 1 (DLK1), the target gene of miR-484, was enhanced by overexpressed LINC01315 yet was suppressed by LINC01315 silencing. Also, DLK1 silencing reversed the effects of downregulated miR-484 on migration, invasion, sphere formation, and CSC molecules expressions in CRC cells. LINC01315 silencing modulated CSC properties and epithelial-to-mesenchymal transition via miR-484/DLK1 axis.
Introduction
Nowadays, colorectal cancer (CRC) has been identified as the most prevalent and malignant human tumor worldwide, whose development and progression involve a series of genetic and epigenetic changes [Citation1,Citation2]. With the improvement of people’s living standards and the changes in their dietary structures, the incidence of CRC has gradually increased, which has aroused wide concern [Citation3]. Despite great efforts and progress in the treatment of CRC, the related mortality still remains high [Citation4]. At present, chemotherapy has been adopted for the treatment of patients with CRC by virtue of its capabilities to suppress migration and promote apoptosis in CRC cells, thereby reducing the risk of recurrence [Citation5]. However, many patients may still end up suffering from therapy-associated toxicities and cancer progression while bearing a huge financial burden of novel medications, which makes it imperative to work out an alternative therapy that consistently controls or stabilizes tumor progression without reducing patients’ quality of life [Citation6]. Cancer stem cells (CSCs), a small subpopulation of cells possessing the characteristics of embryonic stem cells (ESCs) and undergoing uncontrolled replication and differentiation, are involved in tumorigenesis as well as in the development of CRC. Thus, in-depth studies on the role of CSCs in CRC may be conducive to optimizing the methods for early detection and treatment of CRC [Citation7].
Long non-coding RNAs (LncRNAs), which have a length of over 200 nucleotides, are a class of RNA molecules with few or no protein-translation capability, whose implication in CRC growth and metastasis has been reported in recent discoveries [Citation8,Citation9]. It has been unveiled that lncRNA colorectal neoplasia differentially expressed (CRNDE) has promotive effects on CRC cell proliferation and chemoresistance [Citation10]. Also, silenced lncRNA metastasis-associated lung adenocarcinoma transcript 1 (MALAT1) suppresses viability and metastasis, induces G1 phase resistance and facilitates apoptosis in CRC cells [Citation11]. In addition, lncRNA SATB2 Antisense RNA 1 (SATB2-AS1) not only inhibits tumor metastasis but also impacts the microenvironment of tumor immune cells in CRC via regulation of Special AT-rich binding protein 2 (SATB2) [Citation12]. Furthermore, long intergenic non-protein coding RNA 01315 (LINC01315) is proved to function as a competing endogenous RNA in triple-negative breast cancer [Citation13]. Nevertheless, the detailed role and functions of lncRNA LINC01315 in CRC awaited further elucidation.
Apart from lncRNAs, microRNAs (miRNAs, miRs), another family of small non-coding RNA molecules that participate in cellular processes and exert oncogenic or tumor-inhibitory effects, are involved in CRC as well [Citation14]. MiRNAs have been documented to have the capability to bind to the complementary-binding sites in the 3’-untranslated region (3’-UTR) of their target transcripts and subsequently cause an inhibitory effect on target gene expression via translation repression or transcript degradation [Citation15]. Downregulations of both miR-148a and miR-625-3p have been suggested to have a relation with tumor budding in CRC [Citation16]. MiR-144 produced inhibitory effects on CRC cell proliferation and migration via targeting G1 To S Phase Transition 1 (GSPT1) [Citation17]. In addition, miR-4319 acted as an inhibitor in CRC progression, which exerted effects via targeting Ankyrin Repeat and BTB Domain Containing 1 (ABTB1) [Citation18]. However, the implication of LINC01315 in stem cells of CRC and the interaction between miRNAs and LINC01315 in CRC remained to be further groped and discussed.
In this study, we mainly aimed to discover the biological roles and functions of LINC01315 in CRC cells in detail, with a view to providing new directions for further clinical treatment of CRC.
Materials and methods
Ethical statement
All animal experiments were performed in Southeast University following the guidelines of China Council on Animal Care and Use. Our current study has been approved by the Ethics Committee of Experimental Animals of Southeast University (serial number: 20,200,422,026). Every effort was made for minimization of pain and discomfort to the animals.
Bioinformatics analysis
Data about LINC01315 expression in colon adenocarcinoma (COAD) were obtained from gene expression profiling interactive analysis 2 (GEPIA 2) (http://gepia.cancer-pku.cn/). For prediction of target genes and potential-binding sites, several databases such as LncBase V2 (http://carolina.imis.athena-innovation.gr/diana_tools/web/index.php), lncRNASNP2 (http://bioinfo.life.hust.edu.cn/lncRNASNP) and The Cancer Genome Atlas-Colon Adenocarcinoma (TCGA-COAD, https://portal.gdc.cancer.gov/projects/TCGA-COAD) were firstly employed to single out candidate miRNAs that could competitively bind with LINC01315. 107 miRNAs were predicted from LncBase, 64 miRNAs were identified from lncRNA SNP2 and 481 miRNAs were sorted from TCGA-COAD, with the results finally summarized using Venn diagram as described previously [Citation19]. The diagram suggested that three miRNAs could competitively bind with LINC01315, namely miR-378a-5p, miR-2110, and miR-484, of which miR-484 was used for subsequent studies as it was found to be evidently regulated by LINC01315 in our study.
Delta Like Non-Canonical Notch Ligand 1 (DLK1) has been unveiled to be associated with CSCs and cancer cell stemness [Citation20,Citation21]. Then, target genes and potential-binding sites of LINC01315 and miR-484 were predicted using lncRNASNP2, and those of miR-484 and DLK1 were predicted by TargetScan V7.2 (http://www.targetscan.org/vert_72/). All the predicted results were then confirmed by dual-luciferase reporter assay.
Cell culture
Human colorectal cancer cell lines LS174T (catalog no. CL-188), HCT116 (catalog no. CCL-247), SW480 (catalog no. CCL-228) and SW-620 (catalog no. CCL-227) as well as normal colorectal epithelial cell line FHC (catalog no. CRL-1831) were purchased from the American Type Culture Collection (ATCC, Manassas, VA, USA). All CRC cells were cultured in RPMI-1640 medium (21,870–076, Gibco, Waltham, MA, USA) with 10% fetal bovine serum (FBS, 16,140–071, Gibco, USA) and 1% Penicillin–Streptomycin (15,070–063, Gibco, USA), and FHC cells were cultured in Dulbecco’s modified eagle’s medium-F12 (DMEM-F12) (12,500–062, Gibco, USA) containing 10% FBS, 25 mM 4-(2-hydroxyethyl)-1-piperazineethanesulfonic acid (HEPES, 15,630–106, Gibco, USA), 10 ng/mL cholera toxin (C8052, Sigma-Aldrich, St Louis, MO, USA), 5 μg/mL insulin (I6634, Sigma-Aldrich, USA), 5 μg/mL transferrin (T8158, Sigma-Aldrich, USA) and 100 ng/mL hydrocortisone (H0888, Sigma-Aldrich, USA). All cells were incubated at 37°C with 5% CO2.
CSC isolation
CSCs were isolated via sorting aldehyde dehydrogenase-positive (ALDH+) CRC cells using ALDEFLUOR assay kit (01700, StemCell Technologies, Cambridge, MA, USA) in accordance with a prior publication [Citation22]. In brief, 4 × 10⁵ SW480 and HCT116 cells were resuspended in ALDEFLUOR™ assay buffer (#01701, StemCell Technologies, USA), and incubated with 1.5 μM ALDH substrate BODIPY-aminoacetaldehyde (BAAA, HY-136594, MedChemExpress, Monmouth Junction, NJ, USA). One of the cell mixture aliquots was transferred to a tube which contained ALDH inhibitor diethylamino benzaldehyde (DEAB, D86256, Sigma-Aldrich, USA) and then the samples were incubated at 37°C for 30 minutes. Finally, cells were washed using 2 mL of ALDEFLUOR™ assay buffer, resuspended in 500 μL of ALDEFLUOR™ assay buffer containing 4’, 6-Diamidino-2-phenylindole dihydrochloride (DAPI, D9542, Sigma-Aldrich, USA), and analyzed by fluorescence-activated cell sorting (FACS) in a FacsCalibur™ flow cytometer (BD Biosciences, Franklin Lakes, NJ, USA).
Transfection
Short hairpin RNA targeting LINC01315 (shLINC01315-1 and shLINC01315-2) and the vector were synthesized by GenePharma (Shanghai, China). And miR-484 inhibitor (I) and inhibitor control (IC) were also obtained from GenePharma. LINC01315 was overexpressed using pcDNA3.1 plasmid (V790-20, Invitrogen, Carlsbad, CA, USA). Small interfering targeting DLK1 (siDLK1, SR305789) and its negative control (siNC, SR30002) were purchased from Origene (Rockville, MD, USA).
For transfection, cancer stem cells (CSCs) isolated from both SW480 and HCT116 cells were cultured in 6-well plates at a density of 1 × 10⁶ cells/well until 90% confluence was reached. Then transfection was performed using Lipofectamine 2000 transfection reagent (11,668–019, Invitrogen, USA) at 37°C following the protocols provided by the manufacturer. Cells were harvested 48 hours after transfection. Sequences were given in Supplementary Table 1.
Scratch assay
After transfection, CSCs isolated from SW480 and HCT116 cells were cultured in 6-well plates at a density of 1 × 10⁵ cells/well to reach approximately 80% confluence, and then a scratch was made using a sterile pipette tip. Cells were further cultured in a non-serum medium at 37°C with 5% CO2. Images of cells at 0 and 24 hours were taken under an inverted optical microscope (DP27, Olympus, Tokyo, Japan) at 100 × magnification.
Transwell assay
For Transwell assay, Transwell chambers with 8-μm pores were firstly pre-coated with 50 μL of Matrigel (M8370, Solarbio, Beijing, China) and then put on 24-well plates. After transfection, CSCs isolated from SW480 and HCT116 cells at a density of 1 × 10⁵ cells/well were transferred to the upper Transwell chamber containing 200 μL of serum-free medium at 37°C with 5% CO2, while 500 μL of medium containing 10% FBS and 1% Penicillin-Streptomycin was added into the lower chamber. Forty-eight hours later, the lower Transwell chamber was washed using phosphate buffered saline (PBS, P5493, Sigma-Aldrich, USA), fixed in 4% paraformaldehyde solution (P6148, Sigma-Aldrich, USA) for 30 minutes, and finally stained using 0.1% Giemsa (GS500, Sigma-Aldrich, USA) for 20 minutes. Cells were counted in five randomly chosen fields under an inverted optical microscope and photographed at 250 × magnification.
Sphere-formation assay
Sphere-formation assay was conducted as previously described [Citation23]. Specifically, after transfection, CSCs isolated from SW480 and HCT116 cells were cultured in 6-well plates containing non-serum RPMI-1640 medium with epidermal growth factor (EGF, E9644, Sigma-Aldrich, USA), fibroblast growth factor (FGF, F3133, Sigma-Aldrich, USA), insulin (I6634, Sigma-Aldrich, USA) and Penicillin-Streptomycin. The medium was replaced every three days. On day 10 after incubation, spheroids clones were fixed, stained using crystal violet, and ultimately counted under an inverted optical microscope at 100 × magnification.
Animal xenograft model
Animal xenograft model was established as per a previous publication [Citation23]. Four- to six-week-old female BALB/C nude mice (18–22 g, n = 30, SYXK (Jiangsu) 2016–0014) were obtained from Jiangsu GemPharmatech Co. Ltd. (Nanjing, China, http://www.lascn.com/) and kept in individual cages without specific pathogens under the conditions: 12-hour day/night cycle, 21–23°C, and 50–60% humidity. All mice were given free access to a standard experimental diet and sterile tap water throughout the experiment.
Then, all mice were randomly assigned to vector group, sh-LINC01315-1 group and sh-LINC01315-2 group (n = 10 for each group), and treated as follows: mice in vector group were subcutaneously injected with 5 × 10⁶ CSCs isolated from HCT116 cells, which had been transfected with vector on the same side of the posterior flank; mice in the sh-LINC01315-1 and sh-LINC01315-2 groups received subcutaneous administration of 5 × 10⁶ CSCs isolated from HCT116 cells which had been transfected with sh-LINC01315-1 and sh-LINC01315-2 on the same side of the posterior flank, respectively. Tumor size was calculated on day(s) 0, 4, 7, 11, 14, 17, 20, 24, 28, and 35 post injection by the formula: Tumor volume (mm3) = (D × d2 [])/2 (D: longitudinal diameter; d: transverse diameter). All mice were executed on day 35 via inhalation of 4% isoflurane (#792,632, Sigma-Aldrich, USA), and tumors were extracted and weighed.
Dual-luciferase reporter assay
Sequences of LINC01315 and DLK1, which contained binding sites of miR-484 were bought from GenePharma and inserted into luciferase vector pMirGLO (E1330, Promega, Madison, WI, USA) for formation of reporter plasmids wild-type LINC01315 and DLK1 (LINC01315-WT and DLK1-WT), respectively. 3’-UTR mutagenesis was achieved using a site-directed mutagenesis kit (F541, Thermo Fisher Scientific, USA) for construction of reporter plasmids mutated LINC01315 and DLK1 (LINC01315-MUT and DLK1-MUT).
CSCs isolated from HCT116 and SW480 cells were cultured in 96-well plates at a density of 5 × 10³ cells/well and were transfected with miR-484 I or IC (200 ng for each) and reporter plasmids (50 ng for each) using Lipofectamine 2000 reagent at room temperature. Cells were subsequently subjected to luciferase activity detection within dual-luciferase reporter system (E1910, Promega, USA) 48 hours after transfection. Firefly luciferase activity was normalized to Renilla luciferase activity. Sequences used were listed below: LINC01315-WT: 5’-ACTCGCAGCTGTTGAGCCTGT-3’, LINC01315-MUT: 5’-ACTCGCCGCTGTTAAGGUTGT-3’, DLK1-WT: CGUGAGACCUGGACUGAGCCUGC-3’, and DLK1-MUT: 5’-CGUGAGACCUGGACUGCUCAUGC-3’.
RNA isolation and quantitative real-time polymerase chain reaction (qRT-PCR)
Based on the manufacturers’ instructions, Trizol (15,596–018, Invitrogen, USA) reagent was employed for total RNA extraction from CRC tumor and CRC cells, and miRNA extraction kit (K1456, BioVision, Milpitas, CA, USA) was used to extract miRNA from the cells. The extracted RNA was preserved at −80°C, and its concentration was quantified with a NanoDrop Lite spectrophotometer (ND-LITE, Thermo Fisher Scientific, Waltham, MA, USA). Then, cDNA synthesis was performed with a First Strand cDNA Synthesis Kit (K1651, Thermo Fisher Scientific, USA). qRT-PCR was conducted using SYBR PremixEx Taq II kit (RR820L, TaKaRa, Japan) in Touch real-time PCR Detection system (CFX96, Bio-Rad, Hercules, CA, USA) under the following conditions: 94°C for 10 minutes, and 40 cycles of 94°C for 15 seconds and 60°C for 1 minute. Relative expressions were calculated using the 2−ΔΔCT method, with GAPDH and U6 serving as internal references [Citation24]. Primer sequences were listed in Supplementary Table 2.
Western blot
Protein expressions were determined by Western blot based on previous description [Citation25]. Protein extraction was performed after the collected cells were lysed by radio immunoprecipitation assay (RIPA) lysis buffer (P0013 C, Beyotime, Shanghai, China), and the concentration of the extracted protein was determined with a bicinchoninic acid (BCA) protein kit (P0012S, Beyotime, China). 20 μg of protein lysates were electrophoresed with sodium dodecyl sulfate-polyacrylamide gel electrophoresis (SDS-PAGE; P0012A, Beyotime, China), and transferred into the polyvinylidene fluoride (PVDF) membrane (FFP32, Beyotime, China). The membrane was blocked by skimmed milk (5%) for 2 hours and incubated with the following primary antibodies at 4°C overnight: anti-DLK1 antibody (ab119930, 1:1000, Abcam, Cambridge, UK), anti-Zinc Finger E-Box Binding Homeobox 1 (ZEB1) antibody (ab155249, 1:2000, Abcam, UK), anti-E-Cadherin antibody (ab40772, 1:20,000, Abcam, UK), anti-Vimentin antibody (ab20346, 1:1000, Abcam, UK), anti-cellular-Myc (c-Myc) antibody (ab32072, 1:1000, Abcam, UK), anti-octamer-binding transcription factor 4 (Oct4) antibody (ab181557, 1:1000, Abcam, UK), anti-Nanog antibody (ab203919, 1:1000, Abcam, UK), and anti-GAPDH antibody (ab181602, 1:2000, Abcam, UK). GAPDH was employed as an internal reference, followed by the incubation with secondary horseradish peroxidase (HRP)-conjugated antibodies: goat anti-rabbit IgG H&L (A0208, 1:2000, Beyotime, China) and goat anti-mouse IgG H&L (A0216, 1:2000, Beyotime, China) at room temperature for 1 hour. Then, the membrane was washed using tris-buffer saline tween (TBST, T9039, Sigma-Aldrich, USA) for three times. The protein bands were collected and visualized using an Enhanced chemiluminescence (ECL) kit (P0018S, Beyotime, China). Data were analyzed with iBright CL750 Imaging System (A44116, Thermo Fisher Scientific, USA) and gray values were calculated using ImageJ 5.0 (National Institute of Health, Bethesda, MD, USA).
Statistical analysis
Every experiment was performed more than three times independently. Data were expressed as mean ± standard deviation (SD) and analyzed using GraphPad 8.0 software (La Jolla, CA, USA). Statistical significance was analyzed by one-way analysis of variance (ANOVA) followed by Tukey post hoc test and paired t test. P < 0.05 was deemed as statistically significant.
Results
LINC01315 was high-expressed in CRC tissues and ALDH+ CRC cells
To confirm the possible role of LINC01315 in CRC, we firstly retrieved data on LINC01315 expression in cancer tissues and adjacent normal tissues from TCGA-COAD, which suggested that LINC01315 was higher-expressed in cancer tissues as compared to that in normal tissues (). Meanwhile, as depicted in , LINC01315 expression was higher in CRC cells than in the normal colorectal epithelial cell line, with the highest and second highest levels being observed in HCT116 and SW480 cells, respectively (, p < 0.001). Therefore, HCT116 and SW480 cells were chosen for subsequent studies.
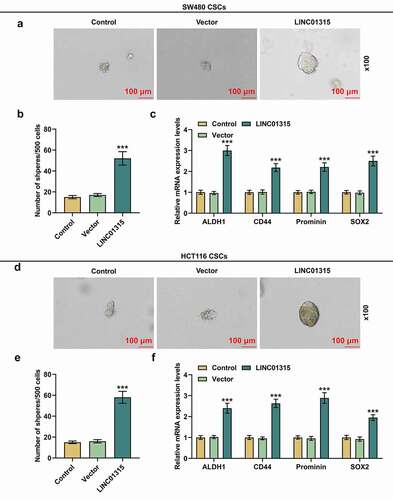
Figure 1. LINC01315 was high-expressed in CRC tissues and ALDH+ CRC cells. (a) Results from TCGA-COAD suggested an upregulation of LINC01315 in CRC. (b) LINC01315 expression in CRC cells was also upregulated, with the highest and second highest levels being observed in HCT116 and SW480 cells respectively. (c-f) Expressions of both LINC01315 and CSC molecules (ALDH, CD44, Prominin, and SOX2) were increased in ALDH+ SW480 and HCT116 cells, as detected by qRT-PCR. GAPDH was used as an internal control. All experiments were independently performed in triplicate and data were expressed as mean ± standard deviation (SD). +++P < 0.001, vs. FHC; ΔΔΔP<0.001, vs. ALDH−. CRC: colorectal cancer; LINC01315: Long Intergenic Non-Protein Coding RNA 01315; TCGA-COAD: The Cancer Genome Atlas-Colon Adenocarcinoma; ALDH+: Aldehyde Dehydrogenase-positive; ALDH−: Aldehyde Dehydrogenase-negative; CD44: cluster of difference 44; SOX2: sex determining region Y-box 2.
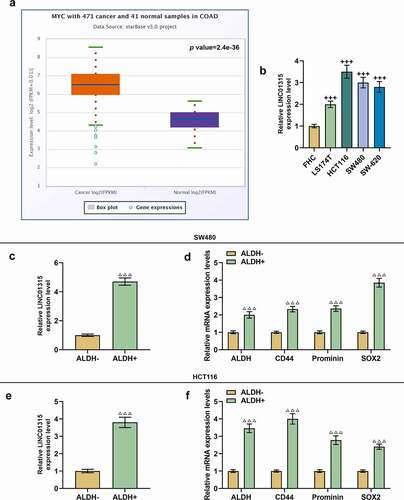
Furthermore, ALDH, cluster of difference 44 (CD44), Prominin and sex determining region Y-box 2 (SOX2) were identified as CSC markers [Citation26–28]. We measured the expressions of LINC01315 and those CSC markers after sorting CSCs from SW480 and HCT116 cells, revealing that all of these genes’ expressions were upregulated in CSCs isolated from SW480 and HCT116 cells (, p < 0.001), and thus the sorted CSCs were selected for subsequent studies.
LINC01315 silencing suppressed LINC01315 expression, migration and invasion in CSCs isolated from both SW480 and HCT116 cells
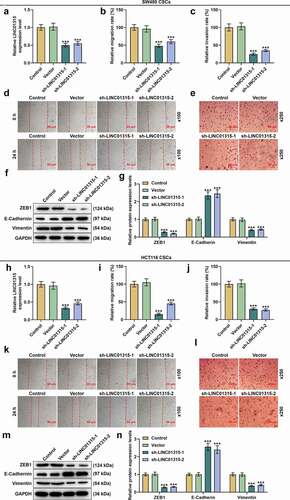
We transfected shRNA targeting LINC01315 into CSCs isolated from SW480 and HCT116 cells to uncover the effect of LINC01315 on CSCs from CRC cells, discovering that LINC01315 silencing resulted in decreased LINC01315 expression and migration and invasion rates (, p < 0.001). To further verify the underlying mechanisms, we measured the expressions of ZEB1, E-Cadherin, and Vimentin, which were known as epithelial-mesenchymal-transition (EMT)-related markers [Citation29]. It was observed that ZEB1 and Vimentin expressions were downregulated yet E-Cadherin expression was upregulated following LINC01315 silencing in CSCs isolated from SW480 cells (, p < 0.001). Identical results were also obtained in CSCs isolated from HCT116 cells (, p < 0.001). These results validated that LINC01315 silencing suppressed LINC01315 expression, migration, and invasion in CSCs isolated from SW480 and HCT116 cells.
Figure 2. LINC01315 silencing suppressed LINC01315 expression, migration and invasion in CSCs isolated from both SW480 and HCT116 cells. (a-n) Results from qRT-PCR, scratch assay, Transwell assay and Western blot showed that LINC01315 silencing downregulated LINC01315, ZEB1 and Vimentin expression and decreased the migration and invasion rates, while promoted the expression of E-cadherin of CSCs isolated from SW480 cells. Identical results were also found in CSCs isolated from HCT116 cells. GAPDH was used as an internal control for qRT-PCR and Western blot. Magnification: 100 × for scratch assay, 250 × for Transwell assay. All experiments were independently performed in triplicate and data were expressed as mean ± standard deviation (SD). ***P < 0.001, vs. Vector. CSC: cancer stem cell; qRT-PCR: quantitative real-time polymerase chain reaction; shLINC01315: short hairpin RNA targeting LINC01315.
LINC01315 silencing inhibited sphere formation and downregulated the expressions of molecules in CSCs isolated from SW480 and HCT116 cells
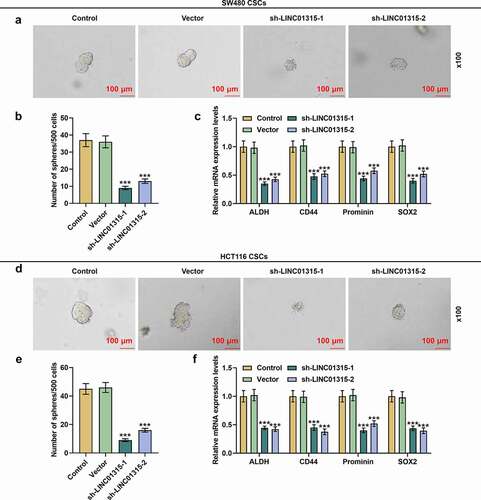
Sphere formation assay was performed to determine the effect of LINC01315 silencing on CSCs isolated from SW480 and HCT116 cells. Following LINC01315 silencing in CSCs isolated from SW480 cells, a reduction in the number of formed spheres was noticed (, p < 0.001). We also used qRT-PCR to determine the effect of LINC01315 silencing on the expressions of CSC molecules and found that LINC01315 silencing caused a decline in their expressions (, p < 0.001). Meanwhile, the same results were also achieved in CSCs isolated from HCT116 cells (, p < 0.001). It could be concluded that LINC01315 silencing could suppress sphere formation and downregulate CSC molecule levels in CSCs isolated from both SW480 and HCT116 cells.
Figure 3. LINC01315 silencing inhibited sphere formation and downregulated molecules expressions in CSCs isolated from both SW480 and HCT116 cells. (a-c) As demonstrated by sphere formation assay (a-b) and qRT-PCR (c), LINC01315 silencing reduced sphere formation and downregulated molecules expressions in CSCs isolated from SW480 cells. The same results were also obtained in CSCs isolated from HCT116 cells (d-f). GAPDH was used as an internal control for qRT-PCR. All experiments were independently performed in triplicate and data were expressed as mean ± standard deviation (SD). ***P < 0.001, vs. Vector.
LINC01315 overexpression promoted LINC01315 expression, migration, invasion, sphere formation and the expressions of molecules in CSCs isolated from both SW480 and HCT116 cells
In addition, the effect of LINC01315 overexpression on CRC was also detected. As shown in , LINC01315 overexpression increased the expression of LINC01315, ZEB1, and Vimentin, and also promoted the migration and invasion rates, but inhibited the expression of E-Cadherin in CSCs isolated from SW480 cells (P < 0.001). Identical results were also obtained in CSCs isolated from HCT116 cells (, p < 0.001). Moreover, after LINC01315 overexpression in CSCs isolated from SW480 cells, the number of formed spheres was increased (, p < 0.001). We also used qRT-PCR to determine the effect of LINC01315 overexpression on the expressions of CSC molecules and found that LINC01315 overexpression promoted the expression of ALDH1, CD44, Prominin, and SOX2 (, p < 0.001). Meanwhile, the same results were also achieved in CSCs isolated from HCT116 cells (, p < 0.001).
Figure 4. LINC01315 overexpression promoted LINC01315 expression, migration and invasion in CSCs isolated from both SW480 and HCT116 cells. (a-n) Results from qRT-PCR, scratch assay, Transwell assay and Western blot showed that LINC01315 overexpression increased LINC01315, ZEB1 and Vimentin expression and promoted the migration and invasion rates, while inhibited the expression of E-cadherin of CSCs isolated from SW480 cells. Identical results were also found in CSCs isolated from HCT116 cells. GAPDH was used as an internal control for qRT-PCR and Western blot. Magnification: 100 × for scratch assay, 250 × for Transwell assay. All experiments were independently performed in triplicate and data were expressed as mean ± standard deviation (SD). ***P < 0.001, vs. Vector. CSC: cancer stem cell; qRT-PCR: quantitative real-time polymerase chain reaction.
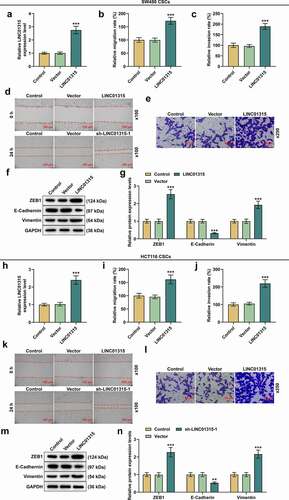
Figure 5. LINC01315 overexpression promoted sphere formation and promoted molecules expressions in CSCs isolated from both SW480 and HCT116 cells. (a-c) As demonstrated by sphere formation assay (a-b) and qRT-PCR (c), LINC01315 overexpression promoted sphere formation and upregulated molecules expressions in CSCs isolated from SW480 cells. The same results were also obtained in CSCs isolated from HCT116 cells (d-f). GAPDH was used as an internal control for qRT-PCR. All experiments were independently performed in triplicate and data were expressed as mean ± standard deviation (SD). ***P < 0.001, vs. Vector.
LINC01315 silencing retarded tumorigenesis and suppressed LINC01315 expression in vivo
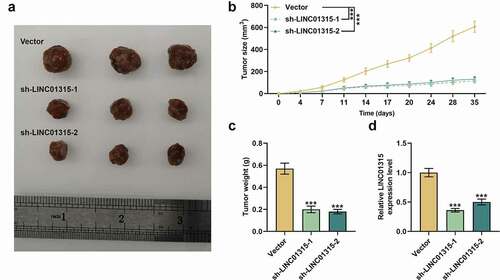
To further gauge the effect of LINC01315 silencing on CRC in vivo, animal xenograft model was constructed, and besides, tumor volume and weight of the model mice were measured after mice were injected with CSCs which were isolated from HCT116 cells and transfected with sh-LINC01315 plasmids and vector. LINC01315 silencing was confirmed to cause a slowdown in tumor volume increase and a decreased tumor weight (, p < 0.001). Then, we measured LINC01315 expression and found that LINC01315 silencing also dwindled LINC01315 expression in vivo (, p < 0.001). To conclude, LINC01315 silencing could retard tumorigenesis and suppress LINC01315 expression in vivo.
Figure 6. LINC01315 silencing retarded tumorigenesis and suppressed LINC01315 expression in vivo. (a-d) Animal xenograft model was constructed following injection of sh-LINC01315-transfected HCT116 cells. LINC01315 silencing reduced tumor size (b) and tumor weight (c), and downregulated LINC01315 expression (d). GAPDH was used as an internal control. All experiments were independently performed in triplicate and data were expressed as mean ± standard deviation (SD). ***P < 0.001, vs. Vector.
MiR-484 could competitively bind with LINC01315
In order to further confirm the detailed mechanisms, we firstly searched several databases, as shown in . LncBase and lncRNASNP2 predicted 107 and 64 potential downstream miRNAs, respectively. Meanwhile, 481 miRNAs were sorted from the data from TCGA-COAD to have differential expressions. From all the collected data, we finally screened out three potential downstream miRNAs that could possibly competitively bind with LINC01315 via Venn diagram analysis (), namely miR-378a-5p, miR-2110, and miR-484. Then, we measured their expressions in CSCs isolated from both SW480 and HCT116 cells following silencing of LINC01315, and unraveled that only miR-484 expression was upregulated (, p < 0.001). Therefore, miR-484 was selected for subsequent studies.
Figure 7. MiR-484 could competitively bind with LINC01315. (a) Online databases including LncRNASNP2 (http://bioinfo.life.hust.edu.cn/lncRNASNP), LncBase (http://carolina.imis.athena-innovation.gr/diana_tools/web/index.php) and TCGA-COAD (https://portal.gdc.cancer.gov/projects/TCGA-COAD) were used to predict the downstream miRNAs of LINC01315, and three miRNAs (miR-378a-5p, miR-2110 and miR-484) were predicted as the possible miRNAs which could competitively bind with LINC01315. (b-c) Results from qRT-PCR suggested that only miR-484 expression was upregulated following LINC01315 silencing in CSCs isolated from CRC cells. U6 was employed as an internal control. (d-f) Conserved binding sites between LINC01315 and miR-484 were predicted by LncRNASNP2 (d), and dual-luciferase reporter assay (e-f) was used to confirm the results. All experiments were independently performed in triplicate and data were expressed as mean ± standard deviation (SD). ***P < 0.001, vs. Vector; ^^^P < 0.001, vs. IC. miR: microRNA; WT: wild-type; MUT: mutated; IC: inhibitor control; I: inhibitor.
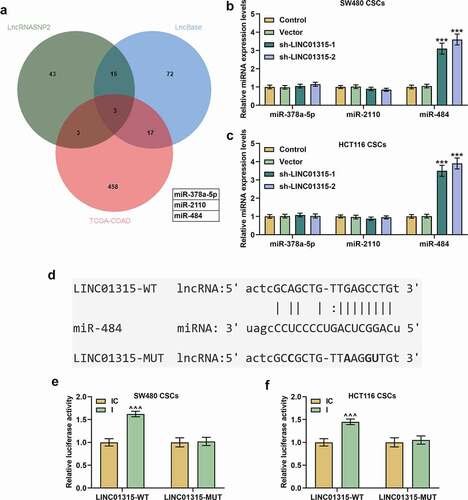
With the help of lncRNASNP2, we predicted miR-484 as the candidate miRNA, which could competitively bind with LINC01315, and their conserved binding sites were presented in . Then, dual-luciferase reporter assay adopted to confirm the above prediction revealed that compared with the LINC01315-WT+IC group, the luciferase activity in the LINC01315-WT+I group was enhanced (, p < 0.001), while there was no significant difference regarding luciferase activity between the LINC01315-MUT+I group and the LINC01315-MUT+IC group, manifesting the competitive binding relationship of miR-484 with LINC01315.
LINC01315 silencing regulated miR-484 expression in CSCs isolated from SW480 and HCT116 cells
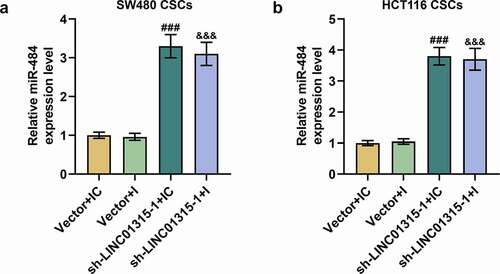
To discover the interaction between miR-484 and LINC01315 in CSCs isolated from both SW480 and HCT116 cells, miR-484 I and sh-LINC01315 were transfected into the cells. It was discovered that downregulated miR-484 generated no effect on miR-484 expression, whereas LINC01315 silencing promoted miR-484 expression (, p < 0.001). These findings denoted that LINC01315 silencing can modulate miR-484 expression (, p < 0.001).
Figure 8. LINC01315 silencing had a regulatory effect on miR-484 expression in CSCs isolated from both SW480 and HCT116 cells. (a-b) To discover the interaction between miR-484 and LINC01315 in CSCs isolated from both SW480 and HCT116 cells, miR-484 I and sh-LINC01315 were transfected into the cells. Downregulated miR-484 had no effect on miR-484 expression, whereas LINC01315 silencing promoted miR-484 expression.U6 was used as an internal control. All experiments were independently performed in triplicate and data were expressed as mean ± standard deviation (SD). ###P < 0.001, vs. Vector+IC; &&&P < 0.001, vs. Vector+I.
DLK1 was the target gene of miR-484
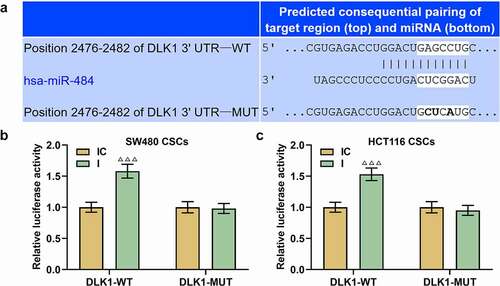
Meanwhile, to further delve into the mechanisms, TargetScan was used to predict the target gene of miR-484, and DLK1 was successfully singled out. The predicted binding sites were provided in . As depicted in , the luciferase activity in the DLK1-WT+I group was boosted as compared to that in the DLK1-WT+IC group (, p < 0.001). However, no significant changes were found concerning luciferase activity between the DLK1-MUT+IC and DLK1-MUT+I groups. These verdicts implied that DLK1 was the target gene of miR-484.
Figure 9. DLK1 was the target gene of miR-484. (a-c) To further delve into the mechanisms, TargetScan was used to predict the target gene of miR-484, and we successfully predicted DLK1 as the target gene (a), which was confirmed by dual-luciferase reporter assay (b-c). All experiments were independently performed in triplicate and data were expressed as mean ± standard deviation (SD). ΔΔΔP<0.001, vs. IC. DLK1: Delta Like Non-Canonical Notch Ligand 1.
Overexpressed LINC01315 promoted DLK1 expression in CSCs isolated from SW480 and HCT116 cells, whereas LINC01315 silencing did the opposite
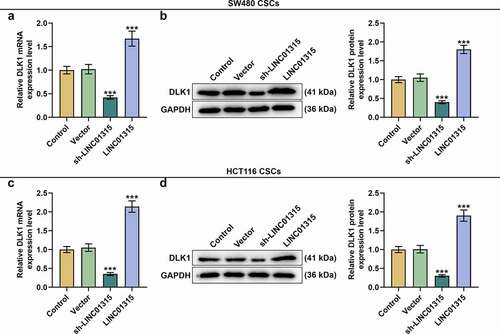
We subsequently transfected LINC01315 overexpression plasmid and sh-LINC01315 into CSCs isolated from SW480 and HCT116 cells to find out the effect of LINC01315 on DLK1 expression, affirming that overexpressed LINC01315 augmented DLK1 expression, whereas LINC01315 silencing suppressed DLK1 expression (, p < 0.001).
Figure 10. Overexpressed LINC01315 promoted DLK1 expression, whereas LINC01315 silencing did the opposite. (a-d) We subsequently transfected LINC01315 overexpression plasmid and sh-LINC01315 into CSCs isolated from SW480 and HCT116 cells to discover the effect of LINC01315 on DLK1 expressions. As suggested by the results of qRT-PCR and Western blot, overexpressed LINC01315 promoted DLK1 expression, whereas LINC01315 silencing suppressed DLK1 expression. GAPDH was used as an internal control. All experiments were independently performed in triplicate and data were expressed as mean ± standard deviation (SD). ***P < 0.001, vs. Vector.
DLK1 silencing reversed the effect of downregulated miR-484 on DLK1 expression in CSCs isolated from SW480 and HCT116 cells
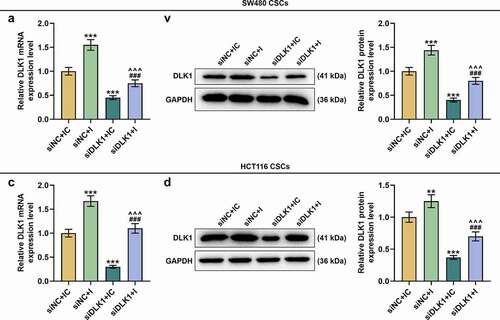
With the hope to further uncover the interaction between miR-484 and DLK1, miR-484 I and siDLK1 were transfected into CSCs isolated from SW480 and HCT116 cells and DLK1 expression was measured. To sum up, downregulated miR-484 resulted in the upregulation of DLK1, whereas DLK1 silencing brought about downregulated DLK1 (, p < 0.01) and reversed the effect of downregulated miR-484 (, p < 0.001).
Figure 11. DLK1 silencing reversed the effect of downregulated miR-484 on DLK1 expression. (a-d) DLK1 expression was measured following siDLK1 and miR-484 I transfection. As suggested by the results of qRT-PCR and Western blot, downregulated miR-484 led to upregulated DLK1 expression, whereas DLK1 silencing caused the contrary results. Furthermore, DLK1 silencing reversed the effects of downregulated miR-484. GAPDH was used as an internal control. All experiments were independently performed in triplicate and data were expressed as mean ± standard deviation (SD). **P < 0.01, ***P < 0.001, vs. siNC+IC; ^^^P < 0.001, vs. siNC+I; ###P < 0.001, vs. siDLK1+ IC. NC: negative control; siDLK1: small interfering RNA targeting DLK1.
DLK1 silencing overturned the effects of downregulated miR-484 on the migration and invasion of CSCs isolated from SW480 and HCT116 cells
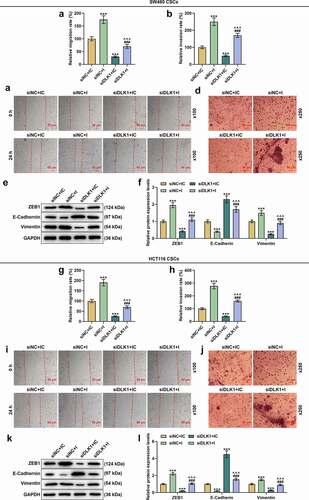
The effects of DLK1 silencing and downregulated miR-484 on migration and invasion were determined by scratch assay and Transwell assay, respectively. In CSCs isolated from SW480 cells, downregulated miR-484 elevated both the migration and invasion rates, while DLK1 silencing caused opposite trends (, p < 0.001). We also measured the expressions of EMT-related markers in this phase, and found that both ZEB1 and Vimentin expressions were upregulated yet E-Cadherin expression was downregulated following the downregulation of miR-484, whereas DLK1 silencing was related to the downregulations of ZEB1 and Vimentin and the upregulation of E-Cadherin (, p < 0.001) and reversed the effects of downregulated miR-484 (, p < 0.001). The same results also appeared in CSCs isolated from HCT116 cells (, p < 0.001). Taken together, the above findings demonstrated that DLK1 silencing overturned the effects of downregulated miR-484 on the migration and invasion of CSCs isolated from SW480 and HCT116 cells.
Figure 12. DLK1 silencing reversed the effects of downregulated miR-484 on the migration and invasion of CSCs isolated from SW480 and HCT116 cells. (a-l) Results from scratch assay, Transwell assay and Western blot suggested that after downregulating miR-484, both the migration and invasion rates of CSCs isolated from SW480 cells were increased, while DLK1 silencing caused decreased migration and invasion rates. We also measured the expressions of EMT-related markers in this phase, and found that both ZEB1 and Vimentin expressions were increased yet E-Cadherin expression was decreased following miR-484 downregulation, whereas DLK1 silencing was related to decreased ZEB1 and Vimentin expressions and increased E-Cadherin expression. It was additionally discovered that DLK1 silencing reversed the effect of downregulated miR-484. GAPDH was used as an internal control. All experiments were independently performed in triplicate and data were expressed as mean ± standard deviation (SD). Magnification: 100 × for scratch assay, 250 × for Transwell assay. ***P < 0.001, vs. siNC+IC; ^^^P < 0.001, vs. siNC+I; ###P < 0.001, vs. siDLK1+ IC.
DLK1 silencing counteracted the effects of downregulated miR-484 on sphere formation and expressions of molecules in CSCs isolated from SW480 and HCT116 cells
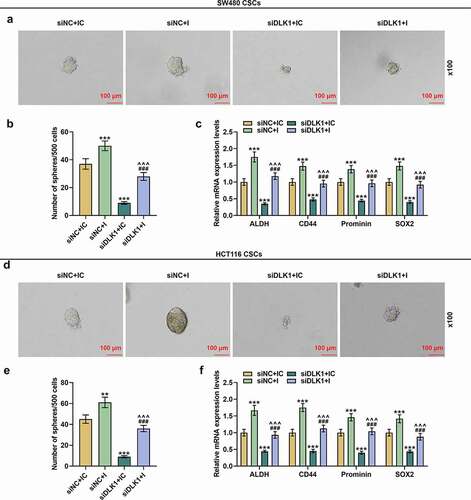
The effects of downregulated miR-484 and DLK1 silencing on sphere formation and expressions of molecules in CSCs isolated from SW480 and HCT116 cells were detected as well. The results suggested that downregulated miR-484 enhanced sphere formation and upregulated molecules expressions in CSCs isolated from SW480 cells, whereas DLK1 silencing led to the opposite results (, p < 0.001) and offset the above effects of downregulated miR-484 (, p < 0.001). Similar results were also found in CSCs isolated from HCT116 cells (, p < 0.001). All these results indicated that DLK1 silencing reversed the effects of downregulated miR-484 on sphere formation and molecules expressions in CSCs isolated from SW480 and HCT116 cells.
Figure 13. DLK1 silencing reversed the effects of downregulated miR-484 on sphere formation and molecules expressions in CSCs isolated from SW480 and HCT116 cells. (a-f) The effects of downregulated miR-484 and DLK1 silencing on sphere formation and expressions of molecules in CSCs isolated from SW480 and HCT116 cells were detected as well, and the results suggested that downregulated miR-484 increased sphere formation and upregulated the expressions of molecules in CSCs isolated from SW480 cells, whereas DLK1 silencing caused the opposite results and reversed the effects of downregulated miR-484. Similar results were also found in CSCs isolated from HCT116 cells. GAPDH was used as an internal control. All experiments were independently performed in triplicate and data were expressed as mean ± standard deviation (SD). ***P < 0.001, vs. siNC+IC; ^^^P < 0.001, vs. siNC+I; ###P < 0.001, vs. siDLK1+ IC.
DLK1 silencing abrogated the effects of downregulated miR-484 on expressions of Wnt/β-catenin pathway-related genes in CSCs isolated from SW480 and HCT116 cells
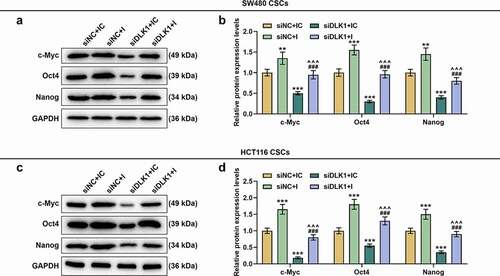
We measured the levels of c-Myc, Oct4 and Nanog, which were known as Wnt/β-catenin pathway-related genes, [Citation30,Citation31] in CSCs isolated from both SW480 and HCT116 cells. As shown in , the levels of c-Myc, Oct4 and Nanog were upregulated following miR-484 downregulation, which was reversed by DLK1 silencing (, p < 0.001) that downregulated those levels (, p < 0.01).
Figure 14. DLK1 silencing reversed the effects of downregulated miR-484 on expressions of Wnt/β-catenin pathway-related genes in CSCs isolated from SW480 and HCT116 cells. (a-d) Levels of c-Myc, Oct4 and Nanog, known as Wnt/β-catenin pathway-related genes, were measured by Western blot, which turned out to be upregulated following miR-484 downregulation yet downregulated following DLK1 silencing. In addition, DLK1 silencing reversed the effects of downregulated miR-484. All experiments were independently performed in triplicate and data were expressed as mean ± standard deviation (SD). **P < 0.01, ***P < 0.001, vs. siNC+IC; ^^^P < 0.001, vs. siNC+I; ###P < 0.001, vs. siDLK1+ IC. c-Myc: cellular-Myc; Oct4: octamer-binding transcription factor 4.
Discussion
Nowadays, CRC remains a worldwide health concern, making it imperative to develop more efficacious therapies for CRC prevention and treatment [Citation32]. Recent studies have unveiled the biological roles of lncRNAs in CRC, including the diagnostic/prognostic value of LINC01315 in triple-negative breast cancer [Citation10–13]. Nevertheless, the role and mechanisms of LINC01315 in CRC remain inadequately understood. In our study, LINC01315 was high-expressed in CRC, and LINC01315 silencing suppressed the migration, invasion and sphere formation of CSCs isolated from CRC cells in vitro and retarded tumorigenesis in vivo possibly via miR-484/DLK1 axis. To our best knowledge, this was the first time that LINC01315 was demonstrated to be implicated in CRC.
Accumulating evidence has pointed out the existence of a subpopulation of cells with stem cells properties in a majority of malignancies, which are known as CSCs [Citation33]. Identification and isolation of CSCs are essential for better understanding their roles in the tumorigenesis process and for developing CSC-specific therapies [Citation34]. Isolated from a variety of primary tumors and established cell lines, CSCs are a small subpopulation of tumor cells that exhibit similarities to both embryonic and normal adult stem cells and play pivotal roles in tumorigenesis, metastasis and recurrence, which therefore are seen as the roots of cancer [Citation35]. Mounting evidence puts forward the existence of a CSC population in human CRC, but there are different hypotheses about the origin of CSC [Citation36]. CSC may derive from transformation of quiescent, normal long-term stem cells or could result from the de-differentiation of more mature cells [Citation37]. In CRC, the first hypothesis is supported by the observation that normal and cancer stem cells share similar properties and surface markers [Citation34]. However, it cannot be excluded that CSC might originate from cells that, at some specific stages of differentiation, undergo malignant transformation acquiring new properties including stem-like features. This conjecture might explain the different aggressiveness of tumors, which is possibly related to the different differentiation degrees of cells undergoing the transformation event(s) as evidenced by the different tumor grading [Citation37]. Proliferation, which occupies a pivotal position in cancer progression, is manifested by alterations in the expressions and/or activities of cell cycle-associated proteins, and activation of multiple constitutive signal transduction pathways has been found to stimulate tumor cell growth [Citation38]. Metastasis, a process involving malignant cell migration and invasion, is indicative of an advanced stage of malignancy and emerges as the leading factor for cancer-related mortality [Citation39].
In addition, cells which form spheres in primary tumors can also exhibit stem-like properties and express CSC markers [Citation40]. Several proteins have been unveiled to be markers of CSC, including CD133, CD44, CD29, EpCAM, CD24 and LGR5 [Citation41–45]. ALDH, an enzyme with detoxification effect, is responsible for retinol oxidation to retinol acid and is vital to early stem cell differentiation [Citation43]. CD44 is not only a compelling CSC marker of multiple solid malignancies but also a hyaluronan (HA)-binding glycoprotein, which makes profound impacts upon the initiation and metastasis of tumors [Citation44,Citation46]. Prominins, pentaspan glycoproteins with transmembrane properties, are also considered to be markers for stem cells [Citation45]. SOX2, known as an undifferentiated cell marker, is involved in CSC maintenance in several cancers, including CRC [Citation47]. In the meantime, it is hypothesized that tumor cells that undergo the process of epithelial-to-mesenchymal transition (EMT) are capable of acquiring some CSC-associated properties, such as self-renewal, and chemo- and radio-resistance, which points out the relation between EMT and CSC [Citation48]. Some proteins are also suggested to exert peculiar functions in the process of EMT [Citation49–51]. ZEB1, a prime element of a transcription factor network which controls EMT, is an essential molecule in regulating DNA damage, differentiation of cancer cells, and metastasis [Citation49]. E-Cadherin belongs to the Cadherin family and its loss is instrumental in the onset of both metastasis and EMT [Citation50]. Vimentin is one of the cyto-skeletal proteins closely implicated in cancer metastasis and is overexpressed in EMT-type cells [Citation51]. In our current study, we corroborated that after silencing LINC01315, the migration, invasion, and sphere formation of CRC cells were all inhibited, E-Cadherin expression was upregulated, and the expressions of ZEB1, Vimentin, ALDH, CD44, Prominin, and SOX2 were dropped, which connoted that LINC01315 silencing produced modulating effects on both CSC properties and EMT in CSCs isolated from CRC cells. Nevertheless, the detailed molecular mechanisms were yet to be illustrated.
Increasing evidence has also documented that lncRNAs can exert “sponge”-like functions on miRNAs so as to promote or suppress tumor development and progression [Citation52]. Nevertheless, the interaction between miR-484 and LINC01315 in CRC awaited further illustration. In our current study, after sorting the candidate miRNAs using LncRNASNP2, LncBase, and TCGA-COAD, we for the first time recommended miR-484 as the miRNA that could competitively bind with LINC01315, and downregulated miR-484 reversed the promotive effect of LINC01315 silencing on miR-484 expression in CSCs isolated from CRC cells. However, the mechanisms required to be explored in future studies.
DLK1, also termed as preadipocyte factor-1 (Pref-1), is a protein involved in CRC with transmembrane properties [Citation53,Citation54]. It has additionally been evidenced that DLK1 can target miRNAs and control Wnt pathway [Citation55]. Wnt/β-catenin signaling pathway is a canonical Wnt signaling pathway and has regulatory effects on several biological processes, including the proliferation, migration, invasion, and apoptosis of cancer cells [Citation56]. Aberrant activation of Wnt/β-catenin signaling pathway has been detected in several diseases, in particular cancers [Citation57]. Some genes, such as c-Myc, Oct4, and Nanog, have been reported to be associated with Wnt/β-catenin pathway [Citation30,Citation31]. C-Myc is both a proto-oncogene and a downstream target gene of Wnt/β-catenin signaling pathway, and its activation can drive CRC growth [Citation58]. Upregulation of Oct4 and Nanog, another two downstream targets of Wnt/β-catenin signaling pathway, can promote activation of Wnt/β-catenin signaling pathway [Citation31,Citation59]. In our study, after downregulation of miR-484, cell migration, invasion, and sphere formation were all promoted, the levels of ZEB1, Vimentin, c-Myc, Oct4, and Nanog were all upregulated, and E-Cadherin expression was downregulated, whereas DLK1 silencing exerted the opposite impacts and overturned the effects of downregulated miR-484, mirroring that downregulated miR-484 modulated cell properties and activated Wnt/β-catenin signaling pathway in CSCs isolated from CRC cells possibly via targeting DLK1.
However, some supplementary procedures should perform in our current study. For one thing, we only centered on the effects of LINC01315 on tumorigenesis in vivo in a single cell line, but the effects were not validated in other cell lines. For another, the effects of LINC01315 on Wnt/β-catenin signaling pathway in CSCs isolated from CRC cells needed to be illustrated in detail. Thus, future researches are urgently required.
In conclusion, we found that LINC01315 was high-expressed in CRC, and LINC01315 silencing modulated CSC properties and EMT of CRC cells in vitro and retarded tumorigenesis in vivo possibly via miR-484/DLK1 axis. It is hoped that our current study can help bring further insights into the roles and interactions of lncRNAs and miRNAs in the pathogenesis of CRC and develop potential clinical therapeutic methods for CRC in the future.
Authors’ contributions
Substantial contributions to conception and design: Youran Li, Wei Wang
Data acquisition, data analysis and interpretation: Minna Wu, Ping Zhu, Zailong Zhou, Yuxia Gong, Yunfei Gu
Drafting the article or critically revising it for important intellectual content: Youran Li, Wei Wang
Final approval of the version to be published: Youran Li, Wei Wang, Minna Wu, Ping Zhu, Zailong Zhou, Yuxia Gong, Yunfei Gu
Agreement to be accountable for all aspects of the work in ensuring that questions related to the accuracy or integrity of the work are appropriately investigated and resolved: Youran Li, Wei Wang, Minna Wu, Ping Zhu, Zailong Zhou, Yuxia Gong, Yunfei Gu
Availability of data and materials
The analyzed data sets generated during the study are available from the corresponding author on reasonable request.
Supplemental Material
Download Zip (35.2 KB)Acknowledgments
Not applicable
Disclosure statement
No potential conflict of interest was reported by the author(s).
Supplementary material
Supplemental data for this article can be accessed here
Additional information
Funding
References
- Dekker E, Tanis PJ, Vleugels JLA, et al. Colorectal cancer. Lancet. 2019;394(10207):1467–1480.
- Bian Z, Zhang J, Li M, et al. LncRNA-FEZF1-AS1 promotes tumor proliferation and metastasis in colorectal cancer by regulating PKM2 signaling. Clin Cancer Res off J Am Assoc Cancer Res. 2018;24(19):4808–4819.
- Dai G, Ding K, Cao Q, et al. Emodin suppresses growth and invasion of colorectal cancer cells by inhibiting VEGFR2. Eur J Pharmacol. 2019;859:172525.
- Rawla P, Sunkara T, Barsouk A. Epidemiology of colorectal cancer: incidence, mortality, survival, and risk factors. Prz Gastroenterol. 2019;14(2):89–103.
- Miller KD, Siegel RL, Lin CC, et al. Cancer treatment and survivorship statistics, 2016. CA Cancer J Clin. 2016;66(4):271–289.
- Woo IS, Jung YH. Metronomic chemotherapy in metastatic colorectal cancer. Cancer Lett. 2017;400:319–324.
- Munro MJ, Wickremesekera SK, Peng L, et al. Cancer stem cells in colorectal cancer: a review. J Clin Pathol. 2018;71(2):110–116.
- Renganathan A, Felley-Bosco E. Long noncoding RNAs in cancer and therapeutic potential. Adv Exp Med Biol. 2017;1008:199–222.
- Wang L, Cho KB, and Li Y, et al. Long noncoding RNA (lncRNA)-mediated competing endogenous RNA networks provide novel potential biomarkers and therapeutic targets for colorectal cancer. Int J Mol Sci. 2019;20:5758.
- Han P, Li JW, Zhang BM, et al. The lncRNA CRNDE promotes colorectal cancer cell proliferation and chemoresistance via miR-181a-5p-mediated regulation of Wnt/β-catenin signaling. Mol Cancer. 2017;16(1):9.
- Xu Y, Zhang X, Hu X, et al. The effects of lncRNA MALAT1 on proliferation, invasion and migration in colorectal cancer through regulating SOX9. Mol Med (Cambridge, MA). 2018;24(1):52.
- Xu M, Xu X, Pan B, et al. LncRNA SATB2-AS1 inhibits tumor metastasis and affects the tumor immune cell microenvironment in colorectal cancer by regulating SATB2. Mol Cancer. 2019;18(1):135.
- Naorem LD, Prakash VS, Muthaiyan M, et al. Comprehensive analysis of dysregulated lncRNAs and their competing endogenous RNA network in triple-negative breast cancer. Int J Biol Macromol. 2020;145:429–436.
- Balacescu O, Sur D, Cainap C, et al. The impact of miRNA in colorectal cancer progression and its liver metastases. Int J Mol Sci. 2018;19(12):3711.
- Lu TX, Rothenberg ME. MicroRNA. J Allergy Clin Immunol. 2018;141(4):1202–1207.
- Baltruskeviciene E, Schveigert D, Stankevicius V, et al. Down-regulation of miRNA-148a and miRNA-625-3p in colorectal cancer is associated with tumor budding. BMC Cancer. 2017;17(1):607.
- Xiao R, Li C, Chai B. miRNA-144 suppresses proliferation and migration of colorectal cancer cells through GSPT1. Biomed Pharmacothe. 2015;74:138–144.
- Li X, Guo S, Xiong X-K, et al. Combination of quercetin and cisplatin enhances apoptosis in OSCC cells by downregulating xIAP through the NF-kappa B pathway. J Cancer. 2019;10(19):4509–4521.
- Wang M, Zheng S, Li X, et al. Integrated analysis of lncRNA-miRNA-mRNA ceRNA network identified lncRNA EPB41L4A-AS1 as a potential biomarker in non-small cell lung cancer. Front Genet. 2020;11:511676.
- Min SJ, Lim JY, Kim HR, et al. Sasa quelpaertensis leaf extract inhibits colon cancer by regulating cancer cell stemness in vitro and in vivo. Int J Mol Sci. 2015;16(12):9976–9997.
- Grassi ES, Jeannot P, Pantazopoulou V, et al. Niche-derived soluble DLK1 promotes glioma growth. Neoplasia. 2020;22(12):689–701.
- Zhu Y, Wang C, Becker SA, et al. Camp ER. miR-145 antagonizes SNAI1-mediated stemness and radiation resistance in colorectal cancer. Mol Ther. 2018;26(3):744–754.
- Lu G, Li Y, Ma Y, et al. Long noncoding RNA LINC00511 contributes to breast cancer tumourigenesis and stemness by inducing the miR-185-3p/E2F1/Nanog axis. J Exp Clin Cancer Res. 2018;37(1):289.
- Livak KJ, Schmittgen TD. Analysis of relative gene expression data using real-time quantitative PCR and the 2(-Delta Delta C(T)) method. Methods (San Diego Calif). 2001;25:402–408.
- Fu Z, Chen C, Zhou Q, et al. LncRNA HOTTIP modulates cancer stem cell properties in human pancreatic cancer by regulating HOXA9. Cancer Lett. 2017;410:68–81.
- Dalerba P, Dylla SJ, Park IK, et al. Phenotypic characterization of human colorectal cancer stem cells. Proc Natl Acad Sci U S A. 2007;104(24):10158–10163.
- Yu SS, Cirillo N. The molecular markers of cancer stem cells in head and neck tumors. J Cell Physiol. 2020;235(1):65–73.
- Xia T, Jiang H, Li C, et al. Molecular imaging in tracking tumor stem-like cells. J Biomed Biotechnol. 2012;2012:420364.
- Hou L, Li Q, Yu Y, et al. SET8 induces epithelial‑mesenchymal transition and enhances prostate cancer cell metastasis by cooperating with ZEB1. Mol Med Rep. 2016;13(2):1681–1688.
- Jia XX, Zhu TT, Huang Y, et al. Wnt/β-catenin signaling pathway regulates asthma airway remodeling by influencing the expression of c-Myc and cyclin D1 via the p38 MAPK-dependent pathway. Exp Ther Med. 2019;18(5):3431–3438.
- Liu L, Zhu H, Liao Y, et al. Inhibition of Wnt/β-catenin pathway reverses multi-drug resistance and EMT in Oct4(+)/Nanog(+) NSCLC cells. Biomed Pharmacothe. 2020;127:110225.
- Katona BW, Weiss JM. Chemoprevention of Colorectal Cancer. Gastroenterology. 2020;158(2):368–388.
- Pan Y, Ma S, Cao K, et al. Therapeutic approaches targeting cancer stem cells. J Cancer Res Ther. 2018;14(7):1469–1475.
- Fanali C, Lucchetti D, Farina M, et al. Cancer stem cells in colorectal cancer from pathogenesis to therapy: controversies and perspectives. World J Gastroenterol. 2014;20(4):923–942.
- Shin KH, Kim RH. An updated review of oral cancer stem cells and their stemness regulation. Crit Rev Oncog. 2018;23(3–4):189–200.
- Ricci-Vitiani L, Lombardi DG, Pilozzi E, et al. Identification and expansion of human colon-cancer-initiating cells. Nature. 2007;445(7123):111–115.
- Gangemi R, Paleari L, Orengo AM, et al. Cancer stem cells: a new paradigm for understanding tumor growth and progression and drug resistance. Curr Med Chem. 2009;16(14):1688–1703.
- Feitelson MA, Arzumanyan A, Kulathinal RJ, et al. Sustained proliferation in cancer: mechanisms and novel therapeutic targets. Semin Cancer Biol. 2015;35(Suppl):S25–S54.
- Tahtamouni L, Ahram M, Koblinski J, et al. Molecular regulation of cancer cell migration, invasion, and metastasis. Anal Cell Pathol (Amst). 2019;2019:1356508.
- Cao L, Zhou Y, Zhai B, et al. Sphere-forming cell subpopulations with cancer stem cell properties in human hepatoma cell lines. BMC Gastroenterol. 2011;11(1):71.
- Fujimoto K, Beauchamp RD, Whitehead RH. Identification and isolation of candidate human colonic clonogenic cells based on cell surface integrin expression. Gastroenterology. 2002;123(6):1941–1948.
- Sagiv E, Memeo L, Karin A, et al. CD24 is a new oncogene, early at the multistep process of colorectal cancer carcinogenesis. Gastroenterology. 2006;131(2):630–639.
- Li W, Ma H, Zhang J, et al. Unraveling the roles of CD44/CD24 and ALDH1 as cancer stem cell markers in tumorigenesis and metastasis. Sci Rep. 2017;7(1):13856.
- Thapa R, Wilson GD. The importance of CD44 as a stem cell biomarker and therapeutic target in cancer. Stem Cells Int. 2016;2016:2087204.
- Di Bonito M, Collina F, Cantile M, et al. Aberrant expression of cancer stem cells marker prominin-1 in low-grade tubulolobular breast carcinoma: a correlative study between qRT-PCR, flow-cytometric and immunohistochemistry analysis [corrected]. J Breast Cancer. 2012;15(1):15–23.
- Sneath RJ, Mangham DC. The normal structure and function of CD44 and its role in neoplasia. Molecular Pathology: MP. 1998;51(4):191–200.
- Takeda K, Mizushima T, Yokoyama Y, et al. Sox2 is associated with cancer stem-like properties in colorectal cancer. Sci Rep. 2018;8(1):17639.
- Zhang P, Sun Y, Ma L. ZEB1: at the crossroads of epithelial-mesenchymal transition, metastasis and therapy resistance. Cell Cycle (Georgetown, Tex). 2015;14(4):481–487.
- Drápela S, Bouchal J, Jolly MK, et al. ZEB1: a critical regulator of cell plasticity, DNA damage response, and therapy resistance. Front Mol Biosci. 2020;7:36.
- Pal M, Bhattacharya S, Kalyan G, et al. Cadherin profiling for therapeutic interventions in Epithelial Mesenchymal Transition (EMT) and tumorigenesis. Exp Cell Res. 2018;368(2):137–146.
- Wei H, Yu Y, Wang Y, et al. Vimentin-targeting AIEgen-peptide conjugates: wash-free fluorescence detection of EMT-type cancer cells and tissues. Sens Actuators B Chem. 2020;321:128536.
- Liu J, Li H, Zheng B, et al. Competitive endogenous RNA (ceRNA) regulation network of lncRNA-miRNA-mRNA in colorectal carcinogenesis. Dig Dis Sci. 2019;64(7):1868–1877.
- Gomes LG, Cunha-Silva M, Crespo RP, et al. DLK1 is a novel link between reproduction and metabolism. J Clin Endocrinol Metab. 2019;104(6):2112–2120.
- Yanai H, Nakamura K, Hijioka S, et al. Dlk-1, a cell surface antigen on foetal hepatic stem/progenitor cells, is expressed in hepatocellular, colon, pancreas and breast carcinomas at a high frequency. J Biochem. 2010;148(1):85–92.
- Zhang RM, Tang T, Yu HM, et al. LncRNA DLX6-AS1/miR-129-5p/DLK1 axis aggravates stemness of osteosarcoma through Wnt signaling. Biochem Biophys Res Commun. 2018;507(1–4):260–266.
- Zhang Z, Wang X, Zhang L, et al. Wnt/beta-catenin signaling pathway in trophoblasts and abnormal activation in preeclampsia (Review). Mol Med Rep. 2017;16(2):1007–1013.
- Chinison J, Aguilar JS, Avalos A, et al. Triptonide Effectively Inhibits Wnt/beta-Catenin Signaling via C-terminal transactivation domain of beta-catenin. Sci Rep. 2016;6(1):32779.
- Wang Q, Zhou Y, Rychahou P, et al. Deptor is a novel target of Wnt/β-Catenin/c-Myc and contributes to colorectal cancer cell growth. Cancer Res. 2018;78(12):3163–3175.
- Yong X, Tang B, Xiao YF, et al. Helicobacter pylori upregulates Nanog and Oct4 via Wnt/β-catenin signaling pathway to promote cancer stem cell-like properties in human gastric cancer. Cancer Lett. 2016;374(2):292–303.