
ABSTRACT
Graves’ disease (GD) is a kind of autoimmune diseases. The development of GD is closely related to the imbalance of Th1/Th2 generated by the differentiation of CD4+ T cells. This study was sought to clarify the role of lncRNA RUNX1-IT1 and explore the mechanism of its function. The expressions of RUNX1-IT1 and Neural cell adhesion molecule (NrCAM) in the peripheral blood of GD patients were detected by qRT-PCR and Western blot. We performed RNA pull down, RIP, and ChIP experiments to verify the correlation between p53 and RUNX1-IT1, p53 and NrCAM. The levels of Th1 cells differentiation markers were detected by Flow cytometry assay and ELISA. The expressions of lncRNA RUNX1-IT1 and NrCAM were most significantly up-regulated in CD4+ T cells of GD patients, and NrCAM expression was significantly positively correlated with RUNX1-IT1 expression. Furthermore, p53 was a potential transcription factor of NrCAM, which could interact with NrCAM. NrCAM level was up-regulated after the overexpression of p53 in CD4+ T cells, while knockdown of RUNX1-IT1 reversed this effect. Down-regulation of NrCAM and RUNX1-IT1 could decrease the mRNA and protein levels of transcriptional regulator T-bet and CXC chemokine ligand 10 (CXCL10) in CD4+ T cells. Our results suggested that RUNX1-IT1 regulated the expressions of the important Th1 factor T-bet, CXCL10, and interferon γ (IFN-γ) by regulating NrCAM transcription, thus participating in the occurrence and development of specific autoimmune disease GD.
1 Introduction
Autoimmune thyroid disease (AITD) includes GD and Hashimoto’s thyroiditis (HT), among which Graves’ disease (GD) is a kind of autoimmune diseases that can affect thyroid function [Citation1]. The incidence of GD is about 0.5% in males and 3.0% in females, and other patients with autoimmune diseases such as rheumatoid arthritis (RA) also have a high incidence of this disease [Citation2]. GD can lead to the dysfunction of suppressor T cells (TS) and directed differentiation of helper T cells (TH), so that humoral immunity and cellular immunity interact, and stimulate B cells to produce thyroid-stimulating receptor antibodies, thus leading to hyperthyroidism [Citation3]. In recent years, there have been many studies on the mechanism of Th1 cells and Th2 cells in autoimmune diseases. Currently, it has been confirmed that GD is closely related to the imbalance of Th1/Th2 generated by the differentiation of CD4+ T cells [Citation4]. However, the bias of Th1/Th2 balance still remains controversial. Therefore, the role of Th1/Th2 equilibrium in GD needs to be further explored in the future.
LncRNAs are non-coding RNAs with over 200 nucleotides, and their biological functions are complex. In recent years, the effects of lncRNAs on cell differentiation have been preliminarily studied [Citation5]. LncRNAs have been found to play an important role in regulating the activation and differentiation of Th1 cells and Th2 cells [Citation6]. Under normal conditions, the immune function of Th1/Th2 cells is in dynamic balance. It is generally believed that Th1 type reaction can enhance the host’s immune defense against virus and intracellular pathogen infection, while Th2 type reaction is associated with the progression, persistence and chronic infection. Once this equilibrium state is broken, the body will be unable to maintain the normal immune function, and then a variety of related diseases will occur. Evidence shows that lncRNAs are involved in the pathogenesis of systemic lupus erythematosus (SLE), RA, Crohn’s disease (CD), multiple sclerosis, AITD and other autoimmune diseases [Citation7–9]. In addition, studies have shown that lncRNA MALAT1 can significantly influence the expressions of Th1/Th2-related cytokines by regulating the differentiation of CD4+ T cells [Citation10]. Clinical data showed that high thyrotropin receptor antibody (TRAb) concentration decreased by approximately 50% during treatment in 20 patients with GD, and lncRNA Heg was negatively correlated with GD marker TRAb [Citation11]. Even so, lncRNAs that related to the occurrence and development of GD have not been fully developed yet. AITD is an organ-specific autoimmune disease which involving the thyroid gland, while RA is an autoimmune disease involving the joints of the whole body. Current evidence suggests that human leukocyte antigen-DR (HLA-DR) plays an important role in RA, while AITD may be initially stimulated to produce interferon (IFN)-γ locally in the thyroid, which then stimulates the production of HLA-DR. This study also showed that the incidence of HT and GD in RA patients was 8.6% and 2.7%, respectively, indicating that RA and AITD had a common pathogenesis basis [Citation12]. Based on the similarities in immunogenetics and serology between RA and AITD, public RA chip dataset was selected for exploring GD-related lncRNAs in this study.
In clinical samples, we found that neural cell adhesion molecule (NrCAM) expression was significantly up-regulated in CD4+ T cells of GD patients. Based on the fact that NrCAM and TH cells both can participate in the development of axons [Citation13,Citation14], we hypothesized that NrCAM might be associated with TH cell differentiation. NrCAM belongs to the immunoglobulin superfamily, which participates in cell adhesion, and plays an important role in the nervous system [Citation14]. In recent years, studies have found that NrCAM expression significantly increases in papillary thyroid carcinoma (PTC), and then NrCAM binds to epidermal growth factor receptor (EGFR) and α4β1 integrin through extracellular folding, thereby activating MAPK/Erk and PI3K/Akt pathways, inhibiting cell apoptosis, and promoting proliferation, migration, and invasion of papillary thyroid cancer cells [Citation15,Citation16].
In this study, we intended to analyze the differentially expressed lncRNAs in GD patients through bioinformatics analysis. Furthermore, we investigated how lncRNAs affect the function of CD4+ T cells, thus providing a new research direction for the clinical treatment of GD.
2 Materials and methods
2.1 Healthy individuals and GD patients
The patients with GD (n = 30) in The First Affiliated Hospital of Zhengzhou University were selected as study subjects, who were not treated after initial diagnosis. The clinical diagnosis basis of GD is as follows: hypermetabolic syndrome, diffuse goiter, high-free triiodothyronine (FT3) and free thyroxine (FT4) levels, low sensitive thyroid stimulating hormone (TSH) level, and TRAb level. Healthy controls (n = 30) with standardized levels of smoking status, thyroid autoantibodies levels, and thyroid function were recruited from The First Affiliated Hospital of Zhengzhou University. The comparison of clinical characteristics between GD group and healthy control group is shown in . All patients had signed informed consent prior to the study. All procedures complied with the ethical standards of the institutional and national research committees and the Declaration of Helsinki. Protocols in the study were approved by the Medical Ethics Committee of The First Affiliated Hospital of Zhengzhou University. All participants provided written informed consent.
Table 1. Comparison of clinical characteristics between the GD and the healthy control (HC) groups
2.2 Isolation of peripheral blood mononuclear cells
Peripheral blood samples were taken from GD patients and healthy controls, followed by anticoagulation with heparin, and then diluted with phosphate buffer saline (PBS). The cell suspension was centrifuged at 2000 r/min for 20 min to collect peripheral blood mononuclear cells, and the precipitation was re-suspended in RPMI1640 culture medium (Invitrogen) containing fetal bovine serum (FBS).
2.3 Cell culture
Human CD4+ T cells were isolated by Dynabeads FlowComp Human CD4 Kit (ThermoFisher) according to the manufacturer’s instructions. Human CD4+ T cells were cultured in RPMI1640 medium (Invitrogen) supplemented with 12% FBS at 37°C. HEK293T cells were purchased from the Shanghai Cell Bank of the Chinese Academy of Sciences (Shanghai, China). HEK293T cells were cultured in Dulbecco’s Minimum Essential Medium (DMEM) high glucose medium containing 10% (v/v) FBS and 1% penicillin/streptomycin (Thermo Fisher Scientific) at 37°C with 5% CO2.
2.3 Cell transfection
The sh-p53, sh-NrCAM, sh-RUNX1-IT1, pc-p53, pcDNA-NrCAM, pc-RUNX1-IT1, and their corresponding negative controls were all purchased from GenePharma. Lipofectamine 2000 transfection reagent (Invitrogen), and was used for transfection according to the manufacturer’s instruction. CD4+ T cells and HEK293T cells were plated in a 24-well plate with growth medium for 48 h. The transfection efficiency was examined using quantitative real-time PCR.
2.4 Quantitative real-time PCR (qRT-PCR)
Total RNA from each sample was isolated using the Trizol reagent (Vigorous Biotech), and then reverse transcribed into cDNA using cDNA Synthesis Kit (Takara). QRT-PCR assay was used to validate the levels of mRNAs and lncRNAs in CD4+ T cells from GD patients and healthy controls, which performed on the ABI 7500 Fast Real-Time PCR System. QRT-PCR reaction was in 20 μL reaction volumes containing cDNA, primers, and SYBR Green Real-time PCR Master Mix (Roche). PCR cycle conditions were set as follows: 94°C for 10 min; 50 cycles were amplified at 94°C for 20 s and 60°C for 1 min. 95°C for 15 s, 60°C for 1 min, 95°C for 15 s. The 2−ΔΔCt method was used to access the relative RNA expression levels [Citation17]. ACTB was used as an internal reference. The specific primers are presented as follows:
RUNX1-IT1:
F: 5’-GAGGAAATTAGCAGAGCGATTGG-3’
R: 5’-TCATGCCTCCTGTTCTTGACA-3’)
KC6:
F: 5’-ACCTGATGGTGACAGCTTGG-3’
R: 5’-GCCACTTATGGATGGAGGGG-3’
AC000061.1:
F: 5’-CAGTGCCAGTGATAGTGGCTT-3’
R: 5’-TCGCACATTCACTGTCATACCT-3’
RP11-109K15:
F: 5’-ACCAGTAGAACGAAGCCTTGA-3’
R: 5’-TCCTGGGCATTGAAGCAGTT-3’
PRKG1-AS1:
F: 5’-CCAGCGAGCGTTATAGCAGA-3’
R: 5’-TTTGCAGAGCCTATCACCCC-3’
NrCAM:
F: 5’-ACAACTGTGGATGAAGCTGG-3’
R: 5’-TTGGCATAGGTCTCAGCAGC-3’
T-bet:
F: 5’-TGTGCTCCAGTCCCTCCATA-3’
R: 5’-TCACGGCAATGAACTGGGTT-3’
CXCL10:
F: 5’-AGTGGCATTCAAGTGCTACAA-3’
R: 5’-TGCATCGATTTTGCTCCCCT-3’
β-actin:
F: 5’-CCTTCCAGCAGATGTGGATCA-3’
R: 5’-AACGCAGCTCAGTAACAGTCC-3’
2.5 Western blot analysis
The protein expression of NrCAM was analyzed by using Western blot analysis. Cells were rinsed in phosphate buffer, and then dissociated by using RIPA lysis buffer. Protein lysates were generated after centrifugation for 20 min at 12,000 × g. The concentrations of protein extracts were determined using the Bradford method (Bio-Rad). The equal amount of protein was electrophoresed on SDS-PAGE, and then transferred to polyvinylidene difluoride (PVDF) membranes (Millipore). PVDF membranes were blocked in 5% non-fat milk for at room temperature, and then incubated with primary antibody (anti-NrCAM, 1:10000, Abcam) overnight at 4°C. Next, all membranes were incubated with horseradish peroxidase (HRP)-labeled secondary antibody at room temperature for 1 h. Immunoblots were visualized by Enhanced Chemiluminescence Kit (Beyotime) according to the manufacturer’s instructions, and then recorded the chemiluminescent signals of protein bands. β-actin was used as an internal control.
2.6 Luciferase reporter assay
The CD4+ T cells and HEK293T cells were seeded in 12-well plates and co-transfected with pc-p53, pc-p53&sh-RUNX1-IT1, pc-RUNX1-IT1&sh-p53, and the pGL4 luciferase vector (Promega, E4481) fused with the NrCAM promoter. After transfection for 48 h, the firefly luciferase activities in each well were calculated by a Firefly Luciferase Reporter Gene Assay Kit (Beyotime) following the manufacturer’s instructions.
2.7 RNA binding protein immunoprecipitation assay and RNA pull down assay
The RNA binding protein immunoprecipitation (RIP) assay was performed by the use of a Millipore EZ-Magna RIP RNA-Binding Protein Immunoprecipitation kit (Millipore) in line with the manufacturer’s recommendations. The obtained CD4+ T cells were incubated in RIP buffer for 30 min. Then they were incubated with magnetic beads conjugated to the p53 antibody (Millipore) at 4°C for 6 h. Finally, the level of RUNX1-IT1 in the coprecipitation was detected through qRT-PCR.
An RNA pull-down assay was performed using the Pierce Magnetic RNA-Protein Pull-Down Kit (ThermoFisher) according to the manufacturer’s instructions. After the biotinylated RUNX1-IT1 was transfected into CD4+ T cells, the cells were lyzed with lysis buffer at room temperature and incubated with biotinylated probes. The cell lysates were then mixed with streptavidin agarose beads (Sigma) overnight. Finally, the RNA-protein mixture was boiled in the SDS buffer for 10 min, and the protein level of p53 in the RUNX1-IT1 pull-down complex was analyzed by Western blotting.
2.8 Chromatin immunoprecipitation assay
Chromatin immunoprecipitation (ChIP) assay was performed using the EZ-Magna ChIP Chromatin Immunoprecipitation Kit (Millipore) according to the manufacturer’s instructions. CD4+ T cells in the immunoprecipitation reaction were treated with 1% formaldehyde at room temperature for 10 min, and crosslinking was stopped by using PBS solution. Immunoprecipitation was performed by incubating with antibodies against p53 (Merck) or immunoglobulin G (IgG) and Histone H3, and Dynabeads Protein A/G magnetic beads overnight. Co-precipitated DNA was quantified using the Qiagen PCR Cleanup Kit.
2.9 Enzyme-linked immunosorbent assay (ELISA)
ELISA was performed to detect the levels of transcriptional regulator T-bet and CXC chemokine ligand 10 (CXCL10) by a commercially available ELISA kit from Enzyme-linked Biotechnology Co., Ltd. (Shanghai, China) according to the manufacturer’s recommendations. In short, an eight-point calibration curve was established using the standard solution. The absorbance of each sample was measured at 450 nm with an ELISA plate reader, and then the data was plotted on the calibration curve.
2.10 Flow cytometry analysis
Peripheral blood mononuclear cells were isolated, and then blocked by Fc receptors before staining with a specific antibody. The PE-conjugated anti-CD4 antibody (BOSTER, China) was used for surface staining, and PE-IFN-γ (eBioscience, USA) was used for intracellular staining according to the manufacturer’s instructions. Flow cytometry was performed using a FACS Calibur analyzer (BD, USA), and data analysis was performed using CellQuest software.
2.11 Statistical analysis
SPSS 20.0 system software was used for statistical analysis that collected from at least three independent experiments. The measurement data were represented as mean ± standard deviation (SD). Student’s t-test was used to analyze the difference between the two groups, and Pearson correlation analysis was used for the correlation between the two measurement data. P < 0.05 was considered to be significantly different.
3 Results
3.1 The expression difference of related lncRNAs and NrCAM in CD4+ T cells before and after GD onset
In order to accurately explore the role of GD-related lncRNAs, we selected GSM2700240 RA1, GSM2700241 RA2, GSM2700242 RA3, GSM2700243 HC1, GSM2700244 HC2 and GSM2700245 HC3 from RA chip dataset GSE101193 for bioinformatics analysis. Taking adj.p < 0.05 and |logFC| ≥ 1 as screening conditions, we selected five lncRNAs, which are lncRNA RUNX1-IT1, lncRNA KC6, lncRNA AC000061.1, lncRNA RP11-109K15 and lncRNA PRKG1-AS1, respectively. Next, we used clinical samples for verification. After collecting peripheral blood from healthy people (HC, 30 cases) and GD patients (GD, 30 cases), we used immunomagnetic beads to isolate CD4+ T cells. QRT-PCR was used to detect the levels of the above five lncRNAs in CD4+ T cells, and it was found that lncRNA RUNX1-IT1 was most significantly up-regulated in the GD group compared with the HC group (, ***P < 0.001).
Figure 1. The expression difference of related lncRNAs and NrCAM in CD4 + T cells before and after GD onset. (a). After collecting peripheral blood from healthy people (HC, 30 cases) and GD patients (GD, 30 cases), immunomagnetic beads were used to select CD4+ T cells. QRT-PCR was used to detect the levels of lncRNAs in CD4+ T cells. *P < 0.05, ***P < 0.001 vs. HC group. QRT-PCR (b) and Western blot (c) detections were used to detect the level of NrCAM. **P < 0.01 vs. HC group. (d) Correlation analysis of RUNX1-IT1 and NrCAM in HC group (n = 30) and GD patients (n = 30).
Based on the results of clinical sample validation, we selected the samples with up-regulated RUNX1-IT1 level for the next study. As shown in , qRT-PCR detection indicated that the mRNA level of NrCAM in CD4+ T cells of GD group was up-regulated compared with that of HC group (**P < 0.01), and Western blot showed that the protein level of NrCAM was also promoted. Furthermore, correlation analysis showed that the expressions of RUNX1-IT1 and NrCAM were correlated in CD4+ T cells (). In supplementary Figure S1, we studied the correlation between RUNX1-IT1 and NRCAM and FT4, TSH and TRAb. The results showed that RUNX1-IT1-IT1 and NRCAM were positively correlated with FT3, FT4 and TRAb levels, but negatively correlated with TSH levels. Based on the above results, we found that the expressions of RUNX1-IT1 and NrCAM in CD4+ T cells were indeed significantly up-regulated in GD patients, indicating that they were key factors for the occurrence and development of GD.
3.2 Interference with RUNX1-IT1 in CD4+ T cells affects NrCAM expression
We first used CD4+ T cells derived from healthy people to construct overexpressed plasmids and lentivirus-interfering plasmids of NrCAM, which were divided into pc-NC group, pc-NRCAM group, sh-NC group and sh-NRCAM group, respectively. QRT-PCR analysis at mRNA level presented that NrCAM was up-regulated in CD4+ T cells after the overexpression of NrCAM, along with the increased NrCAM level by Western blot assay; while the level of RUNX1-IT1 did not change (, ***P < 0.001). In addition, NrCAM level was down-regulated after transfection of sh-NrCAM in CD4+ T cells, along with the decreased NrCAM by Western blot assay; while RUNX1-IT1 level did not change (, ##P < 0.01).
Figure 2. Interference with RUNX1-IT1 in CD4 + T cells affects NrCAM expression. (a-b) CD4+ T cells derived from healthy people were constructed overexpressed plasmids and lentivirus-interfering plasmids of NrCAM, which were divided into pc-NC group, pc-NRCAM group, sh-NC group and sh-NRCAM group, respectively. QRT-PCR (a) and Western blot (b) were used to detect the level of RUNX1-IT1 or NrCAM. ***P < 0.001 vs. pc-NC group, ##P < 0.01 vs. sh-NC group. (c-d) The overexpressed plasmids and lentivirus-interfering plasmids of RUNX1-IT1 were constructed in CD4+ T cells from healthy people, which were divided into pc-NC group, pc-RUNX1-IT1 group, sh-NC group and sh-RUNX1-IT1 group, respectively. QRT-PCR (c) and Western blot (d) were used to detect the level of RUNX1-IT1 or NrCAM. ***P < 0.001 vs. pc-NC group, ##P < 0.01, ###P < 0.001 vs. sh-NC group.
Next, we constructed the overexpressed plasmids and lentivirus-interfering plasmids of RUNX1-IT1 using CD4+ T cells from healthy people which were divided into pc-NC group, pc-RUNX1-IT1 group, sh-NC group and sh-RUNX1-IT1 group, respectively. When compared with pc-NC group, the levels of NrCAM and RUNX1-IT1 in CD4+ T cells transfected with pc-NRCAM were significantly increased by qRT-PCR (, ***P < 0.001). Furthermore, the levels of NrCAM and RUNX1-IT1 in CD4+ T cells were down-regulated after transfection with sh-RUNX1-IT1 compared with the sh-NC group (, ##P < 0.01, ###P < 0.001). The variation trend of NrCAM protein level was consistent with its mRNA level (). These results suggested that lncRNA RUNX1-IT1 could affect the expression of NrCAM in CD4+ T cells.
3.3 Mechanism of RUNX1-IT1 regulating NrCAM
How does RUNX1-IT1 regulate NrCAM? Based on the consistency of their variation trends, we hypothesized that RUNX1-IT1 participated in the transcription of NrCAM as a component of the NrCAM transcription complex, thus regulating NrCAM. We used the online site ALGGEN to predict the potential transcription factor of NrCAM, and found that p53 was highly likely to bind to NrCAM (). We first transfected 293 T cells with pc-p53, and found that the overexpression of p53 could promote the promoter activity of NrCAM by Luciferase reporter assay, and knockdown of RUNX1-IT1 reversed this effect after transfection with sh-RUNX1-IT1 (, *P < 0.05, #P < 0.05). As shown in , overexpression of RUNX1-IT1 in 293 T cells increased NrCAM promoter activity (*P < 0.05), while knockdown of p53 reversed this effect (#P < 0.05), and the same changes occurred in CD4+ T cells (, *P < 0.05, #P < 0.05). Next, p53 was knocked down in CD4+ T cells, and the mRNA level of NrCAM was down-regulated (, **P < 0.01). The above results indicated that RUNX1-IT1 and transcription factor p53 could influence the transcription process of NrCAM.
Figure 3. Mechanism of RUNX1-IT1 regulating NrCAM. (a) The potential transcription factors of lNrCAM were predicted. (b) The promoter activity of NrCAM was detected by Luciferase reporter assay in 293 T cells after the overexpression of p53 and knockdown of RUNX1-IT1. *P < 0.05 vs. pc-NC group, #P < 0.05 vs. pc-p53&sh-NC group. (c) The promoter activity of NrCAM was detected by Luciferase reporter assay in 293 T cells after the overexpression of RUNX1-IT1 and knockdown of p53. (d) The promoter activity of NrCAM was detected by Luciferase reporter assay in CD4+ T cells. *P < 0.05 vs. pc-NC group, #P < 0.05 vs. pc-RUNX1-IT1&sh-NC group. (e) QRT-PCR was used to detect the level of NrCAM. RNA pull down (f) and RIP (g) experiments were performed to verify the correlation between p53 and RUNX1-IT1. ***P < 0.001 vs. IgG. (h) The interaction between p53 and NrCAM was detected by ChIP assay. Negative control: IgG, positive control: H3. (i) The interaction between p53 and NrCAM after the overexpression of RUNX1-IT1 in CD4+ T cells was detected by ChIP assay. *P < 0.05 vs. pc-NC group.
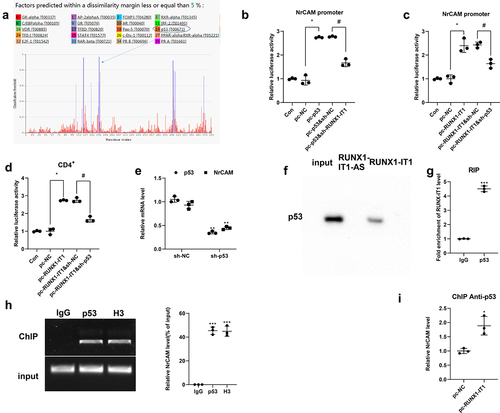
Next, we performed RNA pull down and RIP experiments to verify the correlation between p53 and RUNX1-IT1. Western blot analysis presented that the expression of p53 was detected in the RUNX1-IT1 pulled down complex (), while the RIP assay showed that RUNX1-IT1 enriched in the immunoprecipitation of p53 (), indicating that there was an interaction between p53 and RUNX1-IT1. In addition, p53 could significantly bind NrCAM compared with negative control IgG by ChIP assay, and Histone H3 was used as a positive control. (, ***P < 0.001), indicating that p53 could also interact with NrCAM. Moreover, ChIP assaywas performed using anti-p53, and the results showed that NrCAM level was up-regulated after the overexpression of RUNX1-IT1 in CD4+ T cells (, *P < 0.05). These results suggested that RUNX1-IT1 could influence the transcription process of NrCAM by targeting p53.
3.4 Effects of RUNX1-IT1 and NrCAM on Th1 differentiation markers
Studies have shown that the Th2 type immunity is targeted mainly at the later stage of GD treatment, the Th1 immune response is generally present at the beginning of GD’s active phase and during its recurrence [Citation18]. Since the GD patients in this study were not treated after initial diagnosis, we tested the Th1 differentiation markers. In order to detect the influence of RUNX1-IT1 and NrCAM on Th1 differentiation, we first used magnetic beads to isolate CD4+ T cells from human peripheral blood, and then transfected with pc-NC, pc-NrCAM, sh-NC, and sh-NrCAM plasmids. As is presented in , qRT-PCR and ELISA assays showed that overexpression of NrCAM could improve the levels of transcriptional regulator T-bet and CXC chemokine ligand 10 (CXCL10), while interference with NrCAM could down-regulate the mRNA levels of T-bet and CXCL10 and protein level of CXCL10. Furthermore, CD4+ T cells were transfected with pc-NC, pc-RUNX1-IT1, sh-NC, and sh-RUNX1-IT1 plasmids. When compared with pc-NC group, T-bet and CXCL10 levels were improved in CD4+ T cells transfected with pc-RUNX1-IT1 (, **P < 0.01, ***P < 0.001). On the contrary, down-regulation of RUNX1-IT1 could reduce the mRNA levels of T-bet and CXCL10 by qRT-PCR and CXCL10 protein level by ELISA assay (, #P < 0.05, ##P < 0.01). The above results indicated that RUNX1-IT1 and NrCAM could influence the process of Th1 differentiation, thus affecting the development of GD.
Figure 4. Effects of RUNX1-IT1 and NrCAM on Th1 differentiation markers. (a-b) CD4+ T cells were isolated from human peripheral blood, and then transfected with pc-NC, pc-NrCAM, sh-NC, and sh-NrCAM plasmids. QPCR (a) and ELISA (b) assays detected the level of NrCAM. (c-d) CD4+ T cells were transfected with pc-NC, pc-RUNX1-IT1, sh-NC, and sh-RUNX1-IT1 plasmids. The mRNA levels of T-bet and CXCL10 were detected by qRT-PCR (c) and protein level of CXCL10 were detected by ELISA assays (d). *P < 0.05, **P < 0.01, ***P < 0.001 vs. pc-NC group, #P < 0.05, ##P < 0.01, ###P < 0.001 vs. sh-NC group.
3.5 RUNX1-IT1 influences Th1 differentiation of CD4+ T cells by regulating NrCAM transcription
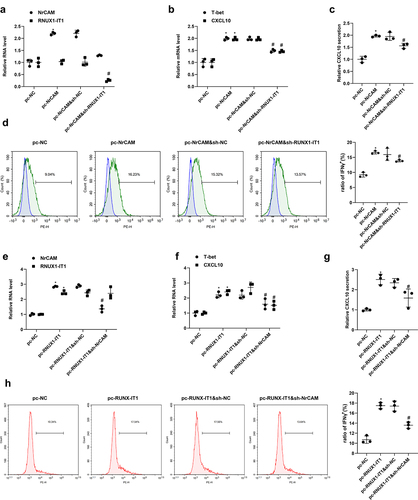
CD4+ T cells were transfected with NrCAM overexpression plasmid, and then transfected with RUNX1-IT1 lentivirus-interfering plasmid, which were divided into pc-NC group, pc-NrCAM group, pc-NrCAM&sh-NC group and pc-NrCAM&sh-RUNX1-IT1 group. As is presented in , the level of NrCAM was significantly increased in the pc-NrCAM group when comparing with the level in the pc-NC group (**P < 0.01), and then decreased after transfection with sh-RUNX1-IT1 (###P < 0.001). The mRNA levels of T-bet and CXCL10 and protein production of CXCL10 were highly expressed in the pc-NrCAM group than those in the control group, and then drastically decreased after transfection with sh-RUNX1-IT1 (, **P < 0.01, ###P < 0.001). Flow cytometry assay was used to detect the percentage of interferon γ (IFN-γ), which was used to characterize the proportion of Th1 cells. The results showed that the percentage of IFN-γ in the pc-NRCAM group was greatly higher than that in the control group, but the percentage of IFN-γ decreased after the knockdown of RUNX-IT1 (, *P < 0.05, #P < 0.05). Next, CD4+ T cells were divided into pc-NC group, pc-RUNX1-IT1 group, pc-RUNX1-IT1&sh-NC group and pc-RUNX1-IT1&sh-NRCAM group. It was found that overexpressing RUNX-IT1 could promote Th1 differentiation, and then knock down of NrCAM would lead to the inhibition of Th1 differentiation (, *p < 0.05 vs pc-NC, #p < 0.05 vs pc-RUNX-IT1&sh-NC). The above results suggested that RUNX1-IT1 influences Th1 differentiation of CD4+ T cells by regulating NrCAM transcription.
Figure 5. RUNX1-IT1 influences Th1 differentiation of CD4+ T cells by regulating NrCAM transcription. CD4+ T cells were transfected with NrCAM overexpression plasmid, and then transfected with RUNX1-IT1 lentivirus-interfering plasmid, which were divided into pc-NC group, pc-NrCAM group, and pc-NrCAM&sh-RUNX1-IT1 group. (a) QRT-PCR was used to detect the levels of NrCAM and RUNX1-IT1. (b) QRT-PCR was used to detect the levels of T-bet and CXCL10. (c) ELISA assay was used to detect CXCL10 level. (d) Flow cytometry assay was used to detect the percentage of IFN-γ. *P < 0.05, **P < 0.01, ***P < 0.001 vs. pc-NC group, #P < 0.05, ##P < 0.01, ###P < 0.001 vs. pc-NrCAM&sh-NC group. CD4+ T cells were divided into pc-NC group, pc-RUNX1-IT1 group, pc-RUNX1-IT1&sh-NC group and pc-RUNX1-IT1&sh-NRCAM group. (e) QRT-PCR was used to detect the levels of NrCAM and RUNX1-IT1. (f) QRT-PCR was used to detect the levels of T-bet and CXCL10. (g) ELISA assay was used to detect CXCL10 level. (h) Flow cytometry assay was used to detect the percentage of IFN-γ. *p < 0.05 vs pc-NC, #p < 0.05 vs pc-RUNX-IT1&sh-NC.
4 Discussion
A large amount of evidence indicates that lncRNAs play a crucial role in immune regulation and autoimmunity. LncRNAs can be expressed in T lymphocytes, B lymphocytes, macrophages, dendritic cells (DC) and natural killer (NK) cells, thus participating in the differentiation and activation of immune cells [Citation19]. In order to accurately explore the role of GD-related lncRNAs, we performed bioinformatics analysis, and then selected five lncRNAs. Next, we used clinical samples for verification, and found that lncRNA RUNX1-IT1 was most significantly up-regulated in the GD group compared with the HC group. At present, there are very few studies on lncRNA RUNX1-IT1, and most of them focus on its role in cancer, such as hepatocellular carcinoma [Citation20,Citation21], ovarian cancer [Citation22], colorectal cancer [Citation23] and pancreatic cancer [Citation24]. Only one study focused on Large Artery Atherosclerosis (LAA) [Citation25]. In this study, we the first demonstrated the role of RUNX1-IT1 in the immune regulation of GD.
NrCAM is expressed in a variety of tissues throughout the body. Our previous verification with clinical samples found that NrCAM expression was dramatically up-regulated in CD4+ T cells of GD patients, and was significantly positively correlated with RUNX1-IT1 expression. p53 is generally considered to be a tumor suppressor gene because its encoding protein, p53, is involved in cell cycle arrest and apoptosis [Citation26]. Apoptosis not only inhibits the growth of tumor, but also regulates T cells and B cells immune responses by removing both autoreactive and non-reactive immune elements [Citation27]. p53 is generally expressed to varying degrees in various cancer cells, but is also found in non-cancerous thyroid tissues. Furthermore, it has been reported that p53 in thyroid cells was closely related the treatment of GD and other autoimmune diseases [Citation28]. Based on the consistency of variation trends of RUNX1-IT1 and NrCAM, we hypothesized that RUNX1-IT1 participated in the transcription of NrCAM as a component of the NrCAM transcription complex, thus regulating NrCAM. We predicted that p53 was highly likely to be the potential transcription factor of NrCAM. Our results found that p53 could interact with NrCAM, and NrCAM level was up-regulated after the overexpression of p53 in CD4+ T cells, while knockdown of RUNX1-IT1 reversed this effect. These results suggested that RUNX1-IT1 could influence the transcription process of NrCAM by targeting p53.
As a pathological feature of GD, intrathyroidal lymphocyte infiltration usually consists of T cells and B cells, suggesting that it is involved in the pathogenesis of both cell-mediated and humoral immunity diseases [Citation29]. Th1 cells, are produced by the differentiation of CD4+ T cells induced by interleukin-12 (IL-12), interferon-γ (IFN-γ), interleukin-2 (IL-2), and transcription factor T-bet, mainly secrete cytokines such as IL-1, IL-2, IFN-γ, and transforming growth factor-β (TGF-β). Th1 cells can activate the immune response in conjunction with macrophages and other T lymphocytes [Citation30,Citation31]. Eshaghkhani et al. [Citation4] found that the mRNA levels of T-bet and IFN-γ in GD patients were significantly higher than those in healthy controls, while the mRNA levels of GATA-binding protein 3 (GATA3) and interleukin-4 (IL-4) were decreased. These results suggested that there was Th1/Th2 imbalance in GD patients, which might be related to the pathogenesis of the disease. In this study, we found that knockdown of NrCAM and RUNX1-IT1 could down-regulate the mRNA and protein levels of T-bet and CXCL10 in CD4+ T cells. The above results indicated that RUNX1-IT1 and NrCAM could influence the process of Th1 differentiation, thus affecting the development of GD.
Based on the above theoretical basis and the early stage of the work, we propose a scientific hypothesis that RUNX1-IT1 regulates the expressions of the important Th1 factor T-bet, CXCL10, and IFN-γ by regulating NrCAM transcription, thus affecting the function of CD4+ T cells, and participating in the occurrence and development of specific autoimmune disease GD.
Availability of data and material
The datasets used and/or analyzed during the current study are available from the corresponding author on reasonable request.
Supplemental Material
Download JPEG Image (2 MB)
Disclosure statement
No potential conflict of interest was reported by the author(s).
Supplementary material
Supplemental data for this article can be accessed here.
Additional information
Funding
Related Research Data
References
- Yin Q, Shen L, Qi Y, et al. Decreased SIRT1 expression in the peripheral blood of patients with Graves’ disease. J Endocrinol. 2020;246(2):161–173.
- Burch HB. Cooper DSJJotAMA: graves Disease. 314.
- Maria Ramos-Levi A, and Marazuela M. Pathogenesis of thyroid autoimmune disease: the role of cellular mechanisms. Endocrinol Y Nutr. 2016;63(8):421–429.
- Eshaghkhani Y, Sanati MH, Nakhjavani M, et al. Disturbed Th1 and Th2 balance in patients with Graves’ disease. Minerva Endocrinol. 2016;41(1):28–34.
- Fu X-D. Non-coding RNA: a new frontier in regulatory biology. Natl Sci Rev. 2014;1(2):190–204.
- Yi R, Yang L, Zeng S, et al. Different expression profile of mRNA and long noncoding RNA in autoimmune thyroid diseases patients. J Cell Biochem. 2019;120(12):19442–19456.
- Wu G-C, Pan H-F, Leng R-X, et al. Emerging role of long noncoding RNAs in autoimmune diseases. Autoimmun Rev. 2015;14(9):798–805.
- Wang P, Xue Y, Han Y, et al. The STAT3-Binding Long Noncoding RNA lnc-DC Controls Human Dendritic Cell Differentiation. Science. 2014;344(6181):310–313.
- Zhang Y, Cao X. Long noncoding RNAs in innate immunity. Cell Mol Immunol. 2016;13(2):138–147.
- Foronjy R. Commentary on: the potency of lncRNA MALAT1/miR-155 in altering asthmatic Th1/Th2 balance by modulation of CTLA4. Biosci Rep. 2020;40(5). 10.1042/BSR20190768
- Christensen NJ, Habekost G, Bratholm P. Decrease in TSH Receptor Autoantibodies during Antithyroid Treatment: relationship with a Long Noncoding Heg RNA and Cdk1 mRNA in Mononuclear Cells. ISRN Endocrinol. 2011;2011:287052.
- Huang Q, Cai W, Sun B, et al. Clinical study of rheumatoid arthritis patients associated with thyroid function abnormalities. Chin J Rheumatol. 2015;19(8):545–548.
- Carbajal KS, Mironova Y, Ulrich-Lewis JT, et al. Th Cell Diversity in Experimental Autoimmune Encephalomyelitis and Multiple Sclerosis. J Iimmunol. 2015;195(6):2552–2559.
- Sytnyk V, Leshchyns’ka I, Schachner M. Neural Cell Adhesion Molecules of the Immunoglobulin Superfamily Regulate Synapse Formation, Maintenance, and Function. Trends Neurosci. 2017;40(5):295–308.
- Zhang Y, Sui F, Ma J, et al. Positive Feedback Loops Between NrCAM and Major Signaling Pathways Contribute to Thyroid Tumorigenesis. J Clin Endocrinol Metab. 2017;102(2):613–624.
- Hui Y, Huang Y, Ding X, et al. MicroRNA-152 suppresses cell proliferation and tumor growth of bladder cancer by targeting KLF5 and MKK7. Aging Pathobiology Ther. 2019;1(1):10–16.
- Livak KJ, Schmittgen TD. Analysis of relative gene expression data using real-time quantitative PCR and the 2(T)(-Delta Delta C) method. Methods. 2001;25(4):402–408.
- Fallahi P, Ferrari SM, Ragusa F, et al. Th1 Chemokines in Autoimmune Endocrine Disorders. J Clin Endocrinol Metab. 2020;105(4):1046–1060.
- Hur K, Kim S-H, and Kim J-M. Potential Implications of Long Noncoding RNAs in Autoimmune Diseases. Immune Netw. 2019;19(1).
- Yan PH, Wang L, Chen H, et al. LncRNA RUNX1-IT1 inhibits proliferation and promotes apoptosis of hepatocellular carcinoma by regulating MAPK pathways. Eur Rev Med Pharmacol Sci. 2019;23(19):8287–8294.
- Sun L, Wang L, and Chen T, et al. LncRNA RUNX1-IT1 which is downregulated by hypoxia-driven histone deacetylase 3 represses proliferation and cancer stem-like properties in hepatocellular carcinoma cells. Cell Death Dis. 2020;11:2.
- Yang K, Hou Y, Li A, et al. Identification of a six-lncRNA signature associated with recurrence of ovarian cancer. Sci Rep. 2017;7(1):7.
- Shi J, Zhong X, Song Y, et al. Long non-coding RNA RUNX1-IT1 plays a tumour-suppressive role in colorectal cancer by inhibiting cell proliferation and migration. Cell Biochem Funct. 2019;37(1):11–20.
- Liu S, Zhang J, and Yin L, et al. The lncRNA RUNX1-IT1 regulates C-FOS transcription by interacting with RUNX1 in the process of pancreatic cancer proliferation, migration and invasion. Cell Death Dis. 2020;11(6):412.
- Fasihi A, Heydari-Zarnagh H, Zahedi M, et al. Study and Characterization of Long Non-coding RUNX1-IT1 among Large Artery Atherosclerosis Stroke Patients Based on the ceRNA Hypothesis. J Mol Neurosci. 2020;71(3):455–465.
- Pellegrino M, Traversi G, Arena A, et al. Effect of p53 activation through targeting MDM2/MDM4 heterodimer on T regulatory and effector cells in the peripheral blood of Type 1 diabetes patients. Plos One. 2020;15(1):e0228296.
- Takatori H, Kawashima H, Suzuki K, et al. Role of p53 in Systemic Autoimmune Diseases. Crit Rev Immunol. 2014;34(6):509–516.
- Leite JL, Bufalo NE, Santos RB, et al. Herpesvirus type 7 infection may play an important role in individuals with a genetic profile of susceptibility to Graves’ disease. Eur J Endocrinol. 2010;162(2):315–321.
- Chen RH, Chang CT, Wang TY, et al. p53 codon 72 proline/arginine polymorphism and autoimmune thyroid diseases. J Clin Lab Anal. 2008;22(5):321–326.
- Inoue N, Watanabe M, Nakaguchi A, et al. Functional polymorphisms affecting Th1 differentiation are associated with the severity of autoimmune thyroid diseases. Endocr J. 2017;64(7):695–703.
- Gonzalez-Amaro R, Marazuela M. T regulatory (Treg) and T helper 17 (Th17) lymphocytes in thyroid autoimmunity. Endocrine. 2016;52(1):30–38.