
ABSTRACT
The effects of miR-144-5p and paclitaxel (PTX) on thyroid carcinoma were less explored. Thus, we investigated the effects of miR-144-5p and PTX on thyroid carcinoma. The expression and target gene of miR-144-5p in thyroid carcinoma were analyzed by bioinformatics, y qRT-PCR and dual-luciferase reporter assay. After the transfection mediated by ultrasound-targeted microbubble destruction (UTMD) or liposome, or the treatment of PTX, the viability, proliferation, migration, and invasion of thyroid carcinoma cells were detected by MTT, colony formation, wound-healing, and transwell assays. The expressions of miR-144-5p, STON2, MMP-9, E-cadherin, and N-cadherin in cells were calculated via qRT-PCR or Western blotting. After a subcutaneous-xenotransplant tumor model was established using BALB/c nude mice and further treated with PTX and UTMD-mediated miR-144-5p, the volume, weight, and Ki67 level of tumor were recorded or evaluated by immunohistochemical assays. MiR-144-5p, which was low-expressed in thyroid carcinoma, directly down-regulated STON2 level. MiR-144-5p overexpression and PTX inhibited the viability, proliferation, migration, and invasion of thyroid carcinoma cells, while miR-144-5p silencing caused the opposite results. MiR-144-5p overexpression and PTX further up-regulated E-cadherin level and down-regulated those of MMP-9 and N-cadherin in thyroid carcinoma cells. STON2 overexpression reversed the effects of miR-144-5p overexpression.. MiR-144-5p overexpression enhanced the inhibiting effect of PTX on tumor volume, weight, and Ki67 level of xenotransplant tumor, and the effects of UTMD-mediated miR-144-5p overexpression were stronger than those mediated by liposome. Collectively, UTMD-mediated miR-144-5p overexpression enhanced the anti-tumor effect of PTX on thyroid carcinoma by targeting STON2.
Introduction
Thyroid carcinoma, which is the most common malignant tumor of the endocrine system, head, and neck, is also one of the malignant tumors with the fastest growing incidence in recent years [Citation1]. According to the origin of tumor cells, thyroid carcinoma can be divided into papillary thyroid carcinoma (PTC), follicular thyroid carcinoma (FTC), undifferentiated thyroid carcinoma (UTC), and medullary thyroid carcinoma (MTC) [Citation2,Citation3]. The variety and complexity of thyroid cancer types and the different pathogenesis make it profoundly difficult to treat thyroid carcinoma. At present, surgery, chemotherapy, and radiotherapy are proposed as the major treatments for thyroid carcinoma [Citation4]. However, post-surgery recurrence and metastasis remain inevitable, and radiotherapy and chemotherapy will cause serious side effects [Citation2,Citation4]. Therefore, it is urgent to develop a novel therapeutic method for thyroid carcinoma.
Paclitaxel (PTX), a natural alkaloid extracted from yew, has been widely used as a chemotherapeutic drug for the treatment of malignant tumors, such as breast cancer, prostate cancer, gastric cancer, non-small cell lung cancer, and ovarian cancer [Citation5–10]. Studies also reported the inhibitory effect of PTX on thyroid carcinoma. For example, PTX induces apoptosis and inhibits the angiogenesis of thyroid carcinoma cells [Citation11,Citation12]. PTX also inhibits tumor growth of an in vivo thyroid carcinoma-modeled mice [Citation13]. Though weekly PTX treatment is proven to be an effective adjuvant therapy for patients with clinical thyroid carcinoma [Citation14], the cancer cells still develop resistance to PTX [Citation15]. Therefore, finding the methods to further improve the inhibiting effect of PTX on thyroid carcinoma is of great significance for the treatment of cancers including thyroid carcinoma.
Previous research additionally showed that the effects of chemotherapeutic drugs including PTX on cancer cells can be strengthened by several miRNAs. For instance, the cytotoxicity of cisplatin in prostate cancer cells can be promoted by miR-205 [Citation16], and the anti-tumor effect of PTX on cervical cancer is found to be enhanced by miR-34a [Citation17]. However, the regulation of miRNA on thyroid carcinoma as well as it involvement in enhancing the effect of PTX on thyroid carcinoma should be further determined.
Ultrasound Targeted Microbubble Disruption (UTMD) is a novel transfection method in which reversible micropores were formed in the cell membrane under the action of ultrasound waves to increase the permeability of cell membrane, and at the same time, microbubbles containing target genes can rupture, releasing exogenous target genes that can enter the cell to exert their effects [Citation18,Citation19]. Moreover, UTMD has been gradually and widely applied in basic research for its low immunogenicity, low toxicity, reusability, and easy operation [Citation20,Citation21].
This study first determined the miRNA with a regulatory effect on thyroid carcinoma, then evaluated the effect of the miRNA and its downstream mechanism on thyroid carcinoma and examined whether the miRNA could enhance the suppressing effect of PTX on thyroid carcinoma. Finally, the performance of UTMD-mediated transfection was compared with that mediated by traditional liposome. Our research attempted to explore the role of miRNAs in the progression of thyroid carcinoma and the feasibility of UTMD-mediated gene therapy.
Methods
Ethics statement
PTC tissues and adjacent tissues were collected from 40 patients with PTC who received operation treatment in Yancheng No. 1 People’s Hospital. The patient was confirmed to have thyroid cancer when initially receiving chemotherapy or radiotherapy. The clinical tissues used in this research were approved by the Ethics Committee of Yancheng No. 1 People’s Hospital (Z2020030402T) and all the patients signed written informed consent. The animal experiments were approved by the Committee of Experimental Animals of Yancheng No. 1 People’s Hospital (Z2020052723T). All animal experiments were performed in accordance with the principles of the China Council on Animal Care and Use.
Bioinformatics analysis
The differentially expressed genes in thyroid carcinoma were analyzed based on the data downloaded from the Cancer Genome Atlas database. The potential target gene of miR-144-5p was predicted by TargetScan (http://www.targetscan.org/vert_72/).
Cell culture
Human normal thyroid epithelial cell-line Nthy-ori3-1 (Catalog No.: 90,011,609) was purchased from ECACC (https://www.phe-culturecollections.org.uk/products/celllines). Human PTC cell line TPC-1 (Catalog No.: CL-0643) and FTC cell line FTC-133 (Catalog No.: CL-0644) were ordered from Procell (https://www.procell.com.cn). Undifferentiated thyroid carcinoma cell-line HTH83 (Catalog No.: 0005148) was obtained from BioPortal (https://bioportal.bioontology.org). PTC cell line IHH4 (Catalog No.: JCRB1079) was available from JCRB cell Bank (https://cellbank.nibiohn.go.jp). All cells were grown in RPMI 1640 medium (72,400,120, Gibco, Waltham, Massachusetts, USA) containing 10% FBS (10,437,010, Gibco) and 1% Penicillin-Streptomycin (15,140,163, Gibco) and cultured in a 37°C environment with 5% CO2.
Liposome transfection
MiR-144-5p mimic (M; 5’-GGAUAUCAUCAUAUACUGUAAG-3’), inhibitor (I; 5’-CUUACAGUAUAUGAUGAUAUCC-3’), and miRNA negative control (NC; 5’-UUCUCCGAACGUGUCACGUUU-3’) were purchased from RIBOBIO (Guangzhou, China). The sequences of STON2 inserted into pcDNA3.1+ vector were purchased from GenePharma (Shanghai, China), and the empty pcDNA3.1 vector acted as the negative control (NC). Before transfection, TPC-1 and IHH4 cells were cultured in the 6-well plates. After the cell confluence reached about 80%, miR-144-5p mimic, inhibitor, or the overexpression vector of STON2 were transfected into the cells with Lipofectamine 2000 (11,668,019, Invitrogen, MA, USA), respectively. The cells were collected and used in the following experiments after being transfected for 48 h.
Dual-luciferase reporter assay
To verify the binding relationship between miR-144-5p with STON2, the dual-luciferase reporter assay was performed. In brief, wide-type sequence of STON2 (STON2-WT) containing the binding sites with miR-144-5p (5’-TTAGAACATAAATTAGATATCAC-3’) and mutant-type sequence of STON2 (STON2-MUT, 5’-TTAGAACATAAATTAGCTGACAC-3’) were cloned into the pGL3-basic vectors (HG-VQP0121, HonorGene, Changsha, China), respectively. Also, TPC-1 and IHH4 cells were cultured in the 48-well plates and were then co-transfected with the vectors of STON2 and miR-144-5p mimic after the cell confluence reached about 80% via liposome. Then, the cells were lysed and treated with the dual-luciferase reporter kit (ab228530, Abcam, Cambridge, UK). Finally, the luciferase activity of cells was measured under a SpectraMax reader (Molecular Devices, Shanghai, China).
UTMD transfection
The UTMD transfection was performed according to the previous research [Citation22,Citation23]. Before transfection, 2.0 × 10⁵ TPC-1 and IHH4 cells were seeded into the 6-well plates. The SonoVue (J20130045, Bracco Imaging B.V., Milan, Italy) was diluted by normal saline (ST341, Beyotime, Shanghai, China) to a concentration of 2 × 10⁸ bubbles/ml, and the SonoVue microbubbles were observed under an optical microscope (BX53, Olympus, Tokyo, Japan). The miR-144-5p mimic and mimic control were then gradually added into the SonoVue. After the cell confluence reached about 80%, the SonoVue containing miR-144-5p mimic or mimic control were added into the 6-well plates, respectively. Then the cells were given the ultrasound irradiation at 1 MHz and 1 W/cm2 for 30s using a therapeutic AH6 ultrasound machine (Bandelin, Berlin, Germany). After the cells were cultured in a 37°C humidified atmosphere with 5% CO2 for 3 h, the medium was refreshed for an additional 48-h cell culture. TPC-1 and IHH4 cells with the transfection of miR-144-5p mimic and mimic control using UTMD were named UTMD-M and UTMD-MC in this study, respectively. Transfection efficiency was analyzed by quantitative real-time PCR (qRT-PCR).
PTX treatment
PTX (HY-B0015) was purchased from MedChemExpress (Princeton, New Jersey, USA). Before treatment, the TPC-1 and IHH4 cells with or without transfection were cultured in 6-well plates or 96-well plates (for the detection of cell viability). After the cell concentration reached about 60%, different concentrations of PTX (2, 4, 6, 8, 10, 15, 20 nmol/l) in the medium was added into the 6-well plates or 96-well plates to incubate the cells for 48 h. Finally, the cells were collected for later use.
MTT assay
After the TPC-1 and IHH4 cells were transfected or received PTX treatment in 96-well plate for 48 h, the medium in the plates was replaced with 100 μl MTT solution (0.5 mg/ml, HY-15924, MedChemExpress). The cells were further incubated for 4 h, and then added with 100 μl Dimethyl sulfoxide (ST038, Beyotime). Finally, the absorbance in cells was measured by a microplate reader (Imark; Bio-Rad, Hercules, California, USA) under 570 nm.
Colony formation assay
After transfection or PTX treatment, 1000 TPC-1 and IHH4 cells with 2 ml medium were collected and further placed into each well of 6-well plate. After the cells were cultured for 2 weeks and the cell colonies were formed, the medium was discarded and the colonies were fixed with 200 μl paraformaldehyde fixative (P0099, Beyotime) for 15 minutes (min). PBS (C0221A, Beyotime) was used to wash the cells twice, and then the colonies were further stained with 200 μl Crystal Violet Staining Solution (C0121, Beyotime) for 15 min. The extra staining solution was washed with PBS, and the image of cell colonies was taken by a camera (Alpha 7 R IV, SONY, Tokyo, Japan), and colony numbers were counted by Image J.
Wound-healing assay
After transfection or PTX treatment, TPC-1 and IHH4 cells cultured in 2 ml medium were collected and placed into each well of 6-well plate. After the cell confluence reached about 100%, a wound in each well was created by a pipette tip. Then the medium was replaced with FBS-free medium to culture the cells for 24 h. Finally, the image of the wound in each well was recorded by an optical microscope, and the data of cell migration were analyzed by Image J software (Version 1.8.0).
Transwell assay
After transfection or PTX treatment, 1.0 × 10⁵ TPC-1 and IHH4 cells cultured in 200 μl FBS-free medium were collected, added into 2 ml medium, then collected and placed into Transwell chambers (3422, Corning, Corning, New York, USA) pre-coated with Matrigel (354,234, Corning). Then, the Transwell chambers were inserted into a 24-well plate where 700 μl medium with 10% FBS was pre-added. After being cultured for 24 h, the invaded cells were fixed with paraformaldehyde fixative for 15 min and dyed with Crystal Violet Staining Solution for 15 min. Then, the extra staining solution was washed with PBS, and the image of the stained cells was recorded by an optical microscope. The data were quantified using Image J software.
qRT-PCR
The mRNA in TPC-1 and IHH4 cells after transfection or PTX treatment was isolated with TRIzol (R0016, Beyotime). The miRNA in clinical tissues and TPC-1 and IHH4 cells was isolated by an EasyPure miRNA Kit (ER601-01, TRANS, Beijing, China). Then the cDNA was synthesized from the RNA using BeyoRT III cDNA synthesis regent (D7178L, Beyotime; for mRNA) and TransScript miRNA First-Strand cDNA Synthesis SuperMix (AT351-01, TRANS, for miRNA). After the mixture of 1 μl cDNA with 4 μl primers and 5 μl Supermix (AQ601-01, TransGen), the cDNA amplification was performed in a Q6 system (Applied Biosystems, CA, USA) following the instructions. The primers used in this assay were as follows: miR-144-5p-Forward (F): 5’-AATTAGATATCACGTCGTATCCAGT-3’, miR-144-5p-Reverse (R): 5’-CAGTGCGTGTCGTGGAGTC-3’; STON2-F: 5’-ACCATGTGATTGCCACCCAC-3’, STON2-R: 5’-AGCTCTCGGACTGGTCTGG-3’; GAPDH-F: 5’-ACAACTTTGGTATCGTGGAAGG-3’, GAPDH-R: 5’-GCCATCACGCCACAGTTTC-3’; U6-F: 5’-CTCGCTTCGGCAGCACA-3’, U6-R: 5’-AACGCTTCACGAATTTGCGT-3’.
Western blot assay
After transfection or PTX treatment, TPC-1 and IHH4 cells were lysed by NP-40 buffer (M052443, MREDA, Beijing, China) to collect the total protein from the cells. Then the concentration of the cells was determined by a microplate reader using a BCA kit (P0012, Beyotime). Then, 20 µg proteins were electrophoresed by SDS-PAGE gel (M052347, MREDA) and transferred onto the PVDF membrane (PALL-6054500, MREDA), which was further soaked in 5% nonfat milk for 2 h. Then, the membrane was incubated with the following primary antibodies at 4°C overnight, including those against STON2 (1:3000, ab121165, Abcam), MMP-9 (1:3000, 95kDa, ab73734, Abcam), E-cadherin (1:1000, #14,472, CST, Boston, Massachusetts, USA), N-cadherin (1:1500, ab18203, Abcam), and GAPDH (1:5000, ab8245, Abcam). On the second day, the membrane was incubated with the secondary antibodies against rabbit IgG (1:10,000, ab205718, Abcam) or mouse IgG (1:10,000, ab205719, Abcam) at room temperature for 2 h. Finally, the protein signal was measured by the Image Lab 3.0 (Bio-Rad, Hercules, California, USA) after the membrane was covered with a 200 μl detection solution (P0019, Beyotime).
Animal study
The animal study was performed following the existing reports [Citation17,Citation24]. Thirty male 6-week-old BALB/c nude mice with a body weight of 20 ± 2 g were acquired from ALF Biotechnology (Suzhou, China). The mice were fed in a specific pathogen-free (SPF) environment with a free diet and indicated temperature (22–25°C) under a light–dark cycle (12 h: 12 h). Every effort was made to minimize pain and discomfort to the animals. After adaptive feeding for 5 days, the right forelimb of all mice were injected subcutaneously with 100 μl PBS containing 3 × 10⁶ TPC-1 cells. After the tumor volume in the mice grew to about 5 mm3, the mice were then randomly divided into three groups, namely, the Control group (n = 10), the PTX group (n = 10), and the PTX+UTMD-M group (n = 10). Mice were group-housed, with 3 to 5 mice per cage. The mice in the Control group were intraperitoneally injected with 200 μl normal saline and 200 μl blank SonoVue microbubbles; the mice in the PTX group were intraperitoneally injected with 5 mg/kg PTX and 200 μl blank SonoVue microbubbles via tail vein; the mice in the PTX+UTMD-M group were intraperitoneally injected with 5 mg/kg PTX and injected 200 μl SonoVue microbubbles containing miR-144-5p mimic via tail vein. The tumor-bearing mice in the PTX+UTMD-M group received an ultrasound exposure, which was performed with an ultrasound transducer at an intensity of 2 W/cm2 for 3 min after the injection with PTX and microbubbles. All the treatments were performed every two days for 12 days and the volume of the tumor was also measured every two days. On day 12, the mice were sacrificed with cervical dislocation under anesthesia with 50 mg/kg sodium pentobarbital (B005, Jiancheng, Nanjing, China). Then, the tumor was taken out, photographed, weighed, and collected for later use. The volume was measured using the formula: tumor volume (mm3) = (major diameter) × (minor diameter)2 /2. Three researchers who were unaware of the grouping information evaluated each sample independently to minimize the effects of subjective bias.
Immunohistochemical assay
The mouse tumor tissues were fixed with paraformaldehyde fixative, incubated with xylene (M056094, MREDA, Beijing, China), and embedded into paraffin (M060593, MREDA). After the tissues were sectioned into 4-μm slices and dewaxed, they were repaired with antigen repair buffer (M052013, MREDA) and then incubated with the antibody against Ki67 (1:500, ab15580, Abcam) at 4°C overnight. The next day, the tissues were incubated with the rabbit IgG for 1 h and dyed with DAB buffer (SFQ004, 4A Biotech, Beijing, China), followed by being counterstained with hematoxylin (ab220365, Abcam) and incubation with gradient alcohol and xylene. Subsequently, the tissues were sealed by neutral gum (G8590, Solarbio, Beijing, China), and Ki67-positive cells was observed by an automatic DMLA microscope (Leica, Wetzlar, Germany).
Statistical analysis
The expression of miR-144-5p in the clinical tissues was analyzed using the paired-samples t test. Survival of patients was plotted according to the Kaplan–Meier method. One-way ANOVA was employed to analyze other data with Dunnett or Turkey test. All the analysis was performed with Graphpad 8.0 software. Statistical data were shown as mean ± SD. P < 0.05 meant that the data were statistically significant.
Results
MiR-144-5p was low-expressed in thyroid carcinoma
The data of thyroid carcinoma were downloaded from TCGA database and the differentially expressed miRNAs in thyroid carcinoma were analyzed. A total of 129 up-regulated miRNAs and 37 down-regulated miRNAs were identified (Supplementary Fig. S1). In addition, miR-144-5p was determined as a down-regulated miRNA (Supplementary Fig. S2). For verification, the expression of miR-144-5p in thyroid carcinoma tissues and cells were analyzed. As shown in , down-regulated miR-144-5p was observed in the thyroid carcinoma tissues and cells as compared to normal tissues or cells (P < 0.001). As the expression of miR-144-5p in the TPC-1 and IHH4 cells was relatively lower among other thyroid carcinoma cells, the two cells were chosen to perform the transfection assays. In , it was observed that compared to NC, the level of miR-144-5p in the two cells (TPC-1 and IHH4 cells) was up-regulated by miR-144-5p mimic (P < 0.001) and down-regulated by miR-144-5p inhibitor (P < 0.05).
Figure 1. MiR-144-5p was verified to be low-expressed in thyroid carcinoma.
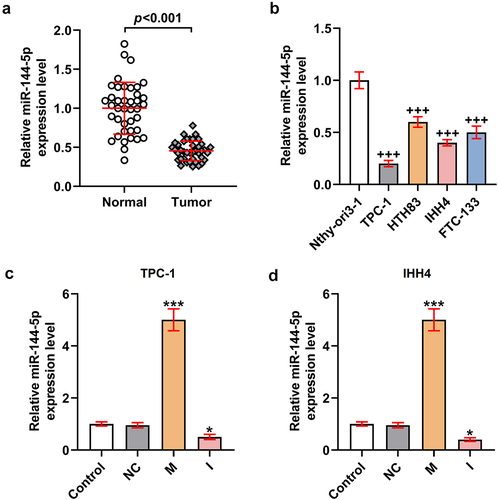
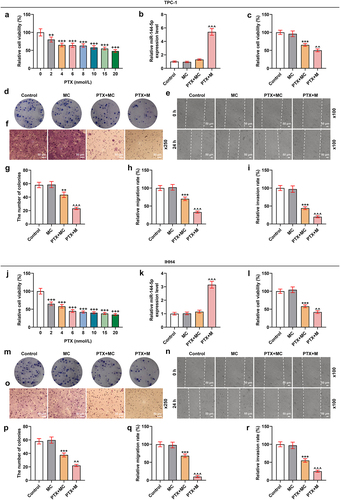
Figure 2. MiR-144-5p mimic suppressed the viability, proliferation, migration, and invasion of TPC-1 and IHH4 cells, and miR-144-5p caused the opposite results.
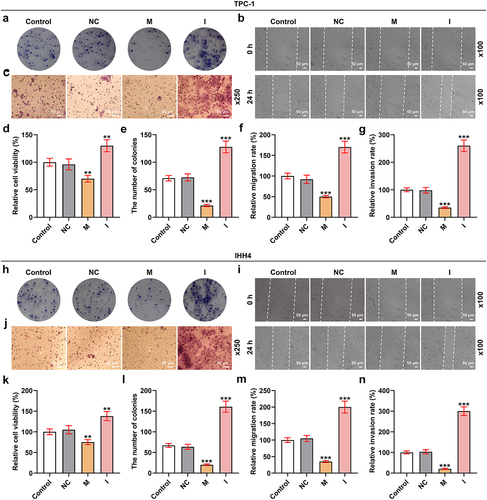
MiR-144-5p mimic suppressed the viability, proliferation, migration, and invasion of TPC-1 and IHH4 cells, while miR-144-5p inhibitor caused the opposite results
To investigate the function of miR-144-5p in thyroid carcinoma, the biological activities () of the TPC-1 and IHH4 cells were determined after overexpressing or silencing miR-144-5p expression. As exhibited in , the viability of the two cells was inhibited by miR-144-5p mimic but was promoted by miR-144-5p inhibitor (P < 0.01). The relative colony number of the two cells were also reduced by miR-144-5p mimic yet was increased by miR-144-5p inhibitor (P < 0.001; ). Meanwhile, the cell migration and invasion were decreased after the overexpression of miR-144-5p but was increased after the silence of miR-144-5p (P < 0.001; ). These results indicated that miR-144-5p regulated the viability, proliferation, migration, and invasion of thyroid carcinoma cells.
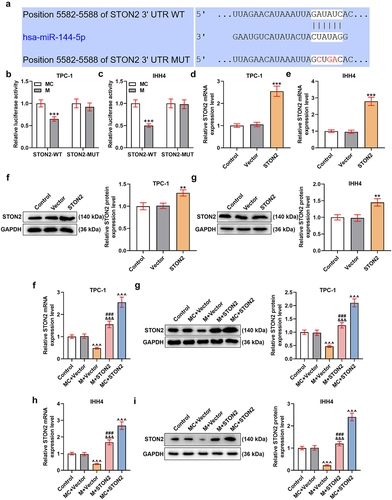
MiR-144-5p targeted STON2 and down-regulated the expression of STON2 in TPC-1 and IHH4 cells
As shown in supplementary Fig. S3, the STON2 was determined as an up-regulated gene, as compared to normal tissues (supplementary Fig. S3A, P < 0.001). Additionally, the expressions of miR-144-5p and STON2 showed negative correlation in the PTC tissues (supplementary Fig. S3B, P < 0.001). The binding sites existed between the sequence of miR-144-5p with STON2 (), which was further verified by the results of dual-luciferase reporter assay () showing that the luciferase activity of the cells transfected with STON2-WT and miR-144-5p mimic (P < 0.001) was reduced and no difference of luciferase activity of the cells transfected STON2-MUT and miR-144-5p mimic was discovered. The cells were then transfected with STON2 overexpression plasmids, and the efficiency was analyzed by qRT-PCR () and Western blot (). As shown in , the mRNA and protein expressions of STON2 in the cells were both promoted after transfection with STON2 overexpression plasmid (P < 0.01), indicating a successful transfection. Also, the effect of miR-144-5p on the STON2 expression was then examined (), and the data exhibited that the expression of STON2 was down-regulated by miR-144-5p mimic but was up-regulated by STON2 overexpression plasmids (P < 0.001). Moreover, the repressive effect of miR-144-5p mimic on STON2 expression was weakened by STON2 overexpression. All these results indicated that STON2 was a target gene of miR-144-5p and its level in TPC-1 and IHH4 cells was down-regulated by miR-144-5p mimic.
Figure 3. MiR-144-5p targeted STON2 and down-regulated the expression of STON2 in TPC-1 and IHH4 cells.
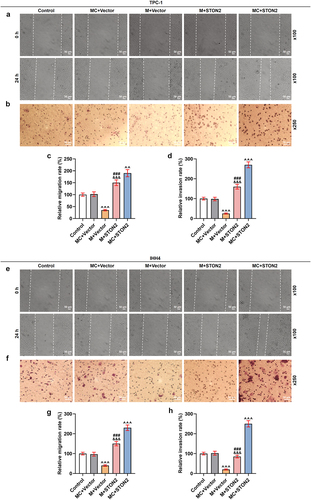
MiR-144-5p mimic weakened the promoting effect of STON2 overexpression on the migration and invasion of TPC-1 and IHH4 cells
The abilities of TPC-1 and IHH4 cells to migrate and invade were examined (). As presented in , the migration and invasion rates of the two cells were suppressed by miR-144-5p mimic (P < 0.001) but enhanced by STON2 overexpression (P < 0.01). In addition, the effects of STON2 overexpression on promoting migration and invasion of TPC-1 and IHH4 cells were weakened by miR-144-5p mimic. All these phenomena indicated that the inhibitory effect of miR-144-5p on thyroid carcinoma cells was realized by down-regulating STON2.
Figure 4. MiR-144-5p mimic weakened the promoting effect of STON2 overexpression on migration and invasion of TPC-1 and IHH4 cells.
MiR-144-5p mimic enhanced the inhibitory effects of PTX on the viability, proliferation, migration, and invasion of TPC-1 and IHH4 cells
After we discovered that the PTX at 2, 4, 6, 8, 10, and 20 nmol/l showed an inhibitory effect on TPC-1 (P < 0.01; ) and IHH4 cells (P < 0.001; ), 4 nmol/l PTX was chosen to treat the cells in later research. To investigate whether the effect of PTX on the cells was associated with miR-144-5p, the expression of miR-144-5p in the cells after PTX treatment was detected. As shown in , it could be found that the PTX had no effect on miR-144-5p expression. As for the biological activities of the cells, PTX inhibited the viability (), proliferation (), migration (), and invasion () of TPC-1 and IHH4 cells. Additionally, the suppressing effect of PTX on the biological activities of the cells was further enhanced by miR-144-5p overexpression, indicating that miR-144-5p promoted the inhibitory effect of PTX on thyroid carcinoma.
Figure 5. MiR-144-5p mimic enhanced the inhibitory effects of PTX on cell viability, proliferation, migration, and invasion of TPC-1 and IHH4 cells.
The effect of UTMD-mediated miR-144-5p overexpression on PTX-induced TPC-1 and IHH4 cells was stronger than liposome-mediated miR-144-5p overexpression
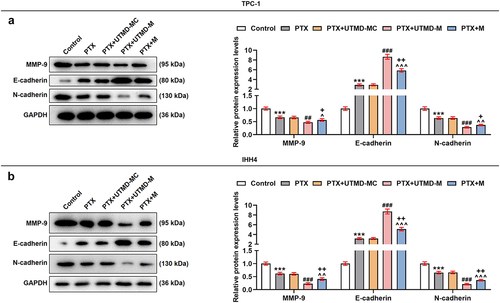
To further compare the effects of UTMD-mediated miR-144-5p overexpression and liposome-mediated miR-144-5p overexpression on the thyroid carcinoma cells, the microbubbles were prepared, as shown in . After the TPC-1 and IHH4 cells were treated with overexpressed miR-144-5p that mediated by UTMD and liposome, the expression of miR-144-5p was determined. As shown in , the expression of miR-144-5p was up-regulated by both UTMD-mediated and liposome-mediated transfection (P < 0.001), and the transfection efficiency of UTMD-mediated transfection was stronger than liposome-mediated transfection (P < 0.05). Then, the biological activities of the two cells were determined (). We also found that the proliferation (), and ), migration (), and invasion () of the cells were inhibited by PTX (P < 0.001), and the effect of PTX on inhibiting cell proliferation, migration, and invasion was enhanced by miR-144-5p overexpression (P < 0.001). Additionally, the effect of UTMD-mediated miR-144-5p overexpression was stronger than liposome-mediated miR-144-5p overexpression (P < 0.05). After that, we detected the expressions of migration- and invasion-related factors (), and observed that the expressions of MMP-9 and N-cadherin in the TPC-1 () and IHH4 () cells were down-regulated by PTX (P < 0.001), but the expression of E-cadherin was up-regulated by PTX (P < 0.001), and the effect of PTX on regulating the expression of these factors was enhanced by miR-144-5p overexpression (P < 0.001). We further detected that the enhancing effect of UTMD-mediated miR-144-5p overexpression was stronger than liposome-mediated miR-144-5p overexpression (P < 0.05).
Figure 6. The effect of UTMD-mediated miR-144-5p overexpression on the miR-144-5p expression, proliferation, and invasion of PTX-induced TPC-1 and IHH4 cells was stronger than liposome-mediated miR-144-5p overexpression.
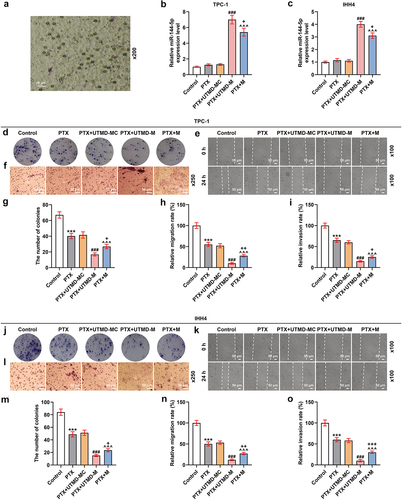
Figure 7. The effect of UTMD-mediated miR-144-5p overexpression on the miR-144-5p expression, proliferation, and invasion of PTX-induced TPC-1 and IHH4 cells was stronger than liposome-mediated miR-144-5p overexpression.
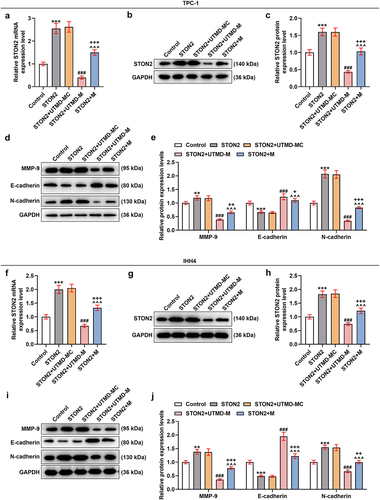
The effect of UTMD-mediated miR-144-5p overexpression on STON2-overexpressed TPC-1 and IHH4 cells was stronger than liposome-mediated miR-144-5p overexpression
Meanwhile, the effect of UTMD-mediated miR-144-5p overexpression on STON2-overexpressed TPC-1 and IHH4 cells was also examined. In , it was found that the expression of STON2 in the two cells was up-regulated by STON2 overexpression plasmids (P < 0.001), and that the effect of STON2 overexpression on up-regulating the expression of STON2 was weakened by miR-144-5p overexpression (P < 0.001). Furthermore, the weakening effect of UTMD-mediated miR-144-5p overexpression was stronger than that mediated by liposome (P < 0.001). The data also demonstrated that STON2 overexpression up-regulated MMP-9 and N-cadherin expression levels but down-regulated that of E-cadherin (P < 0.01; ). The effects of STON2 overexpression on these factors as such were diminished by miR-144-5p overexpression (P < 0.001). Furthermore, the diminishing effect of UTMD-mediated miR-144-5p overexpression was stronger than liposome-mediated miR-144-5p overexpression (P < 0.05).
Figure 8. The effect of UTMD-mediated miR-144-5p overexpression on STON2-overexpressed TPC-1 and IHH4 cells was stronger than liposome-mediated miR-144-5p overexpression.
UTMD-mediated miR-144-5p overexpression enhanced the inhibitory effects of PTX on the growth of subcutaneous xenotransplant tumor
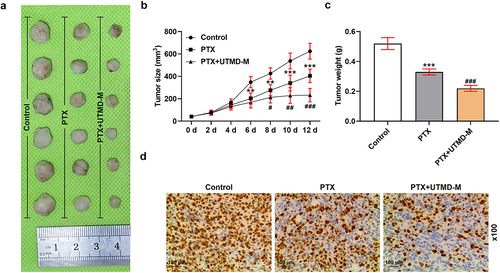
To further verify the inhibitory effects of miR-144-5p and PTX on thyroid carcinoma in vivo, the subcutaneous-xenotransplant tumor model was established. Generally, mice showed a good health status at the beginning of the experiment before the treatment. No adverse event was reported during the trials. After treatment for 12 days, the tumor tissues were collected (). The tumor volume () during the treatment and the tumor weight () on day 12 were recorded, both of which were inhibited by PTX treatment (P < 0.01; ), and such inhibitory effects of PTX were further enhanced by UTMD-mediated miR-144-5p overexpression (P < 0.01). We also determined the expression of Ki67 in the tumor tissues by immunohistochemical assay to evaluate the growth of the tumor (), and found that the level of Ki67 in the tumor tissue was down-regulated by PTX treatment, and that the repressive effect of PTX on Ki67 expression was further enhanced by UTMD-mediated miR-144-5p overexpression.
Figure 9. UTMD-mediated miR-144-5p overexpression enhanced the inhibitory effects of PTX on the growth of subcutaneous-xenotransplant tumor.
Discussion
The current study was the first to discover that miR-144-5p was low-expressed in thyroid carcinoma and its overexpression inhibited the proliferation, migration, and invasion of thyroid carcinoma cells. STON2 was targeted by miR-144-5p and its expression was down-regulated by miR-144-5p, in addition to the suggestion that STON2 overexpression promoted the migration and invasion of thyroid carcinoma cells. Meanwhile, the suppressive effects of PTX on thyroid carcinoma in vitro and in vivo were detected and were enhanced by miR-144-5p overexpression. Furthermore, the effect of UTMD-mediated miR-144-5p overexpression on enhancing the inhibitory effects of PTX in thyroid carcinoma was stronger than liposome-mediated miR-144-5p overexpression. Our research, as such, provided two novel biomarkers for basic study and clinical treatment on thyroid carcinoma.
After analyzing the differentially expressed miRNAs in thyroid carcinoma, miR-144-5p was identified as the subject miRNA in this study. Previous research only detected a lower expression of miR-144-5p in non-small cell lung cancer [Citation25,Citation26]. In this study, low-expressed miR-144-5p was discovered in thyroid carcinoma for the first time. A previous research published by Lu et al. proved that miR-144-5p suppressed the proliferation of non-small cell lung cancer cells [Citation25]. Similarly, the inhibiting effects of miR-144-5p on the proliferation, migration, and invasion of the thyroid carcinoma cells were found in this study. It is widely known that miRNAs can bind with the 3’-UTR of mRNA and then target mRNAs to exert its regulatory effect on cancers [Citation25]. To investigate the downstream mechanism of miR-144-5p in thyroid carcinoma, the gene STON2 was predicted and verified to be the target of miR-144-5p in thyroid carcinoma cancer cells. STON2, an endocytic sorting adaptor, is previously reported to regulate the development of several cancers. For instance, STON2 expression is found to be promoted in the ovarian cancer tissues and cells, and a high level of STON2 was correlated with a poor prognosis of patients with ovarian cancer [Citation27]. Overexpression of STON2 enhances the proliferation of breast cancer cells [Citation28]. Furthermore, overexpression of STON2 correlates with PTC progression and a poor prognosis of patients, and promotes the migration, and invasion of PTC cells [Citation29]. Consistently, in the present study, STON2 overexpression increased the abilities of thyroid carcinoma cells to migrate and invade, but such a promoting effect was weakened by miR-144-5p overexpression, indicating that miR-144-5p could target STON2 to regulate the development of thyroid carcinoma.
Although the anti-cancer effects of PTX on cancers such as breast cancer, prostate cancer, gastric cancer, non-small cell lung cancer, and ovarian cancer [Citation5–10] were widely researched, the specific role of PTX on thyroid carcinoma remained rarely reported. Similar with the effect on other cancer cells, the inhibitory of PTX on the biological activities of proliferation, migration, and invasion of thyroid carcinoma was confirmed in this study. The anti-tumor effect of PTX on cervical cancer is reported to be enhanced by miR-34a 17, and in this study, we found that the anti-tumor effect of PTX on thyroid carcinoma was promoted by miR-144-5p. A great number of studies have demonstrated the main function of PTX is to attenuate the proliferation by inhibiting cell cycle and lead to apoptosis [Citation30–34]. MiR-144-5p has also been linked to negative feedback control of the cell cycle, including cell cycle arrest and apoptosis of tumor and normal cells. It has been reported that a number of cell cycle regulators were found to be targeted by miR-144-5p [Citation35]. In tumor cells, overexpression of miR-144-5p arrested cell cycle and promoted apoptosis in non-small cell lung cancer (NSCLC) cells [Citation36], and esophageal cancer cells [Citation37]. The BC patients with high expressions of cell cycle-related genes (CCNE1 or CCNE2), as direct targets of miR-144-5p, had unfavorable prognosis [Citation38]. In normal cells, upregulation of miR-144-5p could significantly inhibit cell proliferation and provoke apoptosis in HUVECs [Citation39]. Overexpression of miR-144-5p could significantly reverse the overexpression of OIP5-AS1-induced inhibitory effect on cisplatin-induced apoptosis of renal epithelial cells [Citation40]. Thus, the anti-tumor effect of PTX on thyroid carcinoma promoted by miR-144-5p might be associated with their roles in inhibition of cell cycle and induction of apoptosis. This topic would be explored in the future research.
Transfection methods, such as liposome-mediated, calcium-phosphate-mediated, and nanostructure-mediated transfection, were applied in treatment, and among these methods, liposome-mediated transfection is the most widely used method [Citation18,Citation41–43]. In recent decades, UTMD-mediated transfection has been increasingly considered as an effective method for transfection or drug delivery [Citation19]. Despite the efforts that have been made to investigate the performance of UTMD in transfection with its low toxicity, low immunogenicity, and easy operation, further study is still needed to ensure its effectiveness. Therefore, we employed both liposome and UTMD to evaluate the transfection efficiency of liposome-mediated and UTMD-mediated miR-144-5p overexpression, and discovered that the UTMD-mediated miR-144-5p overexpression had a stronger enhancing effect on the inhibition of PTX in biological activities in thyroid carcinoma cells than liposome-mediated miR-144-5p overexpression. Also, the UTMD-mediated miR-144-5p overexpression also had a stronger weakening effect on the facilitation of STON2 in biological activities in thyroid carcinoma cells than liposome-mediated miR-144-5p overexpression, indicating the effect of UTMD-mediated transfection was higher than liposome-mediated transfection.
To further verify the inhibitory effect of PTX and miR-144-5p in thyroid carcinoma and the enhancing effect of miR-144-5p on the anti-thyroid carcinoma of PTX in animal experiments, the subcutaneous-xenotransplant tumor mice model was established. We discovered that PTX inhibited the volume and weight of tumor tissues and the expression of Ki67, a cell proliferation marker in tumors [Citation44], showing that PTX inhibited the growth of subcutaneous-xenotransplant tumor. In addition, the UTMD-mediated miR-144-5p overexpression enhanced the anti-thyroid carcinoma effect of PTX, further supporting the discoveries of the cell experiments. However, further exploration is needed to be performed. The role of STON2 downregulation in PTX resistance using PTX resistant cell lines would be tested in future research. Besides, the mechanism underlying the downregulation of miR-144-5p is also needed to be explored in samples of patients with PTC. Long-chain non-coding RNAs (lncRNAs) are important components of non-coding RNAs with more than 200 nucleotides in length and lack protein coding function but can regulate different processes in eukaryotic cells [Citation45]. LncRNAs act as competing endogenous RNA (ceRNAs) to inhibit the function of miRNAs [Citation46]. Chang et al. reported lncRNA OIP5-AS1 could regulate miR-144-5p expression in renal epithelial cells [Citation40]. Furthermore, lncRNA LINC01969 regulates the miR-144-5p/LARP1 axis in ovarian cancer as a competing endogenous RNA [Citation47]. Thus, the mechanism of miR-144-5p downregulation in PTC patient samples may be involved with lncRNAs.
In a word, UTMD-mediated miR-144-5p overexpression enhances the anti-tumor effect of PTX on thyroid carcinoma by targeting STON2. Our research provides a novel biomarker for basic study and UTMD-mediated miR-144-5p delivery may be a novel molecular targeted therapy for the treatment of thyroid carcinoma.
Supplemental Material
Download Zip (2.4 MB)Disclosure statement
No potential conflict of interest was reported by the author(s).
Supplementary material
Supplemental data for this article can be accessed here.
Additional information
Funding
Related Research Data
References
- Deeken-Draisey A, Yang GY, Gao J, et al. Anaplastic thyroid carcinoma: an epidemiologic, histologic, immunohistochemical, and molecular single-institution study. Hum Pathol. 2018;82:140–148.
- Lu YT, Huang HI, Yang AH, et al. Thyroid carcinoma with rhabdoid phenotype: case report with review of the literature. Auris Nasus Larynx. 2016;43(6):706–709.
- Filetti S, Durante C, Hartl D, et al. Thyroid cancer: ESMO clinical practice guidelines for diagnosis, treatment and follow-up†. Ann Oncol. 2019;30(12):1856–1883.
- Zhao J, Xu C, Yao J, et al. Statins and thyroid carcinoma: a meta-analysis. Cell Physiol Biochem. 2018;47(4):1422–1431.
- Cong Y, Cui Y, Zhu S, et al. Tim-3 promotes cell aggressiveness and paclitaxel resistance through NF-κB/STAT3 signalling pathway in breast cancer cells. Chin J Cancer Res. 2020;32(4):564–579.
- Okunaka M, Kotani D, Demachi K, et al. Retrospective cohort study of nanoparticle albumin-bound paclitaxel plus ramucirumab versus paclitaxel plus ramucirumab as second-line treatment in patients with advanced gastric cancer. BMC Cancer. 2020;20(1):1111.
- Pan B, Li P, Chen J, et al. Study on the effect and mechanism of paclitaxel-succini acid drug-loaded nanofibers in treating lung cancer. J Nanosci Nanotechnol. 2021;21(2):909–913.
- Roviello G, Ramello M, Catalano M, et al. Association between neutropenia and survival to nab-paclitaxel and gemcitabine in patients with metastatic pancreatic cancer. Sci Rep. 2020;10(1):19281.
- Wang Z, Dong J, Zhao Q, et al. Gold nanoparticle‑mediated delivery of paclitaxel and nucleic acids for cancer therapy (Review). Mol Med Rep. 2020;22(6):4475–4484.
- Zhou M, Han S, and An F. Recent advances on paclitaxel-based self-delivery nanomedicine for cancer therapy. Curr Med Chem. 2020;28(31): 6358–6374 .
- Pushkarev VV, Starenki DV, Pushkarev VM, et al. Inhibitor of the transcription factor NF-κB, DHMEQ, enhances the effect of paclitaxel on cells of anaplastic thyroid carcinoma in vitro and in vivo. Ukrainian biochemical journal. 2015;87(3):63–74
- Xu G, Pan J, Martin C, et al. Angiogenesis inhibition in the in vivo antineoplastic effect of manumycin and paclitaxel against anaplastic thyroid carcinoma. J Clin Endocrinol Metab. 2001;86(4):1769–1777.
- Pushkarev VM, Starenki DV, Saenko VO, et al. Effects of paclitaxel and combination of the drug with radiation therapy in an in vivo model of anaplastic thyroid carcinoma. Exp Oncol. 2011;33(1):24–27.
- Ito Y, Higashiyama T, Hirokawa M, et al. Clinical trial of weekly paclitaxel chemotherapy for papillary thyroid carcinoma with squamous cell carcinoma component. Endocr J. 2012;59(9):839–844.
- Milošević Z, Banković J, Dinić J, et al. Potential of the dual mTOR kinase inhibitor AZD2014 to overcome paclitaxel resistance in anaplastic thyroid carcinoma. Cell Oncol (Dordr). 2018;41(4):409–426.
- Qin D, Li H, Xie H. Ultrasoundtargeted microbubble destructionmediated miR205 enhances cisplatin cytotoxicity in prostate cancer cells. Mol Med Rep. 2018;18(3):3242–3250.
- Yu J, Zhao Y, Liu C, et al. Synergistic anti-tumor effect of paclitaxel and miR-34a combined with ultrasound microbubbles on cervical cancer in vivo and in vitro. Clinical & translational oncology: official publication of the Federation of Spanish Oncology Societies and of the National Cancer Institute of Mexico. 2020;22(1):60–69.
- Wang Y, Li X, Liu L, et al. Tissue targeting and ultrasound-targeted microbubble destruction delivery of plasmid DNA and transfection in vitro. Cell Mol Bioeng. 2020;13(1):99–112.
- Wu J, Li RK. Ultrasound-targeted microbubble destruction in gene therapy: a new tool to cure human diseases. Genes Dis. 2017;4(2):64–74.
- Chen S, Grayburn PA. Ultrasound-targeted microbubble destruction for cardiac gene delivery. Methods Mol Biol. 2017;1521:205–218.
- Huang S, Ren Y, Wang X, et al. Application of ultrasound-targeted microbubble destruction-mediated exogenous gene transfer in treating various renal diseases. Hum Gene Ther. 2019;30(2):127–138.
- Shi D, Guo L, Sun X, et al. UTMD inhibit EMT of breast cancer through the ROS/miR-200c/ZEB1 axis. Sci Rep. 2020;10(1):6657.
- Liu YM, Li XF, Liu H, et al. Ultrasound-targeted microbubble destruction-mediated downregulation of CD133 inhibits epithelial-mesenchymal transition, stemness and migratory ability of liver cancer stem cells. Oncol Rep. 2015;34(6):2977–2986.
- Jing C, Gao Z, Wang R, et al. Lenvatinib enhances the antitumor effects of paclitaxel in anaplastic thyroid cancer. Am J Cancer Res. 2017;7(4):903–912.
- Lu M, Xiong H, Xia ZK, et al. circRACGAP1 promotes non-small cell lung cancer proliferation by regulating miR-144-5p/CDKL1 signaling pathway. Cancer Gene Ther. 2020;28(3–4):197–211.
- Song L, Peng L, Hua S, et al. miR-144-5p enhances the radiosensitivity of non-small-cell lung cancer cells via targeting ATF2. Biomed Res Int. 2018;2018:5109497.
- Sun X, Zhang W, and Li H, et al. Stonin 2 overexpression is correlated with unfavorable prognosis and tumor invasion in epithelial ovarian cancer. Int J Mol Sci. 2017;18(8):1653.
- Wang Q, Xue J, Ren Q, et al. Long-chain non-coding RNA GACAT1 promotes development and progression of breast cancer by targeting microRNA-875-3p. Oncol Lett. 2020;19(3):2547–2553.
- Ren L, Xu Y, Qin G, et al. miR-199b-5p-Stonin 2 axis regulates metastases and epithelial-to-mesenchymal transition of papillary thyroid carcinoma. IUBMB Life. 2019;71(1):28–40.
- Li G, Xu D, Sun J, et al. Paclitaxel inhibits proliferation and invasion and promotes apoptosis of breast cancer cells by blocking activation of the PI3K/AKT signaling pathway. Adv Clin Exp Med. 2020;29(11):1337–1345.
- Doğan ŞZ, Balci Okcanoğlu T, Biray AÇ, et al. Investigation of the synergistic effects of paclitaxel and herbal substances and endemic plant extracts on cell cycle and apoptosis signal pathways in prostate cancer cell lines. Gene. 2019;687:261–271.
- Palladino G, Notarangelo T, Pannone G, et al. TRAP1 regulates cell cycle and apoptosis in thyroid carcinoma cells. Endocr Relat Cancer. 2016;23(9):699–709.
- Gu F, Li L, Yuan QF, et al. Down-regulation of survivin enhances paclitaxel-induced Hela cell apoptosis. Eur Rev Med Pharmacol Sci. 2017;21(15):3504–3509.
- Speyer CL, Bukhsh MA, Jafry WS, et al. Riluzole synergizes with paclitaxel to inhibit cell growth and induce apoptosis in triple-negative breast cancer. Breast Cancer Res Treat. 2017;166(2):407–419.
- Gao Z, Liu R, Liao J, et al. Possible tumor suppressive role of the miR-144/451 cluster in esophageal carcinoma as determined by principal component regression analysis. Mol Med Rep. 2016;14(4):3805–3813.
- Lu M, Xiong H, Xia ZK, et al. circRACGAP1 promotes non-small cell lung cancer proliferation by regulating miR-144-5p/CDKL1 signaling pathway. Cancer Gene Ther. 2021;28(3–4):197–211.
- Gao Z, Zhang P, Xie M, et al. miR-144/451 cluster plays an oncogenic role in esophageal cancer by inhibiting cell invasion. Cancer Cell Int. 2018;18(1):184.
- Matsushita R, Seki N, Chiyomaru T, et al. Tumour-suppressive microRNA-144-5p directly targets CCNE1/2 as potential prognostic markers in bladder cancer. Br J Cancer. 2015;113(2):282–289.
- Fu W, Liu Z, Zhang J, et al. Effect of miR-144-5p on the proliferation, migration, invasion and apoptosis of human umbilical vein endothelial cells by targeting RICTOR and its related mechanisms. Exp Ther Med. 2020;19(3):1817–1823.
- Chang S, Chang M, Liu G, et al. LncRNA OIP5-AS1 reduces renal epithelial cell apoptosis in cisplatin-induced AKI by regulating the miR-144-5p/PKM2 axis. Biomed J. 2021. https://doi.org/10.1016/j.bj.2021.07.005.
- Bertrand N, Wu J, Xu X, et al. Cancer nanotechnology: the impact of passive and active targeting in the era of modern cancer biology. Adv Drug Deliv Rev. 2014;66:2–25.
- Saw PE, Xu X, Zhang M, et al. Nanostructure engineering by simple tuning of lipid combinations. Angew Chem Int Ed Engl. 2020;59(15):6249–6252.
- Sun W, Li Z, Zhou X, et al. Efficient exosome delivery in refractory tissues assisted by ultrasound-targeted microbubble destruction. Drug Deliv. 2019;26(1):45–50.
- Meng X, Sun R, and Wang W, et al. ADFP promotes cell proliferation in lung adenocarcinoma via Akt phosphorylation. J Cell Mol Med. 2020;25(2): 827–839 .
- Jarroux J, Morillon A, Pinskaya M. History, discovery, and classification of lncRNAs. Adv Exp Med Biol. 2017;1008:1–46.
- Fang Y, Fullwood MJ. Roles, functions, and mechanisms of long non-coding RNAs in cancer. Genomics Proteomics Bioinformatics. 2016;14(1):42–54.
- Chen J, Li X, Yang L, et al. Long non-coding RNA LINC01969 promotes ovarian cancer by regulating the miR-144-5p/LARP1 axis as a competing endogenous RNA. Front Cell Dev Biol. 2020;8:625730.