
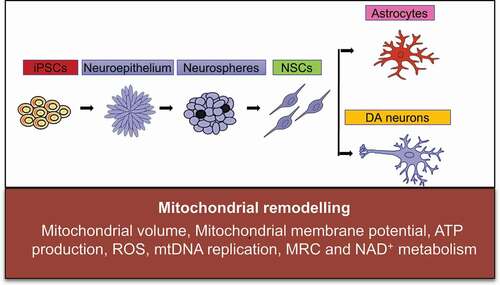
ABSTRACT
We showed previously that POLG mutations cause major changes in mitochondrial function, including loss of mitochondrial respiratory chain (MRC) complex I, mitochondrial DNA (mtDNA) depletion and an abnormal NAD+/NADH ratio in both neural stem cells (NSCs) and astrocytes differentiated from induced pluripotent stem cells (iPSCs). In the current study, we looked at mitochondrial remodeling as stem cells transit pluripotency and during differentiation from NSCs to both dopaminergic (DA) neurons and astrocytes comparing the process in POLG-mutated and control stem cells. We saw that mitochondrial membrane potential (MMP), mitochondrial volume, ATP production and reactive oxygen species (ROS) changed in similar ways in POLG and control NSCs, but mtDNA replication, MRC complex I and NAD+ metabolism failed to remodel normally. In DA neurons differentiated from NSCs, we saw that POLG mutations caused failure to increase MMP and ATP production and blunted the increase in mtDNA and complex I. Interestingly, mitochondrial remodeling during astrocyte differentiation from NSCs was similar in both POLG-mutated and control NSCs. Further, we showed downregulation of the SIRT3/AMPK pathways in POLG-mutated cells, suggesting that POLG mutations lead to abnormal mitochondrial remodeling in early neural development due to the downregulation of these pathways.
Introduction
Mitochondria play pivotal roles in diverse cellular functions, from energy generation to redox homeostasis, cell cycle regulation and apoptosis. Mitochondria are highly dynamic. They remodel the morphology related to their functionality. Recently, mitochondria have been shown to exhibit peculiar features in pluripotent stem cells [Citation1]. Moreover, an extensive restructuring of mitochondria has been observed during cellular reprogramming from the conversion of somatic cells into iPSCs and differentiation of iPSCs into neuronal cells [Citation1–3]. These transformation events impact mitochondrial number, morphology, activity, cellular metabolism and mtDNA integrity [Citation4–6]. Differentiating human iPSCs into neural progenitors is associated with the metabolic switch from glycolysis to oxidative phosphorylation (OXPHOS) and is correlated with an increase in the number of mitochondria [Citation7,Citation8]. Mitochondria play an important role in regulation of stem cell homeostasis and differentiation [Citation9].
Human iPSCs retain the capacity for indefinite self-renewal and to give rise to virtually any cell type. Yamanaka showed that overexpression of specific combinations of different pluripotency-related oncogenic transcription factors (OCT4, SOX2, NANOG, MYC and LIN28) could initiate the molecular circuitry of pluripotency and convert human fibroblasts into iPSCs, opening new opportunities for drug discovery approaches and stem cell-based therapies [Citation10–12]. This technique allows researchers to generate pluripotent cells from various human tissue sources with diverse genetic backgrounds and disease states in order to model a disease in vitro [Citation12].
Mutations in POLG gene disrupt mtDNA replication and cause devastating diseases, often with neurological phenotypes [Citation13,Citation14]. Pathological and molecular studies performed in our group have revealed some of the mechanisms involved in POLG disease affecting the brain. At the molecular level, mutations in POLG lead to mtDNA maintenance defects and mitochondrial dysfunction [Citation15,Citation16]. Previously, we have generated iPSCs from both healthy and patient fibroblasts carrying POLG mutations and differentiated these iPSCs into diverse lineages, including NSCs [Citation17], glial astrocytes [Citation18] and DA neurons [Citation19]. We have demonstrated the mitochondrial changes in POLG patient iPSC-derived cells; however, the mitochondrial reprogramming and metabolic changes during these differentiations in these POLG cells remain largely unknown.
Thus, this study aimed to investigate how mitochondrial remodeling and metabolic reprogramming that occurs during neural and glial astrocyte differentiation of iPSCs is influenced by the presence of POLG mutations that disrupt mtDNA homeostasis and respiratory chain function. We differentiated iPSCs with POLG mutations (one homozygous c.2243 G > C, p.W748S/W748S and one compound heterozygous c.1399 G > A/c.2243 G > C, p.A467T/W748S) into NSCs and further differentiated NSCs into DA neurons and glial astrocytes. Specifically, we investigated how mitochondrial remodeling during neural and glial astrocyte differentiation from iPSCs is affected by the presence of dysfunctional mitochondria via examining multiple mitochondrial parameters including mitochondrial volume, MMP, ATP production, ROS, mtDNA replication, MRC complexes and NAD+ metabolism during the conversion from iPSCs to NSCs and then from NSCs to neurons and astrocytes. Overall, our findings showed that mutations of POLG lead to an abnormal modulation of mitochondrial remodeling and NAD+ metabolism reprogramming via SIRT3/AMPK inhibition in early neural fate, which may contribute to pathogenesis in POLG-related diseases. In addition, activation of the SIRT3/AMPK pathway could provide a potential treatment for POLG patients.
Materials and methods
Ethics approval
This project was approved by the Western Norway Committee for Ethics in Health Research (REK nr. 2012/919).
Generation of iPSCs and differentiation of NSCs, DA neutrons and astrocytes
The fibroblasts from one homozygous c.2243 G > C, p.W748S/W748S (WS5A) and one compound heterozygous c.1399 G > A/c.2243 G > C, p.A467T/W748S (CP2A) patient were collected by punch biopsy. Detroit 551 fibroblasts (ATCC® CCL 110TM) and AG05836B fibroblasts (RRID: CVCL_2B58) were used as control lines. The generation and maintenance of iPSCs were described previously [Citation17,Citation19]. NSCs and DA neurons were differentiated according to the protocols described previously [Citation17,Citation19]. Astrocytes were differentiated from NSCs according to the protocol described previously [Citation18].
Immunofluorescence staining
Cells were fixed with 4% (v/v) paraformaldehyde (PFA) and blocked using blocking buffer containing 1× PBS and 10% (v/v) normal goat serum (Sigma-Aldrich) with 0.3% (v/v) Triton™ X-100 (Sigma-Aldrich). The cells were stained with primary antibody overnight at 4°C and then incubated with secondary antibody (1:800 in blocking buffer) for 1 hour at room temperature (RT). Detailed information of the antibodies used is provided in Supplementary Table 1.
Transmission electron microscopy (TEM)
Cells were fixed with 4% glutaraldehyde and postfixed with 1% OsO4 in 0.1 mol/L cacodylate buffer containing 0.1% CaCl2 at 4°C for 2 hours. Samples were stained with 1% Millipore-filtered uranyl acetate, dehydrated in increasing concentrations of ethanol and infiltrated and embedded in epoxy resin. Ultrathin sections were cut and stained with uranyl acetate and lead citrate. Electron photomicrographs were obtained using a transmission electron microscope (JEM-1230, JEOL) [Citation20].
Flow cytometric analysis of mitochondrial volume and MMP
Cells were stained with 100 nM Tetramethylrhodamine ethyl ester (TMRE) (Invitrogen) and 150 nM MitoTracker Green (MTG) (Invitrogen) for 45 minutes at 37°C. Cells treated with 100 µM FCCP (Abcam) were used as a negative control. Stained cells were detached with TrypLE™ Express Enzyme (Thermo Fisher Scientific) and analyzed on a FACS BD Accuri™ C6 flow cytometer (BD Biosciences). The data analysis was performed using Accuri™ C6 Software (BD Biosciences) [Citation17,Citation19,Citation21].
ATP generation assay
The Luminescent ATP Detection Assay Kit (Abcam) was used to investigate intracellular ATP production. Cells were cultured in a Corning® 96-well flat, clear bottom, white wall plate (Life Sciences), and ATP measurements were performed according to the manufacturer’s protocol when the cells had reached 90% confluence. The kit irreversibly inactivates ATP-degrading enzymes (ATPases) during the lysis step and measures the luminescence signal corresponding to the endogenous levels of ATP. Three replicates were measured for each sample. Luminescence intensity was monitored using the Victor® XLight Multimode Plate Reader (PerkinElmer). To normalize the value with the cell number, cells grown on the same 96-well plates were incubated with Janus Green cell normalization stain according to the manufacturer’s instructions (Abcam). OD 595 nm was measured using the Labsystems Multiskan® Bichromatic plate reader (Titertek Instruments, USA).
Intracellular ROS production
Intracellular ROS production was measured by flow cytometry using dual staining of 30 µM 2’,7’, -dichlorodihydrofluorescein diacetate (DCFDA) (Abcam) and 150 nM MitoTracker Deep Red (MTDR) (Invitrogen), which enabled us to assess the ROS level related to the mitochondrial volume. Stained cells were detached with TrypLE™ Express Enzyme and neutralized with media containing 10% FBS. The cells were immediately analyzed on a FACS BD Accuri™ C6 flow cytometer. The data analysis was performed using Accuri™ C6 Software (BD Biosciences). The gating strategies are given in Figure S1.
Flow cytometric measurement of mitochondrial transcription factor A (TFAM) and MRC complex I levels
Cells were detached with TrypLE™ Express Enzyme, pelleted and fixed in 1.6% (v/v) PFA at RT for 10 minutes before permeabilization with ice-cold 90% methanol. The cells were blocked using a buffer containing 0.3 M glycine, 5% goat serum and 1% bovine serum albumin (BSA) in 1× PBS. For TFAM expression, cells were stained separately with TFAM and TOMM20 conjugated to Alexa Fluor® 488. For MRC complex I staining, primary antibody anti-NDUFB10 was added, followed by secondary antibody incubation. The cells were immediately analyzed on a FACS BD Accuri™ C6 flow cytometer.
Quantitative real-time PCR (qRT-PCR) analysis for mtDNA copy number
DNA was extracted using a QIAGEN DNeasy Blood and Tissue Kit (QIAGEN) according to the manufacturer’s protocol. Quantification of mtDNA copy number was performed using qRT-PCR. The ND1 gene fragment of the mitochondrial genome was amplified from all the individuals using the primer ND1-F (5’-CCCTAAAACCCGCCACATCT-3’) and ND1-R (5’-GAGCGATGGTGAGAGCTAAGGT-3’). The APP gene fragment of the nuclear genome was amplified from all the individuals using the primer APP-F (5’-TGTGTGCTCTCCCAGGTCTA-3’) and APP-R (5’-CAGTTCTGGTCACTGG-3’). QRT-PCR was performed with an initial denaturation step of 95°C for 20 sec, then 95°C denaturation for 3 sec, followed by primer and probe hybridization and DNA synthesis at 60°C for 30 sec; the last two steps were repeated for 40 cycles. The reaction was measured using the ABI 7500 Fast Real-Time PCR system (Applied Biosystems, USA).
NADH metabolism measurement using liquid chromatography-mass spectrometry (LC-MS) analysis
Cells were washed with PBS and extracted by addition of ice-cold 80% methanol followed by incubation at 4°C for 20 min. Thereafter, the samples were detached by scraping before being stored at −80°C overnight. The following day, the samples were thawed on a rotating wheel at 4°C and subsequently centrifuged at 16,000 g at 4°C for 20 min. The supernatant was added to 1 volume of acetonitrile, and the samples were stored at −80°C until analysis. The pellet was dried and subsequently reconstituted in a lysis buffer (20 mM Tris-HCl (pH 7.4), 150 mM NaCl, 2% SDS, 1 mM EDTA) to allow the protein determination with BCA assay.
Separation of the metabolites was achieved with a ZIC-pHILC column (150 x 4.6 mm, 5 μm; Merck) in combination with the Dionex UltiMate 3000 (Thermo Fisher Scientific) liquid chromatography system. The column was kept at 30°C. The mobile phase consisted of 10 mM ammonium acetate pH 6.8 (Buffer A) and acetonitrile (Buffer B). The flow rate was kept at 400 µL/min, and the gradient was set as follows: 0 min 20% Buffer B, 15 min to 20 min 60% Buffer B and 35 min 20% Buffer B. Ionization was subsequently achieved by heated electrospray ionization facilitated by the HESI-II probe (Thermo Fisher Scientific) using the positive ion polarity mode and a spray voltage of 3.5 kV. The sheath gas flow rate was 48 units with an auxiliary gas flow rate of 11 units and a sweep gas flow rate of 2 units. The capillary temperature was 256°C, and the auxiliary gas heater temperature was 413°C. The stacked-ring ion guide (S-lens) radio frequency (RF) level was at 90 units. Mass spectra were recorded with the Q Exactive mass spectrometer (Thermo Fisher Scientific), and data analysis was performed with the Thermo Xcalibur Qual Browser. Standard curves generated for NAD+ and NADH were used as references for metabolite quantification.
Western blotting
The protein was extracted using 1X RIPA extraction buffer (Thermo Fisher Scientific) supplemented with protease inhibitor cocktail (Thermo Fisher Scientific) and phosphatase inhibitor cocktail (Thermo Fisher Scientific). The protein concentration was measured using a Pierce™ BCA Protein Assay Kit (Thermo Fisher Scientific). The cell protein was loaded into NuPAGE™ 4–12% Bis-Tris Protein Gels (Invitrogen) and resolved in the PVDF membrane (BioRad) using the Trans-Blot® Turbo™ transfer system (BioRad). The membranes were blocked with 5% nonfat dry milk or 5% BSA in TBST for 1 hour at RT. Membranes were then incubated overnight at 4°C with primary antibodies. After washing with TBST three times, the membranes were incubated with donkey anti-mouse antibody or swine anti-rabbit antibody conjugated to horseradish peroxidase secondary for 1 hour at RT. The Super Signal West Pico Chemiluminescent Substrate Kit (Thermo Fisher Scientific) was used, and the membranes were visualized using ChemiDoc imaging systems (BioRad). Further details of the used antibodies are provided in Supplementary Table 1.
Statistical analyses
All data are expressed as mean ± standard error of the mean (SEM) for the number of samples (n ≥ 3). Detailed information of the biological and technical replicates is provided in Supplemental Table 2. Statistical analyses were performed using GraphPad Prism 8.0.2 software (GraphPad Software) using the Mann-Whitney U test. Significance is denoted for P values of less than 0.05.
Results
Mitochondrial reprogramming during the conversion of iPSCs into NSCs
We used iPSCs generated from two patient cell lines carrying founder POLG mutations, one carrying homozygous for c.2243 G > C, p.W748S (WS5A), and one compound heterozygous c.1399 G > A/c.2243 G > C, p.A467T/W748S (CP2A). Two normal human cell lines, Detroit 551 and AG05836B, were used for disease-free controls.
In order to compare mitochondrial reprogramming in the early neural induction phase, we differentiated NSCs from both control and patient iPSCs using a dual SMAD protocol () as previously described [Citation17]. Both sets of iPSCs exhibited typical ESC-like colony morphology with a sharp cell border (, a). TEM of mitochondria revealed a round mitochondrial organelle structure with a double membrane and organized cristae (, b) in iPSCs. Immunofluorescence staining of iPSCs showed positive expressions of key pluripotent markers SOX2 , OCT4 and NANOG (Figure S2). The iPSC-derived NSCs showed a clear neural progenitor appearance in the bright field microscopy (, c) and an elongated mitochondrial structure under TEM (, d). Immunofluorescence staining of NSCs showed positive expressions of key neural progenitor marker NESTIN (red) (, e) and SOX2 (green) (, f).
Figure 1. Mitochondrial reprogramming during the conversion of iPSCs into NSCs.
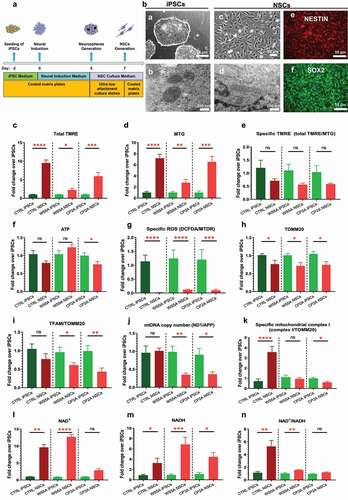
Next, we investigated mitochondrial remodeling during neural conversion. To do this, we measured the mitochondrial volume, MMP, ATP production, ROS production, TFAM, mtDNA copy number, MRC complex I level and NAD+ metabolism and compared cells carrying POLG mutations to control cells that had undergone the same reprogramming (). We used flow cytometry to investigate MMP and mitochondrial volume by costaining live cells with TMRE to measure MMP and MTG to assess the mitochondrial volume. To correct MMP for mitochondrial volume, we divided the median fluorescence intensity of TMRE with that for MTG to obtain MMP per mitochondrial volume. This ratio gives a measure of MMP independent of mitochondrial volume, which we call specific MMP. During neural induction, both control and patient cells showed a significant increase in the mitochondrial volume measured by MTG () and total MMP measured by TMRE (). No significant change in specific MMP was seen (), and this was the same in both control and patient cells. We then measured ATP production per cell using a live-cell luminescence assay. Both control and the WS5A patient cells showed no changes in ATP production, whereas CP2A cells showed a decreased ATP level during neural induction (). We also investigated intracellular ROS production by double staining live cells with DCFDA and MTDR. To correct the ROS levels for mitochondrial volume, we divided total ROS by a measurement of MTDR to give specific ROS independent of the mitochondrial volume. We found that both the control and patient groups showed similar changes with a decreased specific ROS production in NSCs when compared to their parental iPSCs ().
Next, we investigated the mtDNA copy number. This was done in two ways, indirectly using flow cytometry to assess the expression of TFAM, which binds mtDNA in molar quantities, and directly using qRT-PCR. We performed flow cytometric quantification using antibodies against TFAM and mitochondrial import receptor subunit TOM20 (TOMM20) to correct for mitochondrial volume. This showed a similar decrease in TOMM20 expression during neural conversion in both control and patient cells (). Specific TFAM levels, i.e. after correction with TOMM20, were similar in control NSCs and control iPSCs; however, both patient cell lines showed a significantly decreased level of specific TFAM expression during the neural induction (). These results were confirmed by qRT-PCR. We found that the control group showed no change of in mtDNA copy number (ND1/APP) after NSC induction (), while both patient cell lines showed decreased mtDNA copy number in their NSCs compared to the individual iPSCs ().
In our earlier postmortem studies, we showed that MRC complex I was lost in POLG-affected frontal and cerebellar neurons [Citation15], and we confirmed these findings in iPSC-derived NSCs [Citation17]. We therefore checked how complex I changed during neural induction. To quantify the complex I level, we used flow cytometry and an antibody against NDUFB10, the same antibody used in the previous study [Citation17]. Double staining with TOMM20 allowed us to correlate the MRC complex I level with the mitochondrial volume. We found that specific complex I level, measured by NDFUB10/TOMM20, increased in control NSCs compared to the control iPSCs from which they were derived (). In contrast, we found that the level of NDFUB10/TOMM20 decreased in both patient groups, significantly in CP2A cells but only a trend in WS5A cells ().
Next, we assessed NAD+ metabolism using LC-MS. This showed increased levels of total NAD+ () and NADH () in both control and patient NSCs compared with their iPSCs. When calculating the NAD+/NADH ratio, we found a similar trend in the control and both patient groups (); however, the increase in two patient lines was much less than that seen in the control cells ().
These results indicate that during the conversion from iPSCs to NSCs, the mitochondrial volume, MMP and ROS production react similarly in both POLG patient and control cells. However, changes in ATP production (especially in CP2A patient group), mtDNA copy number, MRC complex I and NAD+ metabolism differ in patient and control groups, suggesting that a defect in mitochondrial remodeling does occur during neural induction of cells carrying POLG mutations. Interestingly, this appears more severe in the compound heterozygous cells.
Mitochondrial reprogramming during the conversion of NSCs into DA neurons
Previously, we reported that POLG patient-specific DA neurons generated from iPSC manifested the same phenotype found in patient postmortem samples, namely, loss of complex I and depletion of mtDNA [Citation19]. Therefore, we investigated mitochondrial remodeling during conversion of NSCs into DA neurons () using the same protocol as described previously [Citation19]. The differentiated DA neurons showed a clear neuronal morphology with neurites and complex networks in bright field microscopy (, a) and an elongated mitochondrial structure under TEM (, c). We confirmed the expression of specific DA neural lineage markers with immunostaining and found that the DA neurons stained positively for tyrosine hydroxylase (TH) (red) (, b) and dopamine transporter (DAT) (green) (, d).
Figure 2. Mitochondrial reprogramming during the conversion of NSCs into DA neurons.
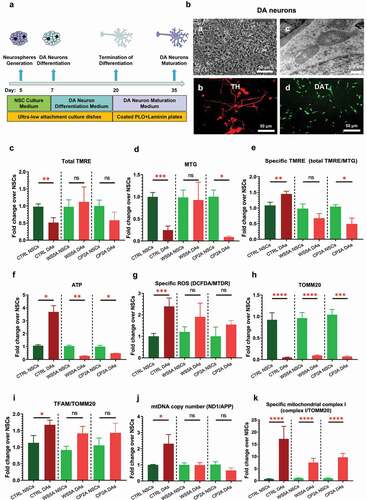
Using the TMRE/MTG double staining technique described above, we found that total MMP measured by TMRE was significantly lower in control DA neurons than their parental NSCs, while changes in the two patient lines did not reach significance (). The mitochondrial volume appeared to decrease in the control and CP2A groups, while no significant difference was detected in the WS5A lines (). When we measured the specific MMP level (total TMRE/MTG), we saw that control and patient cells reacted differently: specific MMP rose in control lines, while in the two patient groups, the level declined. This was significant in CP2A but not WS5A (). Direct measurement of intercellular ATP production per cell confirmed these findings: ATP production increased significantly in control cells but declined significantly in both WS5A and CP2A during transition from NSCs to DA neurons (). ROS levels in both control and patient cells showed an increase after neuron differentiation from NSCs, although this did not reach significance in the two patient groups ().
We then assessed changes in mtDNA during DA neuron differentiation from NSCs using the same techniques described above. We found an increase in the specific TFAM protein level (TFAM/TOMM20) in all cell lines, but this was significant only in the control group, not in the two patient groups (). We detected decreased levels of TOMM20 expression in all groups (). The rise in mtDNA copy number was confirmed by qRT-PCR in control cells, but levels appeared similar in neurons and NSCs in patient WS5A and CP2A groups ().
To quantify the amount of MRC complex I, we used flow cytometry for staining of NDUFB10 and TOMM20. Levels of MRC complex I increased as cells transitioned from NSCs to DA neurons in both control and patient lines although the fold change appeared less in the patient groups ().
These findings show that POLG mutations do negatively influence mitochondrial reprogramming during neuronal differentiation with changes affecting MMP, ATP production, ROS, mtDNA replication and amount of MRC complex I during the transition from NSCs into DA neurons.
Mitochondrial reprogramming during the conversion of NSCs into glial astrocytes
Previously, we demonstrated that POLG astrocytes exhibited mitochondrial dysfunction, including energy failure and mtDNA alteration [Citation18]. Using the protocol described previously [Citation18] and the same approaches as described above, we investigated mitochondrial reprogramming during the conversion of NSCs into glial astrocytes (). We confirmed that astrocytes showed the appropriate star-shaped appearance (, a) in the bright field microscopy and an enlongated mitochondrial structure under TEM (, b) after one month’s differentiation from NSCs. The differentiated astrocytes expressed the astrocyte lineage markers glial fibrillary acidic protein (GFAP) (red) (, c) and S100 beta (green) (, d).
Figure 3. Mitochondrial reprogramming during the conversion of NSCs into glial astrocytes.
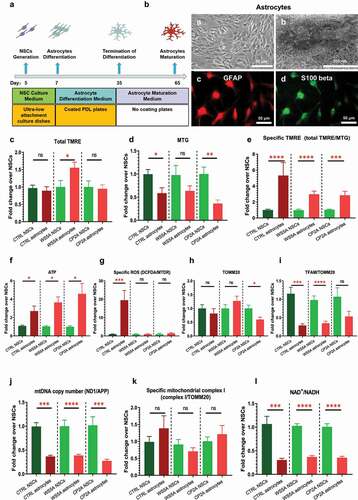
Using the flow cytometry approach with TMRE/MTG costaining as described above, we found an increased total MMP in the WS5A group, but no changes in control and CP2A groups () during astrocyte differentiation. The mitochondrial volume measured by MTG decreased in all cell lines but reached significance only in the control and CP2A cells not the WS5A group (). However, when we measured specific MMP (total TMRE/MTG), we saw that this increased in both control and patient groups, albeit less in patient cells than control (). These results were confirmed by the direct measurement of the intercellular ATP level, which revealed a significant increase in astrocytes compared to NSCs in all groups (). For the ROS level, we found an increased level in the control group, but no change in the two patient lines ().
We then analyzed mtDNA and found a decreased specific TFAM protein level (TFAM/TOMM20) in both control and patient samples, which was significant except for the CP2A cells (). We detected a decreased level of TOMM20 expression in the CP2A group, but not in the CTRL and WS5A groups (). Quantification by qRT-PCR, however, revealed a significant decrease in the mtDNA copy number in both control and patient groups ().
The MRC complex I level measured using NDUFB10 and TOMM20 staining showed no changes in specific MRC complex I (NDUFB10/TOMM20) in all the groups during the astrocyte differentiation from NSCs (). Next, we investigated NAD+ metabolism by measuring the ratio of NAD+/NADH levels using LC-MS and found that the NAD+/NADH ratio fell significantly in astrocytes compared to NSCs in both control and patient groups ().
These findings reveal that POLG mutations appear not to disturb mitochondrial reprogramming during the conversion of NSCs into astrocytes compared to controls.
Abnormal mitochondrial reprogramming via downregulation of the SIRT3/AMPK signaling pathway during neural induction in POLG cells
As shown above, mitochondrial reprogramming is abnormal during neural induction from iPSCs to NSCs and during DA neural differentiation in the presence of POLG mutations. We, therefore, investigated potential molecular pathways involved. Previous studies have shown that mitochondrial and metabolic reprogramming was regulated by Sirtuin 1 (SIRT1) and Sirtuin 3 (SIRT3) signaling pathways and mediated through mTOR and AMP-activated protein kinase (AMPK) signaling pathways [Citation22–27]. Using Western blotting, we examined SIRT1, SIRT3, mTOR and AMPK during the conversion of iPSCs into NSCs. We found that SIRT3 expression was reduced in both WS5A and CP2A NSCs compared with their parental iPSCs, whereas the level in control cells was similar during this transition (). To investigate the SIRT1 signaling pathway, we measured the ratio of phosphorylated SIRT1 (p-SIRT1) (Ser47)/SIRT1 and found no changes in either control or patient groups (). We then investigated the mTOR signaling pathway by measuring the ratio of p-mTOR/mTOR and the AMPK signaling pathway by measuring the ratio of p-AMPK (T183 + T172)/AMPK. We detected an increased ratio of p-AMPK (T183 + T172)/AMPK in control during differentiation, which was unchanged in two patient groups (). For the mTOR signaling pathway, we found similar levels of the p-mTOR/mTOR ratio in both control and patient cells ().
Figure 4. Abnormal mitochondrial reprogramming via downregulation of the SIRT3/AMPK signaling pathway during neural induction in POLG cells.
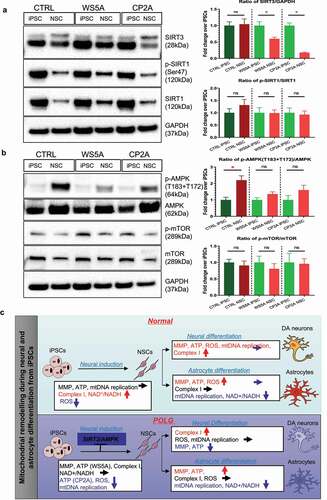
Our data suggest that POLG mutations induce abnormal mitochondrial reprogramming via downregulation of the SIRT3/AMPK signaling pathway during neural induction.
Discussion
In this study, we investigated the mitochondrial remodeling that occurs during the transition from iPSCs to NSCs and neural and glial astrocyte differentiation from NSCs in normal cells and cells with POLG mutations. Our study reveals, for the first time, that POLG mutations disturb mitochondrial remodeling both during neural induction (i.e. conversion from iPSCs to NSCs) and during DA neural differentiation (conversion from NSCs to DA neurons). Interestingly, we did not detect any differences in mitochondrial parameters during the differentiation of NSCs into astrocytes. Mechanistically, we found that downregulation of the SIRT3 and AMPK signaling pathway during the neural induction in POLG cells may contribute to the disturbed remodeling and thus to the pathogenesis of POLG-related diseases.
We show that when normal iPSCs exit pluripotency into the early neuron progenitor stage, mitochondrial metabolism remodeling does occur. The total MMP and mitochondrial volume increase, but the MMP per mitochondrial volume, i.e. TRME/MTG, remains unchanged as does ATP production. The mtDNA copy number also remains stable, but MRC complex I and NAD+ metabolism increase. These data indicate that respiration and MRC complex I activity remain relatively low in iPSCs compared with their differentiated derivatives as reported previously [Citation28]. In addition, we also find that the ROS level declines from iPSCs to NSCs. Stem cells are generally considered to be glycolytic, and while they are indeed capable of using OXPHOS, they require glycolysis to maintain stemness [Citation29–32]. In agreement with the other stem cells, NSCs appear less reliant on OXPHOS for ATP production than nondividing neurons and remain predominately glycolytic [Citation33]; this limits ROS production and oxidative damage [Citation34].
When we compared remodeling in POLG cells exiting pluripotency with controls, we saw similar changes in the MMP, mitochondrial volume, ATP production and ROS, but mtDNA replication, MRC complex I and NAD+ metabolism failed to remodel normally. Our previous studies in both postmortem samples [Citation15] and neural progenitors [Citation17] defined complex I deficiency, mtDNA depletion and abnormal NAD+ homeostasis as the primary consequences of POLG mutations. The evidence in the current study suggests that quantitative mtDNA depletion and respiratory chain deficiency occur at a very early neural induction stage that most likely contributes to the accumulated neuronal loss in patients. Importantly, these studies further demonstrate the fundamental role of mitochondrial function during brain development and neurogenesis.
Neurons are energy-demanding cells. During neural differentiation, mitochondrial maturation occurs and the energy metabolism shifts from glycolysis to primarily mitochondrial metabolism [Citation28,Citation35–37]. Differentiation of NSCs involves the activation of aerobic metabolism, which is dependent on mitochondrial function [Citation38–40]. Here, we show that a coordinated activation of mitochondrial metabolism with a robust increase in various mitochondrial functions and respiration capacity occurs during the DA neuron differentiation and maturation. We show that while the mitochondrial volume and total TMRE fall, MMP per mitochondrial unit (TMRE/MTG) and ATP production rise, reflecting the greater energy efficiency that comes with switching from glycolysis to OXPHOS. The increased mtDNA and MRC complex I expression supports the increase in MRC dependence as does the increased ROS production. Our findings are similar to the other studies. Both in vivo and in vitro studies and single-cell transcriptomic studies have demonstrated a metabolic shift from glycolysis to OXPHOS during neurogenesis [Citation41–44].
Our study has important implications for neural development in patients with defects affecting mtDNA homeostasis. We show that mtDNA depletion induced by POLG mutations suppresses normal mitochondrial maturation during neuronal differentiation. These findings confirm our previous in vivo and in vitro studies [Citation13,Citation15,Citation16,Citation22]. Since the presence of NSCs in the adult brain implies that continuous replenishment of neurons is a normal property, our study raises the possibility that disturbed mitochondrial remodeling may disrupt this process. A previous report demonstrated a novel link between mtDNA damage and differentiation fate of NSCs [Citation30]. We speculate, therefore, that the neurodegeneration seen in POLG patients may reflect the combination of neuronal loss due to energy deficiency [Citation15] and mtDNA damage in the resident NSC population hampering differentiation and replenishment of neurons.
From our earlier studies, we know that astrocytes are affected by the presence of POLG mutations [Citation15]. Our previous study also show that they change and become toxic for neurons. However, our study did not show that the presence of POLG mutations affected mitochondrial remodeling during the conversation of NSCs into glial astrocytes, suggesting that this is a specific event accompanying neural differentiation. This may potentially be due to the fact that astrocytes remain heavily dependent on glycolytic metabolism for their energy supply.
SIRT3 is a nuclear NAD+-dependent histone deacetylase that regulates mitochondrial oxidative stress and bioenergetics [Citation45–48]. SIRT3 also inhibits mitochondria-mediated apoptosis, associated with activation of the AMPK pathway [Citation49]. In addition, SIRT3 has been shown to be involved in metabolic reprogramming [Citation50]. Previous studies have found that SIRT3 can regulate mitochondrial protein networks and control different programs such as ROS homeostasis, TCA cycling, mitochondrial respiratory complexes, mtDNA and mitochondrial translation [Citation46]. Loss of SIRT3 is highly associated with neurodegenerative diseases such as Alzheimer’s disease, Parkinson’s disease, Huntington’s disease and amyotrophic lateral sclerosis [Citation45]. SIRT3 can also play an important role in stabilizing ROS levels and stimulating mitochondrial biosynthesis by regulating the AMPK signaling pathway, ultimately increasing mitochondrial turnover and cell regeneration [Citation49]. Moreover, AMPK-deficient cells reduced SIRT3 activity and activation of AMPK, via SIRT3, limited oxidative stress and improved mtDNA integrity and mitochondrial function [Citation49]. Here, we show that the SIRT3 and AMPK pathways are selectively downregulated in POLG cells during differentiation from iPSCs into NSCs, thereby suppressing mtDNA replication, MRC complex I and NAD+ metabolism in POLG cells. Earlier studies showed that activation of SIRT3 and AMPK pathways was able to stimulate mitochondrial biogenesis to increase mitochondrial turnover [Citation49] and preserve mtDNA integrity and mitochondrial function [Citation51]. Similar to those studies, our study shows that activation of the SIRT3 and AMPK pathways can improve mitochondrial biogenesis. The potential contribution of the SIRT3/AMPK signaling pathway to the abnormal mitochondrial remodeling during the early neural induction phase suggests that targeting these pathways may provide a potential clinical treatment for POLG-related diseases.
In summary, our study suggests that POLG mutations lead to an abnormal remodeling of mitochondrial and NAD+ metabolism in early neural fate via inhibition of the SIRT3/AMPK signaling pathway. This remodeling has major implications for later neuronal development and may play a role in the loss of neurons that is seen in patients with POLG disease.
Author’s contributions:
K.L and L.A.B contribute to the conceptualization. A.C and K.L contribute to the methodology. A.C, K.L, C.K.K and L.E.H contribute to the investigation. A.C and K.L contribute to the writing original draft. A.C, C.K.K, M.Z, J.W, G.J.S, X.L, L.A.B and K.L contribute to the writing review and editing. L.A.B and A.C contribute to the funding acquisition. K.L, L.A.B, X.L. and M.Z contribute to the resources. K.L, L.A.B and X. L contribute to the supervision. All authors agree to the authorships.
Supplemental Material
Download Zip (8.1 MB)Acknowledgments
The authors encourage all laboratory members for discussions and critical reading of the manuscript. We are grateful to the Molecular Imaging Centre and the Flow Cytometry Core Facility at the University of Bergen in Norway.
Disclosure statement
No potential conflict of interest was reported by the author(s).
Data availability statement:
We confirm that the data supporting the findings of this study are available within the supplementary materials.
Supplementary material
Supplemental data for this article can be accessed here.
Additional information
Funding
References
- Bukowiecki R, Adjaye J, Prigione A. Mitochondrial function in pluripotent stem cells and cellular reprogramming. Gerontology. 2014;60(2):174–182.
- Xu X, Duan S, Yi F, et al. Mitochondrial regulation in pluripotent stem cells. Cell Metab. 2013;18(3):325–332.
- Suhr ST, Chang EA, Tjong J, et al. Mitochondrial rejuvenation after induced pluripotency. PloS one. 2010;5(11):e14095.
- Zhong X, Cui P, Cai Y, et al. Mitochondrial dynamics is critical for the full pluripotency and embryonic developmental potential of pluripotent stem cells. Cell Metab. 2019;29(4):979–92. e4.
- Spyrou J, Gardner DK, Harvey AJ. Metabolism is a key regulator of induced pluripotent stem cell reprogramming. Stem Cells Int. 2019;2019:1–10.
- Prigione A, Ruiz-Pérez MV, Bukowiecki R, et al. Metabolic restructuring and cell fate conversion. Cell Mol Life Sci. 2015;72(9):1759–1777.
- O’Brien LC, Keeney PM, Bennett JP Jr. Differentiation of human neural stem cells into motor neurons stimulates mitochondrial biogenesis and decreases glycolytic flux. Stem Cells Dev. 2015;24(17):1984–1994.
- Cliff TS, Dalton S. Metabolic switching and cell fate decisions: implications for pluripotency, reprogramming and development. Curr Opin Genet Dev. 2017;46:44–49.
- Lisowski P, Kannan P, Mlody B, et al. Mitochondria and the dynamic control of stem cell homeostasis. EMBO Rep. 2018;19(5). DOI:https://doi.org/10.15252/embr.201745432
- Takahashi K, Yamanaka S. Induction of pluripotent stem cells from mouse embryonic and adult fibroblast cultures by defined factors. Cell. 2006;126(4):663–676.
- Takahashi K, Tanabe K, Ohnuki M, et al. Induction of pluripotent stem cells from adult human fibroblasts by defined factors. Cell. 2007;131(5):861–872.
- Takahashi K, Yamanaka S. A decade of transcription factor-mediated reprogramming to pluripotency. Nat Rev Mol Cell Biol. 2016;17(3):183–193.
- Tzoulis C, Engelsen BA, Telstad W, et al. The spectrum of clinical disease caused by the A467T and W748S POLG mutations: a study of 26 cases. Brain. 2006;129(7):1685–1692.
- Hikmat O, Naess K, Engvall M, et al. Simplifying the clinical classification of polymerase gamma (POLG) disease based on age of onset; studies using a cohort of 155 cases. J Inherit Metab Dis. 2020;43(4):726–736.
- Tzoulis C, Tran GT, Coxhead J, et al. Molecular pathogenesis of polymerase gamma–related neurodegeneration. Ann Neurol. 2014;76(1):66–81.
- Tzoulis C, Tran GT, Schwarzlmüller T, et al. Severe nigrostriatal degeneration without clinical parkinsonism in patients with polymerase gamma mutations. Brain. 2013;136(8):2393–2404.
- Liang KX, Kristiansen CK, Mostafavi S, et al. Disease-specific phenotypes in iPSC -derived neural stem cells with POLG mutations. EMBO Mol Med. 2020;12(10):e12146.
- Liang KX, Kianian A, and Chen A, et al. Stem cell derived astrocytes with POLG mutations and mitochondrial dysfunction including abnormal NAD+ metabolism is toxic for neurons. bioRxiv 2020.12.20.423652. 2020 doi:https://doi.org/10.1101/2020.
- Liang KX, Vatne GH, Kristiansen CK, et al. N-acetylcysteine amide ameliorates mitochondrial dysfunction and reduces oxidative stress in hiPSC-derived dopaminergic neurons with POLG mutation. Exp Neurol. 2021;337:113536.
- Aubi O, Prestegård KS, Jung-Kc K, et al. The Pah-R261Q mouse reveals oxidative stress associated with amyloid-like hepatic aggregation of mutant phenylalanine hydroxylase. Nat Commun. 2021;12(1):2073.
- Liang KX, Chen A, Kristiansen CK, et al. Flow cytometric analysis of multiple mitochondrial parameters in human induced pluripotent stem cells and their neural and glial derivatives. J Vis Exp. 2021;(177). DOI: https://doi.org/10.3791/63116.
- Wu Y-T, Wu S-B, Wei Y-H. Metabolic reprogramming of human cells in response to oxidative stress: implications in the pathophysiology and therapy of mitochondrial diseases. Curr Pharm Des. 2014;20(35):5510–5526.
- Wu S-B, Wu Y-T, Wu T-P, et al. Role of AMPK-mediated adaptive responses in human cells with mitochondrial dysfunction to oxidative stress. Biochim Biophys Acta. 2014;1840(4):1331–1344.
- Ruderman NB, Xu XJ, Nelson L, et al. AMPK and SIRT1: a long-standing partnership? Am J Physiol Endocrinol Metab. 2010;298(4):E751–E760.
- Chatzidoukaki O, Goulielmaki E, Schumacher B, et al. DNA damage response and metabolic reprogramming in health and disease. Trends in Genetics 2020.
- Salminen A, Kaarniranta K. AMP-activated protein kinase (AMPK) controls the aging process via an integrated signaling network. Ageing Res Rev. 2012;11(2):230–241.
- Lee S-H, Lee J-H, Lee H-Y, et al. Sirtuin signaling in cellular senescence and aging. BMB Rep. 2019;52(1):24.
- Teslaa T, Teitell MA. Pluripotent stem cell energy metabolism: an update. EMBO J. 2015;34(2):138–153.
- Liang R, Ghaffari S. Stem cells, redox signaling, and stem cell aging. Antioxid Redox Signal. 2014;20(12):1902–1916.
- Tan DQ, Suda T. Reactive oxygen species and mitochondrial homeostasis as regulators of stem cell fate and function. Antioxid Redox Signal. 2018;29(2):149–168.
- Wang K, Zhang T, Dong Q, et al. Redox homeostasis: the linchpin in stem cell self-renewal and differentiation. Cell Death Dis. 2013;4(3):e537.
- Ren F, Wang K, Zhang T, et al. New insights into redox regulation of stem cell self-renewal and differentiation. Biochim Biophys Acta. 2015;1850(8):1518–1526.
- Agathocleous M, Love NK, Randlett O, et al. Metabolic differentiation in the embryonic retina. Nat Cell Biol. 2012;14(8):859–864.
- Folmes CDL, Nelson TJ, Dzeja PP, et al. Energy metabolism plasticity enables stemness programs. Ann N Y Acad Sci. 2012;1254(1):82–89.
- Khacho M, Slack RS. Mitochondrial dynamics in the regulation of neurogenesis: from development to the adult brain. Dev Dyn. 2018;247(1):47–53.
- Sasaki Y. Metabolic aspects of neuronal degeneration: from a NAD+ point of view. Neurosci Res. 2019;139:9–20.
- Hu C, Fan L, Cen P, et al. Energy metabolism plays a critical role in stem cell maintenance and differentiation. Int J Mol Sci. 2016;17(2):253.
- Wang W, Osenbroch P, Skinnes R, et al. Mitochondrial DNA integrity is essential for mitochondrial maturation during differentiation of neural stem cells. Stem Cells. 2010;28(12):2195–2204.
- Beckervordersandforth R, Mira Aparicio H, Lie DC. Mitochondrial metabolism-mediated regulation of adult neurogenesis. Brain Plast. 2017;3(1):73–87.
- Almeida AS, Vieira HL. Role of cell metabolism and mitochondrial function during adult neurogenesis. Neurochem Res. 2017;42(6):1787–1794.
- Llorens-Bobadilla E, Zhao S, Baser A, et al. Single-cell transcriptomics reveals a population of dormant neural stem cells that become activated upon brain injury. Cell Stem Cell. 2015;17(3):329–340.
- Khacho M, Clark A, Svoboda DS, et al. Mitochondrial dynamics impacts stem cell identity and fate decisions by regulating a nuclear transcriptional program. Cell Stem Cell. 2016;19(2):232–247.
- Agostini M, Romeo F, Inoue S, et al. Metabolic reprogramming during neuronal differentiation. Cell Death Differ. 2016;23(9):1502–1514.
- Beckervordersandforth R, Ebert B, Schäffner I, et al. Role of mitochondrial metabolism in the control of early lineage progression and aging phenotypes in adult hippocampal neurogenesis. Neuron. 2017;93(3):560–73. e6.
- Salvatori I, Valle C, Ferri A, et al. SIRT3 and mitochondrial metabolism in neurodegenerative diseases. Neurochem Int. 2017;109:184–192.
- Van de Ven RA, Santos D, Haigis MC. Mitochondrial sirtuins and molecular mechanisms of aging. Trends Mol Med. 2017;23(4):320–331.
- Hirschey M, Shimazu T, Huang J-Y, et al. SIRT3 regulates mitochondrial protein acetylation and intermediary metabolism. Cold spring harbor symposia on quantitative biology. Cold Spring Harbor Laboratory Press; 2011. p. 267–277.
- Marcus JM, Andrabi SA. SIRT3 regulation under cellular stress: making sense of the ups and downs. Front Neurosci. 2018;12:799.
- Xin T, Lu C. SirT3 activates AMPK-related mitochondrial biogenesis and ameliorates sepsis-induced myocardial injury. Aging (Albany NY). 2020;12(16):16224.
- Weir HJ, Lane JD, Balthasar N. SIRT3: a central regulator of mitochondrial adaptation in health and disease. Genes Cancer. 2013;4(3–4):118–124.
- Chen LY, Wang Y, Terkeltaub R, et al. Activation of AMPK-SIRT3 signaling is chondroprotective by preserving mitochondrial DNA integrity and function. Osteoarthritis Cartilage. 2018;26(11):1539–1550.