
ABSTRACT
LncRNA ZNFX1 antisense RNA 1 (ZFAS1) could improve neuronal damage and inhibit inflammation and apoptosis. We conducted an in-depth exploration on the protective mechanism of ZFAS1 in cerebral ischemia-reperfusion injury. Overexpressed or silenced plasmids of ZFAS1 were transfected into the cells to analyze the effects of oxygen-glucose deprivation/reperfusion (OGD/R) treatment on the viability, apoptosis and related gene expressions of Neuro-2a cell by performing MTT assay, flow cytometry, qRT-PCR, and Western blot. Bioinformatic analysis, qRT-PCR, dual-luciferase reporter assay and RNA immunoprecipitation were used to screen and verify the miRNA(s) which could competitively bind with ZFAS1 and downstream mRNA(s) targeted by the miRNA(s). The effects of ZFAS1 and the above target miRNA(s) or gene(s) on the apoptosis of OGD/R-injured cells, apoptosis-related proteins, inflammatory factors and p65/IκBα pathway were further verified via the rescue test. The results from the middle cerebral artery occlusion (MCAO) mouse model in vivo were consistent with those from the cellular experiments. The expression of lncRNA ZFAS1 in OGD/R-injured cells was inhibited, and the up-regulation of ZFAS1 protected Neuro-2a cells. MiR-421-3p was predicted to be the target miRNA of ZFAS1 and could offset the protective effect of ZFAS1 overexpression on OGD/R-injured cells following its up-regulation. MEF2C, which was the downstream target gene of miR-421-3p, reversed the OGD/R-induced enhanced cell damage caused by miR-421-3p mimic when MEF2C was overexpressed. In in vivo studies, ZFAS1 overexpression reduced brain tissue infarction, apoptosis and gene regulation caused by MCAO, while miR-421-3p mimic had the opposite effect. Collectively, the regulation of lncRNA ZFAS1/miR-421-3p/MEF2C axis showed protective effects on cerebral ischemia-reperfusion injury.
Introduction
Cerebrovascular disease, which is characterized by high disability, morbidity, and mortality, is currently one of the focuses on the prevention and treatment of elderly diseases [Citation1]. Ischemic cerebrovascular disease is the most common cerebrovascular disease. In the rehabilitative treatment of ischemic cerebrovascular disease, restoring the blood supply to the ischemic area plays an important role in avoiding ischemic damage to the brain tissue, but could easily lead to reperfusion injury at the same time [Citation2]. Cerebral ischemia-reperfusion injury involves several pathological mechanisms, such as the excessive release of excitatory amino acids, the imbalance of ion level in the body, energy exhaustion, inflammatory response, oxidative stress, apoptosis, etc. [Citation3–5]. The interaction of these factors could eventually lead to irreversible damage to brain tissues; however, the current results still insufficient to explain the detailed mechanism of cerebral ischemia-reperfusion injury clearly [Citation6].
Long non-coding RNAs (lncRNAs) are RNA molecules longer than 200 nucleotides in length. With the development of whole-genome sequencing technology, lncRNAs have received increasing attention [Citation7]. A large number of studies [Citation8,Citation9] have shown that in various diseases, including in cerebral ischemia-reperfusion injury and tumors, the abnormal expressions of lncRNAs participate in various biological functions, such as proliferation, apoptosis, metastasis and differentiation through acting as a regulator of epigenetics, transcription or post-transcription. At the same time, abnormally expressed lncRNAs in cerebral ischemia-reperfusion injury have also been discovered [Citation10,Citation11]. LncRNA ZNFX1 antisense RNA 1 (ZFAS1), which is located on the antisense strand of the promoter region containing the NFX-1 zinc finger structure, is explored in the current study. As a host of three small nucleolar RNAs, ZFAS1 was discovered for the first time in the research of breast carcinoma [Citation12]. ZFAS1 is identified as a potential marker of breast carcinoma, and its abnormal expression is also involved in the growth and metastasis of many tumors like gastric carcinoma and liver carcinoma [Citation13,Citation14]. In addition to intervening in the progression of tumor diseases, ZFAS1 also has great diagnostic potential in cardiac and cerebrovascular diseases. Jiao confirmed that ZFAS1 changes Ca2+ homeostasis in the cytoplasm to induce mitochondrial-mediated apoptosis, thereby exerting a protective effect on cardiomyocytes [Citation15]. Wang found that ZFAS1 may be a diagnostic marker in clinical studies of ischemic stroke [Citation16]. Zhang’s research further underlined that ZFAS1 could improve neuronal damage caused by cerebral ischemia-reperfusion and inhibit inflammation and apoptosis [Citation17].
A middle cerebral artery occlusion (MCAO) mouse model in vivo and oxygen-glucose deprivation/reperfusion (OGD/R) cell model in vitro were constructed to clarify the mechanism of ZFAS1 in cerebral ischemia-reperfusion injury in this study.
Materials and methods
1. Cell and model establishment
Mouse Neuro-2A neuroblastoma (Neuro-2a) cells were established by R.J.Klebe and F.H.Ruddle with spontaneous tumors of strain A. white mice, and most of them were neuron-like with axon-like structures. Therefore, we purchased Neuro-2a cells (CL-0168) from Wuhan Procell Company for in vitro research. Neuro-2a cells were inoculated in complete MEM (PM150411B, Procell, China) mixed with fetal bovine serum. When serum-free medium was required in subsequent experiments, the medium was replaced with pure MEM (PM150410B, Procell, China). The conventional cell culture was uniformly completed in a Heracell™ VIOS 250i CO2 Incubator (Thermo Scientific™) at 37°C with 5% CO2.
A OGD/R cell model was constructed by referring to Diao’s method [Citation18]. Neuro-2a cells were adjusted to a concentration of 1 × 10⁵ cells/mL and then uniformly inoculated in pure MEM. Neuro-2a cells in the Control group were inoculated in complete MEM, and those in the OGD/R group were transferred to a 37°C Heal Force three-gas incubator (HF100) containing 1% O2, 5% CO2, and 94% N2. The subsequent OGD treatment was conducted with continuous filling of anoxic mixture for 6 hours (h). During this period, the cells in the Control group were cultured routinely. After 12 h of reperfusion, two groups of Neuro-2a cells were routinely cultured in complete MEM.
2. Liposomal transfection
The overexpression plasmids of ZFAS1 and MEF2C and the genetic knockout plasmids of ZFAS1 (shZFAS1, 5’-CCGTAAGTTCCCGTTTTGTGTGT-3’) as well as their negative controls were synthesized by Shanghai HANBIO Company. MiR-421-3p mimic (miR10004869-1-5) and mimic control (miR1N0000001-1-5) were developed by and obtained from Guangzhou RIBIO Company. After completing the preparation of plasmid, we used the Lipofectamine 3000 liposome transfection reagent (L3000015, ThermoFisher) to transfect the overexpression/knockdown plasmid into the Neuro-2a cells of the corresponding groups. The transfection efficiency was assessed 48 h after transfection by quantitative real-time polymerase chain reaction (qRT-PCR).
3. QRT-PCR
Gene mRNA level was determined by qRT-PCR and calculated by 2−ΔΔCT method [Citation19]. Total RNAs in Neuro-2a cells and the brain tissues of mouse were separated by TRIzol (15,596,018, Invitrogen, USA), and then cDNA was further synthesized by PrimeScriptTM RT reagent Kit (RR047A, TaKaRa, Japan). Pre-synthesized primers of genes (Sangon, China), Roche SYBR Green Master (04913914001) and DEPC water were added to the cDNA and mixed together for a further test in the detection instrument (thermal cycler T100, Bio-Rad, USA), according to the following settings to complete the detection of qRT-PCR: pre-denaturation at 95°C for 10 minutes (min), 40 cycles of denaturation at 95°C for 15 seconds (s), and annealing at 58°C for 1 min. For calculating mRNA levels, GAPDH and U6 were used as the internal references. The detailed sequences of primers were listed in .
Table 1. Primers for qRT-PCR.
4. MTT assay
Neuro-2a cells in the Control group and other groups showed a normal growth. According to the recommended inoculation requirements, the concentration of Neuro-2a cells was adjusted to 1 × 10⁴ cells/mL and 100 µL of cells were transferred to a sterilized 96-well plate (6 wells per treatment group). After a routine culture for 48 h, 10 µL of APE×BIO MTT solution (B7777) was added to Neuro-2a cells in the Control group and other treatment groups. After 4 h, the Neuro-2a cells were detected by absorbance at 490 nm using the Molecular Devices microplate reader (SpectraMax iD5).
5. Apoptosis test
Neuro-2a cells were trypsinized and washed with PBS. 1 × 10⁵ Neuro-2a cells were resuspended in 100 µL of 1× Binding Buffer from Annexin V-FITC/PI Apoptosis Detection Kit (40302ES60, YEASEN, China), and stained by Annexin V-FITC (5 µL) and PI Staining Solution (5 µL) in a dark condition. Next, 400 µL of 1× Binding Buffer was added to the mixture of Neuro-2a cells and the changes in the apoptosis were analyzed by BD FACSVerse flow cytometer (USA).
6. Western blot
The protein levels of genes were determined by Western blot. The powerful-RIPA lysis buffer (P0013K, Beyotime, China) and the BCA detection kit (P0010S, Beyotime, China) were applied in the extraction and quantification of proteins from Neuro-2a cells or the brain tissues of mice. The proteins were subsequently transferred to the NC membrane (N8645, Millipore, USA) with a pore size of 0.22 μm by the method of SDS-PAGE. After being treated with the blocking solution at room temperature for 2 h, the NC membrane was fully covered using corresponding primary antibodies at 4°C. After 24 h, the primary antibody was rinsed off and replaced with the corresponding secondary antibody for a further incubation with the membrane. The NC membrane was developed with Beyotime ECL Luminescent Solution (P0018S) after 1 h. The fluorescent signal generated by the protein on the membrane was collected by the BIO-RAD Gel Doc™ XR+ instrument and processed into an image with corresponding gray-scale bands. GAPDH was an internal reference. The primary and secondary antibodies used in the experiment were purchased from Abcam and CST in the United States as follows: Abcam provided the primary antibodies against Bcl-2 (1:1000, 26 kDa, ab59348), Bax (1:2000, ab32503, 21 kDa), cleaved Caspase-3 (1:5000, ab214430, 17 kDa), Caspase-3 (1:1000, ab90437, 32 kDa), phosphorylated-p65 (p-p65; 1:1000, ab194726, 60 kDa), p65 (1:1000, ab19870, 65 kDa), MEF2C (1:1000, ab227085, 51 kDa), and GAPDH (1:10,000, ab8245), as well as Rabbit Anti-Mouse secondary antibody (1:10,000, ab6728) and Goat Anti-Rabbit secondary antibody (1:10,000, ab6721); while CST was the manufacturer of the primary antibodies against phosphor-IκBα (p-IκBα; 1:1000, #9246, 40 kDa) and IκBα (1:1000, #4814, 39 kDa). Image J software (National Institutes of Health, Bethesda, USA) was used to quantify western blots.
7. Bioinformatics analysis
StarBase database (http://starbase.sysu.edu.cn/) was used to predict the miRNAs competitively binding to lncRNA ZFAS1. The differential miRNAs in middle cerebral artery occlusion (MCAO) or Sham surgery were analyzed by the dataset GSE97532 in GEO2R (http://www.ncbi.nlm.nih.gov/geo). The intersection of miRNAs obtained by the two methods was shown using a Venn diagram. StarBase and miRDB websites (http://mirdb.org/) provided the target genes of miR-421-3p and the GSE97533 dataset from GEO database (differential mRNAs in MCAO or Sham surgery) was additionally analyzed by GEO2R. The overlapped mRNAs were intersected and obtained by a Venn diagram.
8. Dual-luciferase reporter assay
Based on the binding sequence provided by the starBase database, we constructed the following reporter plasmids: ZFAS1-wt (5’-CCGUCAGAUCGACCCUGUUGAU-3’), ZFAS1-mut (5’-CCGUCAGAUCGACCCUCAUGAU-3’), MEF2C-wt (5’-GUCAGCAGUAUAGGACUGUUGAA-3’), and MEF2C-mut (5’-GUCAGCAGAAUAGGACAGUCGAA-3’) by pmirGLO vector (E1330, Promega, USA). These reporter plasmids and miR-421-3p mimic or mimic control were co-transfected into Neuro-2a cells for 48 h, following which Neuro-2a cells treated with Dual-Luciferase® Reporter Assay kit (E1910, Promega, USA) were transferred to the GloMax 20/20 Luminometer (Promega) to analyze the luciferase activity.
9. RNA immunoprecipitation (RIP)
We collected Neuro-2a cells with transfection (ZFAS1+ miR-421-3p mimic or ZFAS1+ mimic control) and the Neuro-2a cells were then lysed with Cell lysis buffer in the RIP kit (KT102-02, gzscbio.com, China). Cells in the RNase-free EP tubes were labeled as IgG+mimic-NC group, Ago2+ mimic-NC group, IgG+miR-421-3p group, Ago2+ miR-421-3p group, Input-mimic-NC group and Input-miR-421-3p group, respectively. The magnetic bead-antibody mixture prepared according to the instructions was added to the EP tube and incubated at 4°C for 8 h. The antibodies used were anti-Argonaute-2 (Ago2) antibody (1:30, ab186733, Abcam, USA) and the negative control antibody (IgG) provided in the kit. In the immunoprecipitation of RNA binding protein, the mixture of magnetic bead-antibody was mixed with cell lysate for an incubation at 4°C overnight. Cell lysate in the Input-mimic-NC group and Input-miR-421-3p group were not added with magnetic beads-antibody mixture. On the second day, the purified RNA was analyzed for the expression of ZFAS1 by RT-PCR detection method and the enrichment level was calculated.
10. Preparation of middle cerebral artery embolism (MCAO) model
We purchased 30 C57BL/6 J mice (male, 20 g ± 1 g) from Guangzhou Medical Laboratory Animal Center (GDMLAC). The mice were housed at 22°C with humidity of 50% and provided with adequate diet. The experimental operation complied with the requirements of the animal experiment ethics committee of Jiu Jiang No. 1 People’s Hospital (No. 201,901,007-NBK). According to body weight, C57BL/6 J mice were randomly divided into 6 groups (5 mice/group): Sham group, MCAO group, MCAO+NC (for ZFAS1)+Scramble (for miR-421-3p Agomir) group, MCAO+ZFAS1+ Scramble group, MCAO+ZFAS1+ miR-421-3p Agomir group and MCAO+NC+miR-421-3p Agomir group.
The MCAO was prepared based on a previous study [Citation20]. The mice were anesthetized with sodium pentobarbital at a dose of 30 mg/kg. A 6–0 surgical thread was inserted from the left external carotid artery of the mouse and extended into the internal carotid artery to block the middle cerebral artery and induce embolism. The blood flow of arterial embolism was detected by laser Doppler blood flow meter (Moor Instruments, UK). Ischemia was defined when the blood flow dropped to 80% (compared to the baseline). Then, the blood supply was restored and blood flow after reperfusion was maintained higher than 70%. After the treatment of MCAO, the supernatant of cells with overexpressed ZFAS1, miR-421-3p Agomir and their respective control solutions were immediately injected into the corresponding group of mice via tail vein (once a day). At the end of the experiment (the seventh day of injection), all the mice were sacrificed after anesthesia.
11. Triphenyltetrazolium chloride (TTC) staining
The brain tissues of the sacrificed mice were quickly removed and transferred to an environment of −20°C for a 30-min freezing. The frozen brain tissues were incised according to the coronal position and made into cerebral slices with a thickness of 2 mm. The cerebral tissues were then reacted with TTC Stain Kit (D025-1-1, Nanjing Jiancheng Bioengineering Institute, China) for 30 min and were fully stained in a water bath (37°C). The information of image was collected immediately after the removed brain tissues were washed with PBS. The white part of the result was deemed as the infarcted tissues. The proportion of the infarct area in the total area was measured and calculated by the Image J software. The infarct volume was determined as follows: (infarcted area /total brain area) × 100%. To avoid subjective factors, investigator who performed the analysis was blinded to the experimental design.
12. TUNEL staining
The frozen sections of brain tissues obtained were immersed in a staining jar filled with 4% paraformaldehyde fixative solution and fixed for 30 min at room temperature. Temporarily prepared Proteinase K working solution from Keygen rapid TUNEL apoptosis detection kit (KGA704) was added onto the cerebral tissue slices (100 μl/piece). After sealing, the brain slices were treated with TdT enzyme reaction solution (50 μl/piece) for 1 h, and placed in a humidified box at 37°C away from light. After a 30-min labeling with Streptavidin-HRP working solution, we used DAB working solution for color reaction. After the counterstained sections were dried, they were added with neutral gum and covered with the coverslip. The changes in tissue staining were observed through the Olympus CX23 optical microscope (100×). The investigator who performed the analysis was blinded to the experimental design to avoid subjective factors as well. The apoptosis rate (%) was calculated as the percentage of TUNEL-positive nuclei in all nuclei in 5 random fields of each sample.
13. Data analyses
All data obtained in the experiment were statistically analyzed by GraphPad Prism 8 software (USA). The expressions of differential genes in miR-421-3p mimic and mimic control groups were analyzed by independent sample t test. One-way ANOVA followed by Tukey’s post hoc test was used to compare the differences among multiple groups. The analytical result was considered statistically significant when p < 0.05.
Result
1. Overexpressed ZFAS1 enhanced the viability of OGD/R-injured cells and reduced apoptosis by regulating apoptosis-related proteins, while shZFAS1 had the opposite effects
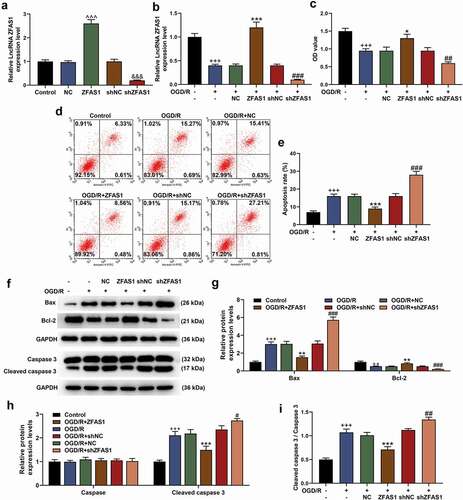
It was fully confirmed in the experiment of transfection that the ZFAS1 overexpression or silencing was successfully constructed in the cells after transfection with plasmids. That is, the mRNA level of ZFAS1 was up-regulated in the overexpressed ZFAS1 group but was down-regulated in the shZFAS1 group (, p < 0.001). The ZFAS1 overexpression/silencing plasmid was subsequently transfected into the OGD/R-injured cells. As expected, the expression of ZFAS1 was suppressed by OGD/R and silenced ZFAS1 but was enhanced by overexpressed ZFAS1 (, p < 0.001). In the following loss-of-function or gain-of-function experiments in cells, the treatment of OGD/R produced greater effects on inhibiting cell viability and increasing apoptosis of Neuro-2a cells (, p < 0.001). More importantly, OGD/R treatment up-regulated the protein levels of Bax and Cleaved caspase 3, but prevented the activation of Bcl-2 (, p < 0.01). Exogenous overexpression or silencing of ZFAS1 also produced reversal or enhanced effects. Specifically, ZFAS1 overexpression attenuated regulatory effects of OGD/R on cell viability, apoptosis and related apoptotic proteins, whereas silenced ZFAS1 further aggravated the effects of OGD/R on damaging Neuro-2a cells. (, p < 0.05).
Figure 1. Overexpressed ZFAS1 enhanced the viability of OGD/R-modeled cells and reduced apoptosis by regulating apoptosis-related proteins, while silenced ZFAS1 had the opposite effect. (A) The transfection efficiency of overexpressed/silenced ZFAS1 was determined by qRT-PCR. (B) The effects of overexpressed/silenced ZFAS1 and OGD/R treatment on ZFAS1 expression in Neuro-2a cells were detected by qRT-PCR. GAPDH was an internal reference. (C) The effects of overexpressed/silenced ZFAS1 and OGD/R treatment on the viability of Neuro-2a cells were determined by MTT assay. (D-E) The effects of overexpressed/silenced ZFAS1 and OGD/R treatment on the apoptosis of Neuro-2a cells were measured via flow cytometry. (F-I) The effects of overexpressed/silenced ZFAS1 and OGD/R treatment on apoptosis-related proteins in Neuro-2a cells were detected by western blot. GAPDH was an internal reference. All experiments were repeated thrice to average (n = 3). ^^^p < 0.001 vs NC; &&&p < 0.001 vs shNC; ++p < 0.01, +++p < 0.001 vs Control; *p < 0.05, **p < 0.01, ***p < 0.001 vs OGD/R+ NC; ##p < 0.01, ###p < 0.001 vs OGD/R+ shNC. ZFAS1, lncRNA ZNFX1 antisense RNA 1; shZFAS1, silent ZFAS1; OGD/R, oxygen-glucose deprivation/reperfusion; qRT-PCR, quantitative real-time polymerase chain reaction; NC, negative control; shNC, silent negative control.
2. MiR-421-3p was confirmed to be targeted by and bind to ZFAS1
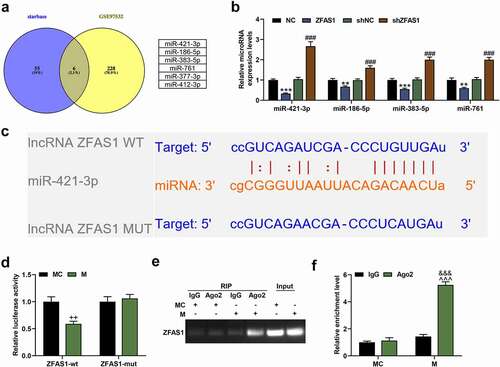
Through bioinformatic prediction, we finally obtained 6 differentially expressed miRNAs in MCAO with the binding sequence of ZFAS1 as follows: miR-377-3p, miR-186-5p, miR-421-3p, miR-383-5p, miR-412-3p, and miR-761 (). According to the experimental requirements, we further verified the 4 miRNAs higher-expressed in MCAO (miR-186-5p, miR-421-3p, miR-383-5p, miR-761; ). The results showed that miR-421-3p was the most significantly regulated by lncRNA ZFAS1. That is, the mRNA expression of miR-421-3p was inhibited by overexpressed ZFAS1 but was activated by shZFAS1 (, p < 0.001). Therefore, miR-421-3p was determined as the target miRNA in this study. We then performed verification using dual-luciferase reporter assay based on the binding sequence between miR-421-3p and ZFAS1 (). As shown in , the luciferase activity of the ZFAS1-wt+M group was significantly lower than that of the Control group (p < 0.01). Further RIP testing also confirmed the binding between miR-421-3p and ZFAS1 (, p < 0.001).
Figure 2. MiR-421-3p was confirmed to bind with ZFAS1. (A) The intersected miRNAs between ZFAS1 target miRNAs predicted by starBase database (http://starbase.sysu.edu.cn/) and differential miRNAs (GSE97532 data set) of MCAO selected by GEO (http://www.ncbi.nlm.nih.gov/geo) were obtained through a Venn diagram. (B) The up-regulated miRNAs in the intersected miRNAs were further verified by qRT-PCR to determine their regulatory relationship with ZFAS1. U6 was an internal reference. (C) The starBase showed the binding sequence of miR-421-3p and ZFAS1. (D) The dual-luciferase reporter assay verified the binding sequence of miR-421-3p and ZFAS1. (E-F) The association of miR-421-3p and ZFAS1 was verified by RNA immunoprecipitation experiment. All the experiments were repeated three times to average (n = 3). **p < 0.01, ***p < 0.001 vs NC; ###p < 0.001 vs shNC; ++p < 0.01 vs MC; &&&p < 0.001 Ago2+ MC; ^^^p < 0.001 vs IgG+M. MCAO, middle cerebral artery occlusion; MC, mimic control.
3. MiR-421-3p mimic reversed the protective effect of overexpressed ZFAS1 on OGD/R cells
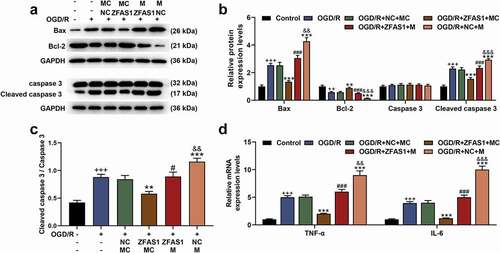
Before co-transfection, we also determined the transfection rate of miR-421-3p mimic, and the results showed that miR-421-3p mimic significantly up-regulated the expression of miR-421-3p (, p < 0.001), suggesting the successful transfection. MiR-421-3p mimic further increased the expression of miR-421-3p that had been up-regulated by OGD/R, while overexpressed ZFAS1 reversed the abovementioned regulatory effect of miR-421-3p mimic (, p<0.01). The up-regulation of miR-421-3p increased the apoptosis of cells exposed to OGD/R (, p < 0.01). MiR-421-3p mimic further promoted the up-regulated expressions of pro-apoptotic proteins (Bax, Cleaved caspase 3 as well as ratio of Cleaved caspase 3/caspase 3) and inflammatory factors (TNF-α and IL-6), while down-regulating the protein expression of Bcl-2 (, p < 0.01). Moreover, miR-421-3p mimic offset some of cytoprotective effects of OGD/R affected by the overexpression of ZFAS1 ( and , p < 0.01).
Figure 3. Up-regulation of miR-421-3p reversed the effect of overexpressed ZFAS1 on reducing the apoptosis of OGD/R-modeled cells. (A) The transfection efficiency of miR-421-3p mimic was tested by qRT-PCR. (B) The effects of miR-421-3p mimic and overexpressed ZFAS1 on the expression of miR-421-3p in OGD/R-modeled cells were detected by qRT-PCR. U6 was an internal reference. (C-D) The effects of miR-421-3p mimic and overexpressed ZFAS1 on the apoptosis of OGD/R-modeled cells were measured by flow cytometry. All the experiments were repeated three times to average (n = 3). ^^^p < 0.001 vs MC; +++p < 0.001 vs Control; **p < 0.01, ***p < 0.001 vs OGD/R+ NC+MC; ###p < 0.001 vs OGD/R+ ZFAS1+ MC; &&p < 0.01 vs OGD/R+ ZFAS1 + M.
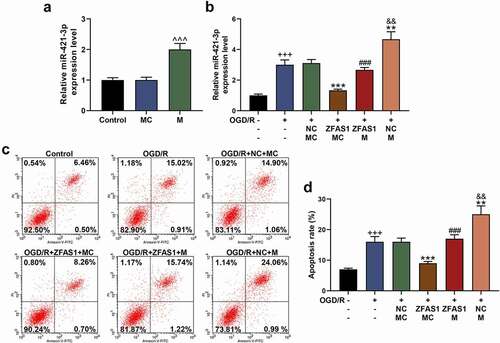
Figure 4. Up-regulation of miR-421-3p reversed the regulation of apoptosis-related proteins and inflammatory factors in OGD/R-modeled cells by overexpressed ZFAS1.
4. MEF2C was a downstream target gene of miR-421-3p and was up-regulated by overexpressed ZFAS1, but was down-regulated by miR-421-3p mimic in OGD/R cells
In this study, CPSF6, MEF2C, USF3, SRP72, FCHSD2 and ZFP26, which had lower mRNA expression in MCAO from GSE97553 database compared to sham treatment and intersected with target genes of miR-421-3p,were screened out (). We further determined the changes on the expressions of the above 6 target genes under the intervention of miR-421-3p mimic. The results showed that expression of MEF2C was markedly suppressed (, p < 0.001). Therefore, MEF2C was determined as the downstream target gene of miR-421-3p for further analyses. We first verified the targeting relationship between MEF2C and miR-421-3p based on the binding sequence predicted by the starBase database (). As shown in , the co-transfection of MEF2C-wt with miR-421-3p mimic significantly inhibited the luciferase activity of the cells (p < 0.01). In the following exploration on the regulation of expression, we found that OGD/R treatment inhibited MEF2C expression in Neuro-2a cells. The overexpression of ZFAS1 reversed the regulation of OGD/R, whilst miR-421-3p mimic further enhanced the effect of OGD/R (, p < 0.05).
Figure 5. MEF2C was a downstream gene of miR-421-3p, which bound to miR-421-3p. (A) The intersected mRNAs of the target genes of miR-421-3p were predicted by starBase database (http://starbase.sysu.edu.cn/) and miRDB database (http://mirdb.org/), and the differential mRNAs (GSE97533 dataset) of MCAO screened by GEO (http://www.ncbi.nlm.nih.gov/geo) were obtained through the Venn diagram. (B) The regulatory relationship between the intersected mRNAs and miR-421-3p mimic was further verified by qRT-PCR. GAPDH was an internal reference. (C) The starBase database showed the binding sequence of miR-421-3p and MEF2C. (D) The dual-luciferase reporter assay verified the binding sequence of miR-421-3p and MEF2C. All the experiments were repeated three times to average (n = 3). ^p < 0.05, ^^p < 0.01, ^^^p < 0.001 vs MC. MEF2C, Myocyte enhancer factor 2C
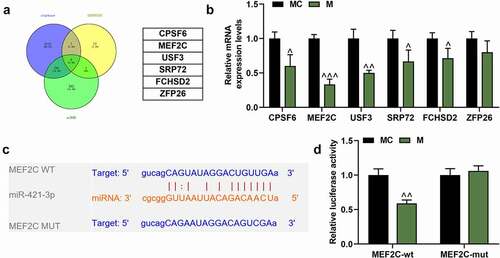
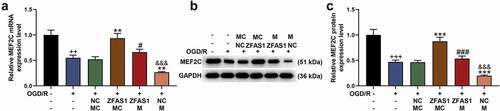
Figure 6. MEF2C was up-regulated by overexpressed ZFAS1, but was down-regulated by miR-421-3p mimic in OGD/R cells. (A) The effects of overexpressed ZFAS1 and miR-421-3p mimic on the mRNA expression of MEF2C in OGD/R-modeled cells were analyzed by qRT-PCR. GAPDH was an internal reference. (B-C) The effects of overexpressed ZFAS1 and miR-421-3p mimic on the protein expression of MEF2C in OGD/R-modeled cells were analyzed by Western blot. GAPDH was an internal reference. All the experiments were repeated three times to average (n = 3). ++p < 0.01, +++p < 0.001 vs Control; **p < 0.01, ***p < 0.001 vs OGD/R+ NC+MC; #p < 0.05, ###p < 0.001 vs OGD/R+ ZFAS1+ MC; &&&p < 0.001 vs OGD/R+ ZFAS1 + M
5. Overexpressed MEF2C reversed the pro-apoptotic and gene-regulatory effects of miR-421-3p mimic
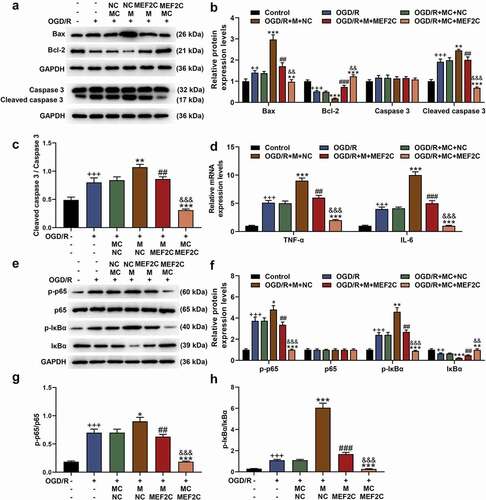
The transfection of MEF2C overexpression plasmid into Neuro-2a cells significantly upregulated the mRNA level of MEF2C (, p < 0.001). In the following detection of qRT-PCR and western blot, miR-421-3p mimic further inhibited the expression of MEF2C that had been suppressed by OGD/R, while overexpressed MEF2C reversed the abovementioned regulatory effect of miR-421-3p mimic (, p < 0.001). Overexpressed MEF2C also showed the same reversal effect in the subsequent apoptosis test (, p < 0.001). We additionally analyzed the regulatory effects of MEF2C on the levels of apoptosis-related proteins, inflammatory factors, and p65/IκBα pathway-related factors. The results showed that MEF2C overexpression reversed the downregulation of Bcl-2, activation of Bax, Cleaved caspase 3 (as well as ratio of Cleaved caspase 3/caspase 3) and p65/IκBα pathway (and ratio of p-p65/p65 and p-IκBα/IκBα), TNF-α and IL-6 caused by OGD/R (, p < 0.01). More importantly, overexpression of MEF2C reversed the effect of miR-421-3p mimic on enhancing OGD/R (, p < 0.01).
Figure 7. Overexpressed MEF2C reversed the pro-apoptotic effect of miR-421-3p mimic. (A) The transfection efficiency of MEF2C was tested by qRT-PCR. (B) The effects of overexpressed MEF2C and miR-421-3p mimic on the mRNA expression of MEF2C in OGD/R-modeled cells were analyzed by qRT-PCR. GAPDH was an internal reference. (C-D) The effects of overexpressed MEF2C and miR-421-3p mimic on the protein expression of MEF2C in OGD/R-modeled cells were analyzed by western blot. GAPDH was an internal reference. (E-F) The effects of overexpressed MEF2C and miR-421-3p mimic on the apoptosis of OGD/R-modeled cells were analyzed by flow cytometry. All the experiments were repeated three times to average (n = 3). ^^^p < 0.001 vs MC; +++p < 0.001 vs Control; ***p < 0.001 vs OGD/R+ MC+NC; ###p < 0.001 vs OGD /R + M+ NC; &&&p < 0.001 vs OGD/R+ MC+MEF2C.
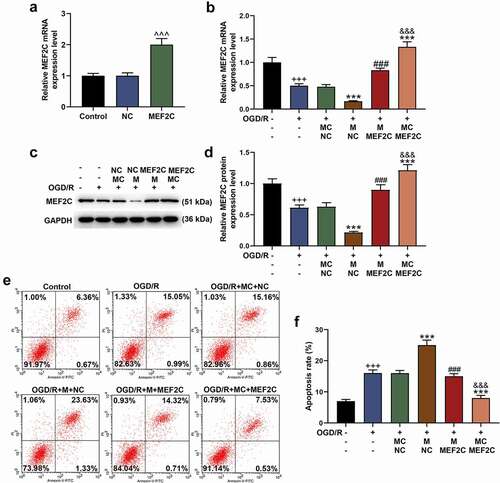
Figure 8. Overexpressed MEF2C reversed the gene regulation effect of miR-421-3p mimic. (A-C) The effects of overexpressed MEF2C and miR-421-3p mimic on the expressions of apoptosis-related proteins in OGD/R-modeled cells were detected by western blot. GAPDH was an internal reference. (D) The effects of overexpressed MEF2C and miR-421-3p mimic on the expressions of inflammatory factors in OGD/R-modeled cells were tested by qRT-PCR. GAPDH was an internal reference. (E-H) The effects of overexpressed MEF2C and miR-421-3p mimic on the p65/IκBα pathway in OGD/R-modeled cells were detected by western blot. GAPDH was an internal reference. All experiments were repeated three times to average (n = 3). ++p < 0.01, +++p < 0.001 vs Control; *p < 0.05, **p < 0.01, ***p < 0.001 vs OGD/R+ MC+NC; ##p < 0.01, ###p < 0.001 vs OGD/R + M+ NC; &&p < 0.01, &&&p < 0.001 vs OGD/R+ MC+MEF2C.
6. The results of the cellular experiment were further confirmed in animal MCAO model
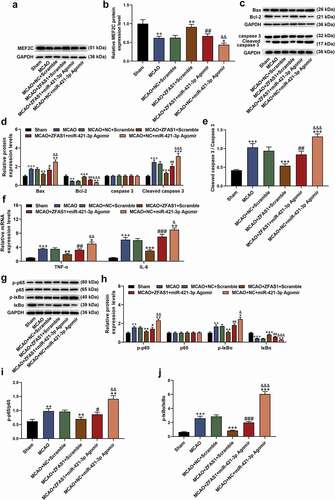
We validated the results of the cellular experiment by constructing a MCAO mouse model and administrated with overexpression plasmid of ZFAS1 and miR-421-3p Agomir via tail vein. As shown in , the expression of ZFAS1 in the brain tissues of MCAO-modeled mice was suppressed, but the level of miR-421-3p was up-regulated (, p < 0.001). However, treatment with ZFAS1 overexpression plasmid and miR-421-3p Agomir reversed and enhanced the above regulatory effects, respectively (, p < 0.01). In the results of TTC staining, the white infarct area in the brain tissues of the MCAO-modeled mice was significantly increased. After the overexpression of ZFAS1, the proportion of infarcts in the entire brain tissues was greatly reduced, whilst the overexpression of miR-421-3p aggravated the brain tissue infarction induced by MCAO (, p < 0.05). Consistent with in vitro studies, ZFAS1 overexpression alleviated MCAO-induced apoptosis, whereas miR-421-3p overexpression promoted cell loss (, p < 0.05). We also determined the changes on the expression of MEF2C, apoptosis- and p65/IκBα pathway-related proteins, and inflammatory factors in the brain tissues. Although MCAO treatment blocked the activity of MEF2C and Bcl-2 proteins in brain tissues, it activated the pathways of Bax, Cleaved caspase 3 (and ratio of Cleaved caspase 3/caspase 3), TNF-α, IL-6, and p-p65/p-IκBα (and ratio of p-p65/p65 and p-IκBα/IκBα) (, p < 0.01). The aforementioned regulatory effects on genes were effectively alleviated after the treatment of overexpressed ZFAS1, while miR-421-3p mimic further enhanced the regulatory effects of MCAO (, p < 0.05). Furthermore, miR-421-3p agomir partially neutralized the effects of overexpressed ZFAS1 ( and , p < 0.05).
Figure 9. Overexpressed ZFAS1 reduced brain tissue infarction and apoptosis caused by MCAO, while miR-421-3p mimic had the opposite effect. (A) The effects of overexpressed ZFAS1 or miR-421-3p on the expression of ZFAS1 in the brain tissues of MCAO-modeled mice were tested by qRT-PCR. GAPDH was an internal reference. (B) The effects of overexpressed ZFAS1 or miR-421-3p on the expression of miR-421-3p in the brain tissues of MCAO-modeled mice were detected by qRT-PCR. GAPDH was an internal reference. (C-D) The effects of overexpressed ZFAS1 or miR-421-3p on the infarct area in the brain tissues of MCAO-modeled mice were observed and analyzed by TTC staining. (E-F) The effects of overexpressed ZFAS1 or miR-421-3p on cell apoptosis in the brain tissues of MCAO-modeled mice were observed and analyzed by TUNEL staining. n = 5. ++p < 0.01, +++p < 0.001 vs Sham; *p < 0.05, **p < 0.01, ***p < 0.001 vs MCAO+ZFAS1+ Scramble; ##p < 0.01, ###p < 0.001 MCAO+ZFAS1+ Scramble; &p < 0.05, &&p < 0.01, &&&p < 0.001 vs MCAO+ZFAS1+ miR421-3p Agomir.
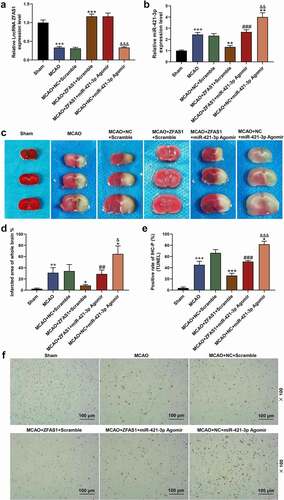
Figure 10. Overexpressed ZFAS1 reversed the gene regulation effect caused by MCAO, while miR-421-3p mimic had the opposite effect. (A-B) The effects of overexpressed ZFAS1 or miR-421-3p on the expression of MEF2C in the brain tissues of MCAO-modeled mice were detected by western blot. GAPDH was an internal reference. (C-E) The effects of overexpressed ZFAS1 or miR-421-3p on apoptosis-related proteins in the brain tissues of MCAO-modeled mice were determined via western blot. GAPDH was an internal reference. (F) The effects of overexpressed ZFAS1 or miR-421-3p on inflammatory factors in brain tissues of MCAO-modeled mice were tested by qRT-PCR. GAPDH was an internal reference. (G-J) The effects of overexpressed ZFAS1 or miR-421-3p on the p65/IκBα pathway in the brain tissues of MCAO-modeled mice were detected by western blot. GAPDH was an internal reference. n = 5. ++p < 0.01, +++p < 0.001 vs Sham; *p < 0.05, **p < 0.01, ***p < 0.001 vs MCAO+ZFAS1+ Scramble; #p < 0.05, ##p < 0.01, ###p < 0.001 MCAO+ZFAS1+ Scramble; &p < 0.05, &&p < 0.01, &&&p < 0.001 vs MCAO+ZFAS1+ miR-421-3p Agomir.
Discussion
The ischemia in brain tissues could cause local cerebral ischemic injury. Reperfusion of the ischemic area due to treatment or the body’s compensation mechanism can lead to further damage to tissues and organs, which is referred to as ischemia reperfusion injury [Citation21]. Secondary injuries and complications will also seriously affect the life quality of patients [Citation22]. To better improve the clinical therapeutic effect, the ameliorative effect of ZFAS1 on cerebral ischemia reperfusion injury was examined. The up-regulation of ZFAS1 effectively attenuated the cellular damage caused by OGD/R and reduced cerebral infarction induced by MCAO in mice. At the molecular level, overexpression of ZFAS1 prevented the excessive activation of pro-apoptotic genes (Bax and cleaved caspase 3), inflammatory factors (TNF-α and IL-6) and the p65/IκBα inflammatory pathway, while activating the previously inhibited apoptosis factor Bcl-2. These data suggested that ZFAS1 may be a potential marker of cerebral ischemia-reperfusion injury. As such, the pathway via which ZFAS1 exerted its effects was further analyzed.
The functions of lncRNA are widely studied with the competitive endogenous RNAs (ceRNAs) [Citation23]. Long nucleotide fragments of lncRNAs provide a solid basis for the adsorption and binding of a great number of miRNAs. LncRNAs bind to a large number of miRNAs in the cell through competition, acting as a sponge and reducing the ability of miRNAs to interfere with the protein encoded by target gene mRNA [Citation23,Citation24]. Therefore, we predicted the target miRNA of ZFAS1 through bioinformatics analysis, and finally screened out miR-421-3p which was present from the 3ʹend arm of miR-421 precursor. Currently, there are only few studies on miR-421-3p. It has been confirmed that miR-421-3p can bind to the 3ʹUTR region of mTOR, and upregulation of miR-421-3p increases the autophagy of macrophages [Citation25]. Our research fully confirmed the binding of miR-421-3p and ZFAS1, and revealed that miR-421-3p can further aggravate the damage and inflammation in tissue and cell caused by cerebral ischemia-reperfusion. In addition to miR-421-3p, we also screened out miRNAs such as miR-186-5p, miR-383-5p and miR-761, all of which were also regulated by ZFAS1. Both miR-186-5p and miR-383-5p were found to be up-regulated in MCAO/R animal models or OGD/R cell models [Citation26,Citation27], while miR-761 was reported to be down-regulated in hypoxia/reoxygenation-induced HL-1 cells [Citation28]. In addition, the targeting relationship between miR-186-5p/miR-761 and ZFAS1 was also proved in N2a cells induced by OGD/R and HL-1 cells induced by hypoxia/reoxygenation [Citation28,Citation29].
Further screening and verification of mRNAs demonstrated that among the mRNAs screened, the level of MEF2C changed most obviously after being regulated by miR-421-3p. The MEF2C gene is an important member of the MADS-Box transcription regulator family and a specific transcription factor that can bind to the A/T-rich DNA sequence to regulate the expressions of related genes. Studies have shown that MEF2C is the core transcription factor for cardiac development [Citation30,Citation31]. Abnormal expression of MEF2C induces abnormal development of the heart and blood vessels, leading to the death of mice in the embryo. Yuqi Yang et al. found that MEF2C is expressed in the hippocampus and cortex of rat, whereas MCAO significantly reduces the expression of MEF2C, indicating that MEF2C may play an important role in MCAO [Citation32]. MEF2C also has a wide range of regulatory effects on cellular apoptosis and inflammation [Citation33]. These reports confirmed the results of this study that MEF2C expression in OGD/R-modeled cells was up-regulated by ZFAS1 but down-regulated by miR-421-3p. More importantly, MEF2C alleviated the cellular damage caused by OGD/R and neutralized the regulatory effect of miR-421-3p. Our experimental results herein revealed that ZFAS1 alleviated the damage to tissues and cells resulted from cerebral ischemia-reperfusion by regulating the lncRNA ZFAS1/miR-421-3p/MEF2C axis.
In addition, according to our results, ZFAS1 regulated the apoptosis and inflammation of tissues and cells through the lncRNA ZFAS1/miR-421-3p/MEF2C axis. Consistent with a previous report [Citation34], up-regulation of Bcl-2 inhibited apoptosis and blocked the expressions of pro-apoptotic genes (Bax and Cleaved caspase 3), thereby reducing the apoptosis of Neuro-2a cells, in addition to the suggestion that ZFAS1 blocked the p65/IκBα pathway, down-regulated the expressions of TNF-α and IL-6 in tissues and cells, and alleviated the excessive activation of the inflammatory response. Similar results have also been reported in the researches of Li, Liu et al. [Citation35,Citation36].
However, this study still has some shortcomings. We used Neuro-2a cells as the subject of experiments in vitro in our study. Although OGD/R-treated Neuro-2a cells are widely used in cell models which mimic cerebral I/R injury [Citation37,Citation38], the use of primary neuronal cells can reflect the experimental results in a more reliable manner. In addition, among other target miRNAs of ZFAS1 we screened, the mechanism of ZFAS1/miR-186-5p axis and ZFAS1/miR-761 axis in I/R injury has been reported [Citation28,Citation29], but whether ZFAS1/miR-383-5p axis also plays a role in I/R injury and its related mechanism need to be further studied.
Conclusion
In summary, we confirm that lncRNA ZFAS1/miR-421-3p/MEF2C axis regulates apoptosis and inflammatory response in cerebral ischemia-reperfusion injury based on the results of this study, suggesting that lncRNA ZFAS1 may be the potential marker of cerebral ischemia-reperfusion injury. Our research only elucidates the protective effect of lncRNA ZFAS1 at a basic level, an in-depth research is therefore required to further confirm the current findings.
Disclosure statement
No potential conflict of interest was reported by the author(s).
Additional information
Funding
References
- Perju-Dumbravă L, Muntean ML, Muresanu DF. Cerebrovascular profile assessment in Parkinson’s disease patients. CNS Neurol Disord Drug Targets. 2014;13(4):712–717.
- Chen XM, Chen HS, Xu MJ, et al. Targeting reactive nitrogen species: a promising therapeutic strategy for cerebral ischemia-reperfusion injury. Acta Pharmacol Sin. 2013;34(1):67–77.
- Liu Y, Nakamura T, Toyoshima T, et al. Ameliorative effects of yokukansan on behavioral deficits in a gerbil model of global cerebral ischemia. Brain Res. 2014;1543:300–307.
- Yan Y, Min Y, Min H, et al. n-Butanol soluble fraction of the water extract of Chinese toon fruit ameliorated focal brain ischemic insult in rats via inhibition of oxidative stress and inflammation. J Ethnopharmacol. 2014;151(1):176–182.
- Guan J, Li H, Lv T, et al. Bone morphogenetic protein-7 (BMP-7) mediates ischemic preconditioning-induced ischemic tolerance via attenuating apoptosis in rat brain. Biochem Biophys Res Commun. 2013;441(3):560–566.
- Amani H, Mostafavi E, Alebouyeh MR, et al. Would colloidal gold nanocarriers present an effective diagnosis or treatment for ischemic stroke? Int J Nanomedicine. 2019;14:8013–8031.
- Xu J, Bai J, Zhang X, et al. A comprehensive overview of lncRNA annotation resources. Brief Bioinform. 2017;18(2):236–249.
- Robinson EK, Covarrubias S, Carpenter S. The how and why of lncRNA function: an innate immune perspective. BBA Gene Regul Mech. 2020;1863(4):194419.
- Kopp F, Mendell JT. Functional classification and experimental dissection of long noncoding RNAs. Cell. 2018;172(3):393–407.
- Wang J, Cao B, Han D, et al. Long non-coding RNA H19 induces cerebral ischemia reperfusion injury via activation of autophagy. Aging Dis. 2017;8(1):71–84.
- Zhong Y, Yu C, Qin W. LncRNA SNHG14 promotes inflammatory response induced by cerebral ischemia/reperfusion injury through regulating miR-136-5p /ROCK1. Cancer Gene Ther. 2019;26(7–8):234–247.
- Askarian-Amiri ME, Crawford J, French JD, et al. SNORD-host RNA Zfas1 is a regulator of mammary development and a potential marker for breast cancer. RNA. 2011;17(5):878–891. (New York, NY).
- Nie F, Yu X, Huang M, et al. Long noncoding RNA ZFAS1 promotes gastric cancer cells proliferation by epigenetically repressing KLF2 and NKD2 expression. Oncotarget. 2017;8(24):38227–38238.
- Tan C, Cao J, Chen L, et al. Noncoding RNAs serve as diagnosis and prognosis biomarkers for hepatocellular carcinoma. Clin Chem. 2019;65(7):905–915.
- Jiao L, Li M, Shao Y, et al. lncRNA-ZFAS1 induces mitochondria-mediated apoptosis by causing cytosolic Ca(2+) overload in myocardial infarction mice model. Cell Death Dis. 2019;10(12):942.
- Wang J, Ruan J, Zhu M, et al. Predictive value of long noncoding RNA ZFAS1 in patients with ischemic stroke. Ann Clin Exp Hypertens. 2019;41(7):615–621. (New York, NY: 1993).
- Zhang Y, Zhang Y. lncRNA ZFAS1 improves neuronal injury and inhibits inflammation, oxidative stress, and apoptosis by sponging miR-582 and upregulating NOS3 expression in cerebral ischemia/reperfusion injury. Inflammation. 2020;43(4):1337–1350.
- Diao Y, Yan W, Sun W, et al. The dual role of KCNQ/M channels upon OGD or OGD/R insults in cultured cortical neurons of mice: timing is crucial in targeting M-channels against ischemic injur ies. J Cell Physiol. 2019;234(8):12714–12726.
- Ciesielska A, Stączek P. Selection and validation of reference genes for qRT-PCR analysis of gene expression in Microsporum canis growing under different adhesion-inducing conditions. Sci Rep. 2018;8(1):1197.
- Yan H, Yuan J, Gao L, et al. Long noncoding RNA MEG3 activation of p53 mediates ischemic neuronal death in stroke. Neuroscience. 2016;337:191–199.
- Wu R, Li X, Xu P, et al. TREM2 protects against cerebral ischemia/reperfusion injury. Mol Brain. 2017;10(1):20.
- Wu XJ, Sun XH, Wang SW, et al. Mifepristone alleviates cerebral ischemia-reperfusion injury in rats by stimulating PPAR γ. Eur Rev Med Pharmacol Sci. 2018;22(17):5688–5696.
- Zhu J, Fu H, Wu Y, et al. Function of lncRNAs and approaches to lncRNA-protein interactions. Sci China Life Sci. 2013;56(10):876–885.
- Tay Y, Rinn J, Pandolfi PP. The multilayered complexity of ceRNA crosstalk and competition. Nature. 2014;505(7483):344–352.
- Wang J, Rong Y, Ji C, et al. MicroRNA-421-3p-abundant small extracellular vesicles derived from M2 bone marrow-derived macrophages attenuate apoptosis and promote motor function recovery via inhibition of mTOR in spinal cord injury. J Nanobiotechnology. 2020;18:72.
- Chen Y, Liu W, Chen M, et al. Up-regulating lncRNA OIP5-AS1 protects neuron injury against cerebral hypoxia-ischemia induced inflammation and oxidative stress in microglia/macrophage through activating CTRP3 via sponging miR-186-5p. Int Immunopharmacol. 2021;92:107339.
- Takuma A, Abe A, Saito Y, et al. Gene expression analysis of the effect of ischemic infarction in whole blood. Int J Mol Sci. 2017;18(11) :2335.
- Xiang X, Zheng L, Li X. Silencing of long noncoding RNA zinc finger antisense 1 protects against hypoxia/reoxygenation-induced injury in HL-1 cells through targeting the miR-761/cell death inducing p53 target 1 axis. J Cardiovasc Pharmacol. 2020;76(5):564–573.
- Shen B, Wang L, Xu Y, et al. Long non-coding RNA ZFAS1 exerts a protective role to alleviate oxygen and glucose deprivation-mediated injury in ischemic stroke cell model through targeting miR-186-5p/MCL1 axis. Cytotechnology. 2021;73(4):605–617.
- Vong LH, Ragusa MJ, Schwarz JJ. Generation of conditional Mef2cloxP/loxP mice for temporal- and tissue-specific analyses. Genesis. 2005;43(1):43–48. (New York, NY: 2000).
- Ieda M, Fu JD, Delgado-Olguin P, et al. Direct reprogramming of fibroblasts into functional cardiomyocytes by defined factors. Cell. 2010;142(3):375–386.
- Yang Y, Chen L, Si J, et al. TGF-β3/Smad3 contributes to isoflurane postconditioning against cerebral ischemia-reperfusion injury by upregulating MEF2C. Cell Mol Neurobiol. 2020;40(8):1353–1365.
- Patel R, Varghese JF, Singh RP, et al. Induction of endothelial dysfunction by oxidized low-density lipoproteins via downregulation of Erk-5/Mef2c/KLF2 signaling: amelioration by fisetin. Biochimie. 2019;163:152–162.
- Zhang Y, Yang X, Ge X, et al. Puerarin attenuates neurological deficits via Bcl-2/Bax/cleaved caspase-3 and Sirt3/SOD2 apoptotic pathways in subarachnoid hemorrhage mice. Biomed Pharmacothe. 2019;109:726–733.
- Li X, Wu D, Hu Z, et al. The protective effect of ligustilide in osteoarthritis: an in vitro and in vivo study. Cell Physiol Biochem. 2018;48(6):2583–2595.
- Liu H, Ma S, Xia H, et al. Anti-inflammatory activities and potential mechanisms of phenolic acids isolated from Salvia miltiorrhiza f. alba roots in THP-1 macrophages. J Ethnopharmacol. 2018;222:201–207.
- Wu JY, Li M, Cao LJ, et al. Protease Omi cleaving Hax-1 protein contributes to OGD/R-induced mitochondrial damage in neuroblastoma N2a cells and cerebral injury in MCAO mice. Acta Pharmacol Sin. 2015;36(9):1043–1052.
- Liu J, Huang Y, He J, et al. Olfactory mucosa mesenchymal stem cells ameliorate cerebral ischemic/reperfusion injury through modulation of UBIAD1 expression. Front Cell Neurosci. 2020;14:580206.