
ABSTRACT
The present study aimed to explore the involved lncRNA-miRNA-mRNA network in the cell cycle and proliferation after conventional treatments in Luminal A breast cancer patients.The candidate miRNAs (miRs), lncRNAs, and mRNAs were first taken from the Gene Expression Omnibus and TCGA databases. The lncRNA–miR–mRNA network was then constructed using the high-throughput sequencing data. The expression levels of selected targets were measured in the breast cancer and healthy samples by the Real-Time PCR technique and compared with the clinical outcomes by the Kaplan-Meier method.Our analysis revealed a group of differentially expressed 3 lncRNAs, 9 miRs, and 14 mRNAs in breast cancer patients. A significant expression decrease of the selected tumor suppressor lncRNAs, miRs, and genes and a substantial expression increase of the selected onco-lncRNAs, oncomiRs, and oncogenes were obtained in the patients compared to the healthy group. The plasma levels of the lncRNAs, miRs, and mRNAs were more significant after the operation, chemotherapy, and radiotherapy than the pre-treatment. The Kaplan-Meier analysis indicated that the patients with a high expression of miR-21, miR-20b, IGF1R, and E2F2 and a low expression of miR-125a, PDCD4, and PTEN had exhibited a shorter overall survival rate.Our results suggested that the underlying mechanisms of the lncRNA, miRs, and mRNAs and relevant signaling pathways may be considered predictive and therapeutic targets for breast cancer.
Introduction
Non-coding RNAs have central roles in regulating specific genes’ expression and may involve breast cancer’s primary biological processes. They can play vital roles in regulating various biological processes, including cell growth, apoptosis, and stem cell differentiation [Citation1]. Thus, they can be considered potential prognostic and diagnostic biomarkers, therapeutic targets, and treatment-response predictors for human cancers. Recent studies have suggested that lncRNAs interact with microRNAs (miRs) and modulate their availability for endogenous mRNA targets. Besides, they can show a particularly tissue-specific or cell-type-specific expression pattern. Thus, elucidating the function of lncRNAs in normal and cancerous cells will be one of the following milestones for understanding the molecular mechanisms of cancer. Interestingly, it has been reported that lncRNAs can also compete with miRs by binding directly to mRNAs [Citation2,Citation3]. This issue suggests a complex interaction between lncRNAs and miRs that can eventually determine the stability and translation of coding protein mRNAs.
Likewise, the aberrant expression of miRs in cell proliferative and cell cycle regulatory pathways is also attributed to resistance to breast cancer treatments to suppress cell growth and proliferation. It is hypothesized that interplay between lncRNAs and miRs might comparatively elucidate the cell-type-specific outcomes. Therefore, given this evidence, it has appeared that the abundance of lncRNAs may ultimately determine the effects of miRs on the expression of protein-coding genes. Generally, the interplay between lncRNAs and miRs at the intracellular and intercellular levels may provide a framework for understanding tissue-specific phenomena in cancer. Subsequently, the interaction between lncRNAs and miRs may affect the signaling cascades by regulating the abundance of proteins in these pathways in a cell-specific manner. This putative mechanism, acting on the intracellular level, can also be extended to the communication between different cells. Hence, cell proliferation and cell cycle mechanisms may be partly explained by the interaction of miRs and lncRNAs. Although there is no direct experimental evidence for this hypothesis, theoretical evidence demonstrates how this interaction could contribute to cell proliferation in specific tissues.
Overall, monitoring the miRs, lncRNA, and target genes during the treatment can be an appropriate diagnostic tool for estimating the identification and efficacy of therapeutic approaches. However, no significant progress has been made toward screening and monitoring cancer patients [Citation4]. Several studies have shown that interactions among lncRNAs, miRs, and target genes can be used as sensitive and specific indicators for identifying different diseases, including cancer [Citation5]. A better understanding of underlying mechanisms of interactions among them, relevant signaling pathways, and ultimately their impacts on cell function in future studies will better diagnose and identify potential sites for more selective tumor therapy in human cancers. Thus, it is worthwhile to thoroughly characterize the mechanisms underlying breast cancer’s aggressive characteristics for developing novel targets such as non-coding RNAs for the diagnosis and treatment. Here, we aimed to explore the involved lncRNA-miR-mRNA network in the cell cycle and proliferation after surgery and chemo-radiotherapy in breast cancer. Using bioinformatics and experimental methods, we evaluated their prognostic values regarding patients’ clinical outcomes, such as the 5-year overall survival rate.
Materials and methods
The data collection of breast cancer datasets
The platforms used for miRs and mRNAs, including the miRs’ expression profile (GSE81000 and GSE44124) and the mRNAs’ expression profile (GSE42568 and GSE65194) were downloaded from the Gene Expression Omnibus (GEO) database (https://www.ncbi.nlm.nih.gov /geo). GSEs’ data were downloaded for use with the GEOquery R package (https://bioconductor.org/ packages/GEOquery) [Citation6]. We analyzed the selected lncRNAs, miRs, and genes with P-value < 0.05 and |LogFC| > 1 in the datasets as differentially expressed genes (DEGs), differentially expressed miRNAs (DEMs), and differentially expressed lncRNAs (DELs). Moreover, the GEPIA2 (http://gepia2.cancer-pku.cn), the cBioPortal (https://www.cbioportal.org), and the Broad Institute’s FireBrowse (http://firebrowse.org) are websites for analyzing the differential expression genes from the TCGA and Genotype-Tissue Expression projects [Citation7]. The used platforms for miRs included the OncomiR (http:// www.oncomir.umn.edu/omcd/), miRGator 3.0 (https://tools4mirs.org), and miRCancerdb (http://mircancer.ecu.edu) databases of TCGA dataset [Citation8]. The used databases for lncRNAs included LncRNADisease (http://www.rnanut.net/ lncrnadisease) and Lnc2Cancer v3.0 (http://bio-bigdata.hrbmu.edu.cn/lnc2cancer) of TCGA dataset [Citation9,Citation10]. Furthermore, we used the Tumor Immune Estimation Resource (TIMER) and Cancer Cell Lines Encyclopedia (CCLE) to determine DEGs between breast cancer and normal tissues. The DiffExp module in the TIMER database (https://cistrome.Shinyapps.io/ timer) determined differential expression patterns between normal and tumor tissues for DEGs in all TCGA tumors [Citation11]. The CCLE database (https://portals.broadinstitute.org/ccle) explored the expression of DEGs in breast cancer cell lines [Citation11]. shows a flowchart diagram for used bioinformatics analysis.
Figure 1. A flowchart diagram for used bioinformatics analysis in the present study.
The prediction of target genes and lncRNAs of candidate miRs
The target genes of miRs were identified by using the online predictive program, such as the miRmap (https://mirmap.ezlab.org/app/) [Citation12], miRWalk2 (http://zmf.umm.uni-heidelberg.de/apps/zmf/mirwalk2/) [Citation13], and Targetscan Release 7.0 (http://www.targetscan.org) [Citation14]. Furthermore, the lncRNAs which regulate DEMs were collected by the LncRNA2target and TANRIC datasets.
The analysis of GO term pathways by the FunRich dataset
The pathway enrichment analyses of the GO database were executed through the FunRich dataset. Likewise, the same genes were explored for pathway enrichment using the g: Profiler tool (http://biit.cs.ut.ee/gprofiler) [Citation15]. The lncRNA-miR-mRNA network was built using the Cytoscape software.
Construction and analysis of the lncRNA–miR–mRNA network
The lncRNA–miR–mRNA network was constructed and visualized using Cytoscape software based on the ceRNA theory [Citation16]. The nodes and edges were used to represent extensive biological data. Each node represents a biological molecule, and the edges stand for the interactions between nodes and their degrees. The number of edges was calculated to exploit the hub nodes that possess essential biological functions [Citation17]. To explore the structure and feature of the lncRNA–miR–mRNA competing triplets, a network analysis was performed using a Cytoscape plug-in called “Network Analyzer” [Citation18].
Correlation analysis between lncRNAs, miRs, and mRNAs in breast cancer
The correlation coefficient was calculated among lncRNAs, miRs, and mRNAs. The absolute value of the correlation coefficient equal to or more than 0.5 represented a significant correlation. The interacting miRs were matched according to the miR-code database (http://www.mircode.org/) using the differentially expressed lncRNA and miRs from the above analysis. The databases of the TargetScan (http://www.targetscan. org /vert_72/), miRDB (http://mirdb.org/), and miRTarBase (http://mirtarbase.mbc.nctu.edu.tw/php/ index .php) were used to predict the miRs’ target genes.
Experimental sample collection
The lncRNAs, miRs, and mRNAs were evaluated in 10 healthy plasma samples and 120 breast cancer patient samples (Luminal A; ER+, PR+, Her2−, and ki-67 < 15%) before and after the conventional treatments. Non-inclusion criteria were: evidence of metastatic breast cancer, planning to receive any additional neoadjuvant chemotherapy, and pregnant or breastfeeding. The patients’ characteristics included age, T classification, nodal status, Her2-, hormone-receptor-positive status, and tumor subtypes. Moreover, the second, third, and fourth samples were collected one week before chemo-radiotherapy and one month after the last radiotherapy session [Citation19]. Written informed consent was obtained from each participant before the sample collection.
Real-time PCR analysis
Total RNA was extracted from the plasma samples (250 μl) and added to 750 μl TRIzol (Beijing Tiangen Biotech Co., Ltd.). RNA extraction was carried out according to the manufacturer’s instructions. The absorbance ratio (A260/280) of total RNA, between 1.8 and 2.2, was determined using an ultraviolet (UV) spectrophotometer. The miRcute miRNA cDNA First-Strand Synthesis kit (Beijing Tiangen Biotech Co., Ltd.) for miRNAs quantification and the cDNA Synthesis Kit Manual (TAKARA BIO INC. Cat. 6 30 v.0708) for genes and lncRNAs quantification were used according to the manufacturer’s recommendations. Then, cDNA was then used in each of the real-time PCR assays with the miRcute miRNA Fluorescence Quantitative Detection kit (Tiangen Biotech Co., Ltd.) for miRs. The cycling conditions were as follows: pre-denaturation at 94°C for 2 min, followed by 40 cycles of 94°C for 20s and 60°C for 34s. The SYBR Green method (AccuPower Green Star qPCR Master Mix; Bioneer, Korea) was used for genes and lncRNAs. PCR cycling was performed as follows: one cycle at 95°C for 10 min, 40 cycles at 95°C for 20 seconds, and 60°C for 45 seconds. The melting curve analysis was run from 60°C to 95°C to confirm specific amplification [Citation20,Citation21]. The expression of U6 and B-actin was used to normalize miRs, lncRNAs, and genes as the Internal Reference Gene. The list of primers has shown in . The qRT-PCR reactions were performed using an ABI StepOne plus System (Applied Biosystems; Thermo Fisher Scientific, Inc.). The expression level of the selected lncRNAs, miRs, and mRNAs were calculated using the – ΔCT method. The ΔCT was calculated by subtracting the CT values of U6 and B-actin from the CT values of the targets [Citation22,Citation23].
Table 1. The list of primers for Real-Time PCR.
Clinical outcomes
We evaluated the association of the expression levels of candidate lncRNAs, miRs, and mRNAs with the clinicopathological feature of the patients. The 5-year overall survival (OS) was measured by the Kaplan-Meier method.
Data analysis
The sample size was calculated based on a study by Chen et al. (2016) and according to the differences in expression of miR-21 in healthy subjects and patients with breast cancer [Citation20]. With considering the alpha error of less than 0.05 (α) and the research power of 95% (1-β), the sample size was obtained approximately 30 in each group. G Power software version 3 (pmid:17,695,343) was used to estimate the sample size. The data analyses were performed by GraphPad Prism 7.0. Kolmogorov-Smirnov was used to evaluate the natural distribution of data. We used the t-test and the Mann-Whitney to analyze the parametric and non-parametric data in two groups. A repaid measured ANOVA to calculate the intra-group data. To evaluate the value of circulating lncRNAs, miRs, and mRNAs in predicting relapse, receiver operating characteristics (ROC) curves were constructed, and the area under the curve (AUC) was calculated. The five-year overall survival rate of candidate lncRNAs, miRs, and mRNAs was evaluated using the Kaplan-Meier method. All data were presented as mean ± SD. A p-value < 0.05 was considered to be statistically significant.
Results
Identification of DEGs
GEO and TCGA datasets were analyzed to identify differentially expressed lncRNAs, miRs, and genes in breast cancer and healthy samples. FunRich_3.1.3 software made a Venn diagram and extracted the common selected datasets (). 156 miRs (36 up-regulation and 120 down-regulation) (), 2060 mRNAs (891 up-regulation and 1169 down-regulation) (), and 169 lncRNAs (102 up-regulation and 67 down-regulation) () were obtained from the selected datasets. The top up-regulated miRs were miR-21, miR-20a, and miR-20b, and the top down-regulated miRs were miR-145, miR-196b, and miR-125a (). The target genes of selected miRs have been represented in (). Likewise, the lncRNAs of selected miRs were obtained using the LncRNADisease, Lnc2Cancer v3.0, LncRNA2target, and TANRIC datasets ().
Figure 2. Venn diagram of the differently expressed lncRNAs, miRs, and mRNAbetween GEO and TCGA datasetsAllocation of (a) the 156 differently expressed miRs (36 up-regulation and 120 down-regulation), (b) 2060 differently expressed genes (891 up-regulation and 1169 down-regulation), and (c) the 169 differently expressed lncRNAs (102 up-regulation and 67 down-regulation) found between the used datasets in the present study.
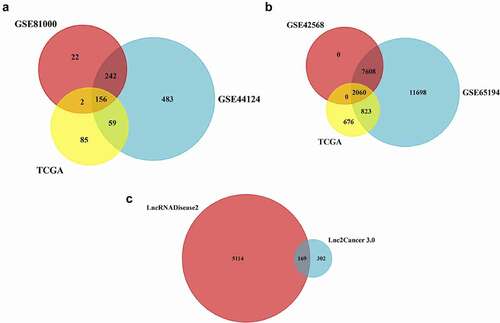
Table 2. The candidate miRs involved in the cell cycle and proliferation pathways in breast cancer patients.
Table 3. The predicted genes involved in the cell cycle and proliferation pathways in breast cancer patients.
Table 4. The candidate genes in breast cancer patients.
Table 5. The list of candidate genes involved in cell cycle and proliferation pathways in breast cancer patient.
Table 6. Interaction analysis between selected miRs and lncRNAs involved in cell cycle and proliferation pathways in breast cancer patients.
We also used TIMER and CCLE databases to reveal the transcriptional expressions of the selected DEGs (). We determined the distributions of gene expression levels using the TIMER database displayed in a box plot (). In addition, we studied the expression levels of the selected DEGs in breast cancer cell lines using the CCLE database ().
Figure 3. The expression of the candidate genes in breast cancer(a) A box plot of the candidate genes’ transcripts in normal and breast cancer tissues in the TIMER database. Statistical significance was calculated using the Wilcoxon test, *** p < 0.00.
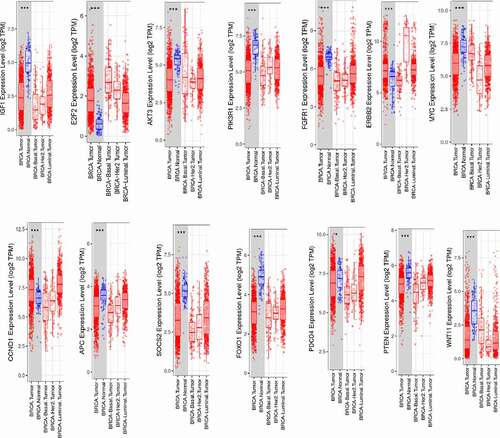
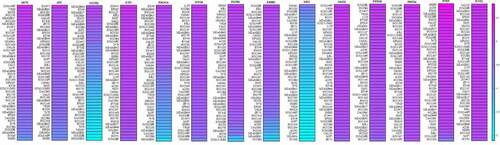
Figure 4. A heatmap of the genes’ expression in breast cancer cell lines (CCLE). We used mRNA expression values from the CCLE database and then ranked them. In CCLE, purple represents overexpression (top column), and blue indicates under-expression (bottom column).
Enrichment analysis of DEGs
To examine the biological function of the DEGs, GO analysis was performed in the FunRich software. The DEGs were mainly enriched in the receptor binding, protein serine/threonine kinase activity, growth factor activity, transcription factor activity, kinase regulator activity, and DNA repair protein (). Furthermore, up-regulated DEGs were exclusively enriched in the pathways, including the EGF receptor signaling and the Glypican pathway and the FGFR signaling pathway (). The most significantly enriched pathways associated with cancer were VEGF, MAPK, ERBB, RAP1, and RAS signaling pathways (). However, down-regulated DEGs were mainly enriched in the pathways, including the mTOR, P53, IGF1, and ATM (). Likewise, the functional enrichment of DEG genes was analyzed using the g: Profiler software ().
Figure 5. The enrichment analysis of the GO pathway of the DEGs (a) Top 7 functional network/pathways associated with the up-regulated DEGs through GO analysis with a p-value less than 0.05. (b) Top 7 functional network/pathways related to the down-regulated DEGs through GO analysis with a p-value less than 0.05.
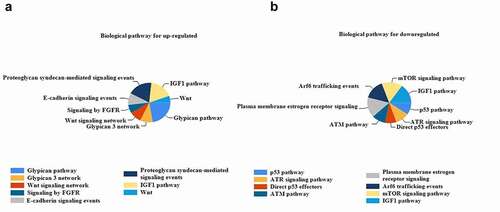
Figure 6. Functional enrichment by using the g: Profiler software (a) the X-axis shows the functional terms grouped and color-coded by the data source. (B, C, and F) the position of terms in the plots fixed and terms from the same branch (GO). (d) p-values in the table outputs are color-coded from yellow (insignificant) to blue (highly significant). (e) in a multi-query case, the same term is highlighted on other plots. (g) a click allows for pinning the circles to the plot together with a numeric ID, creating a more detailed result in the table below the image.
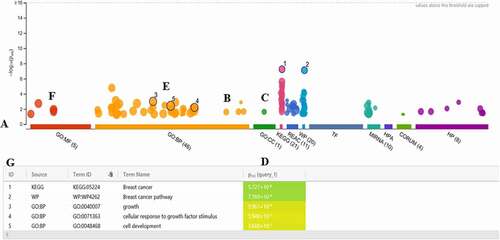
Table 7. The GO enrichment analysis for DEGs.
PPI network analysis of DEGs
PPI analysis of DEGs was performed in the FunRich software. Two significant modules with a score ≥ 7 were screened out via the FunRich software. BRAF1, PIK3R1, TGFBR2, EGFR, IGF1R, RAF1, VEGF, TWIST, and NOTCH were hub nodes with higher node degrees in module 1 (), and ESR1, BRCA1, HOXD11, RB1, GSK3B, SP1, TP53, and SOS1 were hub nodes in module 2 (). Furthermore, VEGF, TGFBR2, TWIST, HMGA1, NOTCH, and HOXD11 hub genes were selected for further analysis owing to the high degree of connectivity (). As described in the method section, we identified 3 co-expression lncRNAs, 9 co-expression miRs, and 14 co-expression mRNAs selected to construct the lncRNA–miR–mRNA network ().
Figure 7. Protein-protein interaction (PPI) network constructionPPI network was constructed with the DEGs from the four datasets of GEO and TCGA. (a-b) The significant module was identified from the PPI network using the FunRich method with ≥ 7. Panel A shows module 1 of up-regulated genes. Panel B shows module 2 of down-regulated genes. Panel C shows the interaction between modules 1 and 2.
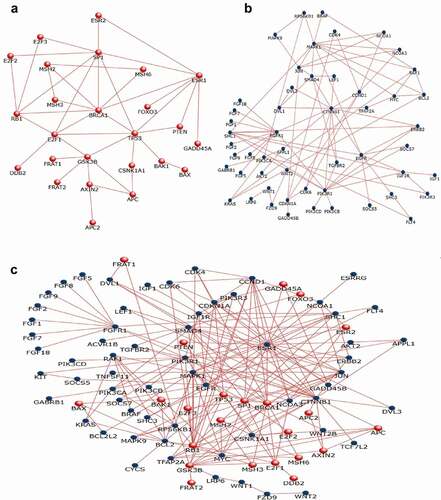
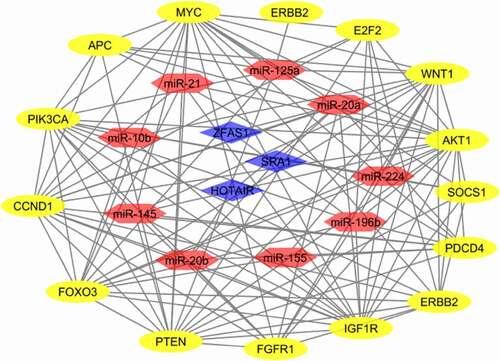
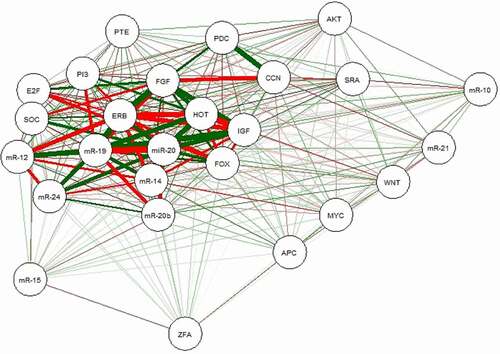
Figure 8. The lncRNA-miRNA-mRNA network The network includes 27 nodes and 126 edges. The blue rhombus, red hexagonal, and yellow oval represent the lncRNAs, miRs, and genes.
Construction of ceRNA network of lncRNA-miR-mRNA in breast cancer
To further understand the role of differentially expressed lncRNAs in breast cancer, we performed correlation analysis with the expression variability of lncRNAs, miRs, and mRNAs. Accordingly, there was a strong correlation between some network components, including miR-196b and HOTAIR, miR-20a and IGF1R gene, and miR-196b and PIK3CA gene. Moreover, we created a heat map of expression of the selected lncRNAs, miRs, and mRNAs using CIMminer (https://discover.nci.nih.gov/cimminer/home.do) (). The results showed that three lncRNAs were involved in regulating nine miRs. After a subset of sections was obtained from nine miRNA-regulated target genes and differentially expressed mRNAs, 14 target genes regulated by miRNAs were identified. Thus, 3 lncRNAs, 9 miRs, and 14 mRNAs are directly related to lncRNA-miRNA-mRNA in breast cancer ().
Figure 9. A plot heatmap to show the gene expression profile of DEGs in both bioinformatics (a) and experiment data (-∆CT) (B and C) in breast cancer patients The green color indicates down-regulated genes, and the red indicates up-regulated genes between tumor and normal samples.
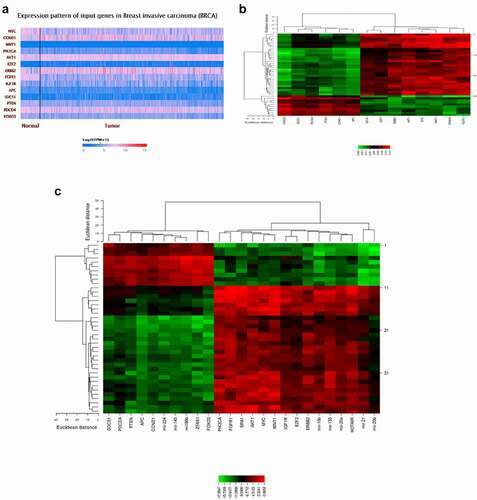
Figure 10. ceRNA regulatory network of lncRNAs, miRs, and mRNAs in rectal cancerNote: Red lines indicate a negative correlation, and green lines indicate a positive correlation. SRA: SRA1, HOT: HOTAIR, ZFA: ZFAS1, mR-21: miR-21, mR-10: miR-10b, mR-15: miR-155, mR-20: miR-20a, mR-20b: miR-20b, mR-14: miR-145, mR-19:miR-196b, mR-1:miR-125a, mR-24: miR-224, IGF: IGF1R, E2F: E2F2, AKT: AKT1, PI3: PIK3CA, FGF: FGFR1, ERB: ERBB2, MYC: MYC, WNT: WNT1, CCN: CCND1, APC:APC, SOC: SOCS1, FOX: FOXO3, PDC: PDCD4, PTE: PTEN.
Pre-treatment analysis of the candidate lncRNAs, miRs, and genes in breast cancer patients
The expression levels of the miRs, including miR-21, miR-10b, miR-125a, miR-155, miR-20a, miR-20b, miR-224, miR-145, and miR-196b, and also the genes, including APC, SOCS1, MYC, WNT1, CCND1, IGF1R, E2F2, AKT1, PIK3CA, FGFR1, ERBB2, FOXO3, PDCD4, and PTEN, and also lncRNAs, including SRA1, HOTAIR, and ZFAS1, demonstrated significant differences in the patients compromised with the healthy subjects (P < 0.05).
Furthermore, The results showed a similar expression pattern of the selected miRs, genes, and lncRNAs between the nodal status (−)/(+), the menopause status, and the stages of patients.
The expression of tumor suppressor- and onco-lncRNAs after the conventional treatments
The expression levels of the onco-lncRNAs, including SAR1 and HOTAIR, were significantly increased in the patients compromised with the healthy subjects (P < 0.0001) ().
Figure 11. The relative expression of the selected lncRNAs in the breast cancer patientsThe relative expression levels of the lncRNAs were normalized by using a reference RNA. The oncogenic lncRNAs included: A) SRA1 and B) HOTAIR. Tumor suppressor lncRNAsincluded: C) ZFAS1. The expression level of the lncRNAs was calculated using the – ΔCT method.
The expression level of tumor suppressor lncRNA, including ZFAS1, showed a significant decrease in the patients compromised with the healthy subjects (P < 0.0001) (). However, the expression levels of the tumor suppressor lncRNAs and onco-lncRNAs showed substantial changes after conventional treatments compromised with pre-treatment (P < 0.0001).
Validation of selected oncomiRs and tumor suppressor miRs after the conventional treatments
The expression levels of the oncomiRs, including miR-21, miR-20a, miR-20b, miR-155, and miR-10b, were significantly increased in the patients compromised with the healthy subjects (P < 0.0001) (). The expression levels of the oncomiRs showed a significant decrease after conventional treatments were compromised with pre-treatment. The expression levels of tumor suppressor miRs, including miR-145, miR-224, miR-125a, and miR-196b, have shown a significant decrease in breast cancer patients compared to the healthy subjects (P < 0.0001) (). However, the expression levels of the tumor suppressor miRs showed a significant increase after conventional treatments compared to the pre-treatment (P < 0.0001).
Figure 12. The relative expression of the candidate miRs in the breast cancer patientsThe relative expression levels of the miRs were normalized by using a reference RNA.The oncomiRs included: A) miR-21, B) miR-10b, C) miR-155, D) miR-20a, E) miR-20b.Tumor suppressor miRs included: F) miR-145, G) miR-196b, H) miR-125a, I) miR-224.The expression level of the miRs was calculated using the – ΔCT method.
Figure 12. (Continued).
Validation of the selected onco- and tumor suppressor genes
The expression levels of the oncogenes, including IGF1R, E2F2, AKT1, PIK3CA, FGFR1, ERBB2, MYC, and WNT1, were significantly increased in the patients compromised with the healthy subjects (P < 0.0001) (). The expression levels of the oncogenes showed a significant decrease after conventional treatments were compromised with pre-treatment. The expression levels of tumor suppressor genes, including CCND1, APC, SOCS1, FOXO3, PDCD4, and PTEN, have shown a significant decrease in breast patients compared to the healthy subjects (P < 0.0001) (). However, the expression levels of the tumor suppressor genes showed a significant increase after conventional treatments compromised with pre-treatment (P < 0.0001).
Figure 13. The relative expression of the selected genes in the breast cancer patients The relative expression level of the genes was normalized by using a reference gene. The oncogenes included: A) IGF1R, B) E2F2, C) AKT1, D) PIK3CA, E) FGFR1, F) ERBB2, J) MYC, H) WNT1. Tumor suppressor genes included: I) CCND1, G) APC, K) SOCS1, L) FOXO3, M) PDCD4 and N) PTEN. The expression level of the mRNAs was calculated using the – ΔCT method.
Figure 13. (Continued)

Figure 14. A Kaplan-Meier analysis of 5-year overall survival of candidate miRs in the breast cancer patientsThe patients with high expression of miR-21, miR-20b, and low expression of miR-125a had exhibited a shorter overall survival rate. Cutoff point: mean value of the candidate expression.A: miR-21, B: miR-20b, and C: miR-125a.
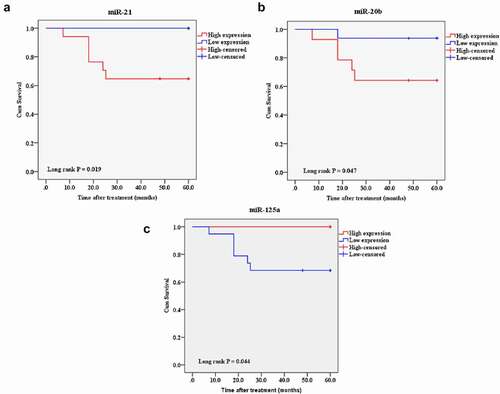
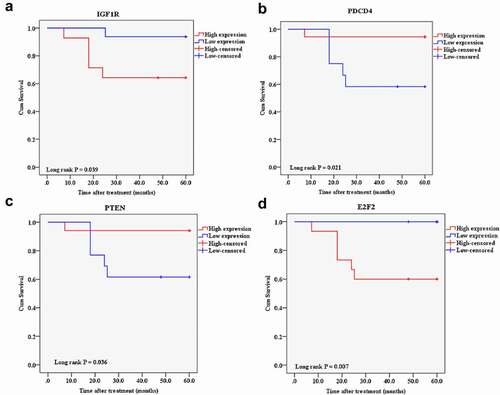
Figure 15. A Kaplan-Meier analysis of 5-year overall survival of candidate mRNAs in the breast cancer patients The patients with a high expression of IGF1R and E2F2 and a low expression of PDCD4 and PTEN had exhibited a shorter overall survival rate. Cutoff point: mean value of the selected candidate expression. A: IGF1R, B: PDCD4, C: PTEN, and D: E2F2.
The candidate miRs and mRNAs as predictive targets
The mean follow-up duration of the patients was 4.7 ± 1.3 years. During this follow-up period, six patients were deceased due to the disease. Besides, two patients had recurrences and underwent a new course of treatment. We performed the log-rank survival analysis according to the expression levels of the candidate lncRNAs, miRs, and mRNAs to investigate the predictive targets by the Kaplan-Meier analysis. Except for candidate lncRNAs, the patients with a high expression of miR-21, miR-20b, IGF1R, and E2F2 and a low expression of miR-125a, PDCD4, and PTEN exhibited a shorter overall survival rate ().
Discussion
Our analysis revealed a group of differentially expressed 3 lncRNAs, 9 miRs, and 14 mRNAs in breast cancer patients. To better understand the interactions of target genes with different signaling pathways, the GO and KEGG pathway analyses were performed. The pathway analyses showed that the selected miRs could interact with more significant genes involved in signaling pathways. Our results also demonstrated a substantial difference in the expression levels of the lncRNAs, miRs, and target genes after surgery and chemo-radiotherapy compared to pre-treatment. Collectively, these results suggested that they may be a potential prognostic biomarker for patients with breast cancer.
Our results are in line with previous studies conducted by Anastasov et al. (2012) and Wang et al. (2015) [Citation24,Citation25]. Their findings suggest that tumor resection may alter some of the inflammatory, physiological, and even pathological features of cells in affected tissues [Citation26]. The surgical procedure involves the removal of the tumors localized in the tissues and nearby margins. It has been demonstrated that a breast tumor’s pathological characteristics may have significant impacts on pathways associated with homeostasis, and these remarkable effects persist even more than two weeks after complete tumor resection. Indeed, alterations in cell behavior and physiological responses to tumor removal suggest that surgical treatments can play a critical role in the consequences of cell behaviors associated with pathological processes in cancer [Citation26].
Moreover, chemotherapy drugs are systemically or locally given. Although the goal of surgery is to remove all visible tumor lesions, the cancer cells can be left after tumor resection by chemotherapy. Thus, chemotherapy can be used as adjuvant therapy to destroy the remaining cancer cells after surgery [Citation27]. Another option available for a particular type of cancer, including breast cancer, is radiation therapy. It can directly damage the chemical structure of the genetic material of cancer cells and, therefore, be used to prevent cancer cells’ proliferation and induce their death [Citation28,Citation29]. In cancer research, the efficacy of therapeutic approaches is a substantial factor in continuing treatment. In cases with no detectable tumor, an increase in the oncomiRs or a decrease in tumor suppressor-miRs may indicate treatment failure. It is worth noting that the operation, chemotherapy, and radiotherapy can shrink the tumor size, leading to a more reduction in the oncomiRs and an increase in the tumor suppressor-miRs.
Many studies have shown that miRs can play a significant role in breast tumors’ cell cycle and proliferation pathways through functional interaction with the cyclin and the kinase proteins. In this setting, the up-regulation of protein kinases and down-regulation of their inhibitors by miRs can increase breast tumors’ cell viability and result in the aberration of the cell cycle alterations [Citation30]. Likewise, the dysregulation of miRs in the cell proliferative and the cell-cycle regulatory network is attributed to resistance to cancer treatments to suppress cell growth and proliferation [Citation29]. Liu et al. (2018) indicated that miR-26a/E2F7 feedback loop could contribute to the regulation of tamoxifen resistance in ER-positive breast cancer. Notably, it has been demonstrated that the overexpression of miR-26a could directly inhibit E2F7 expression and indirectly repress MYC expression. On the other hand, E2F7 overexpression could decrease miR-26a expression through MYC transcription inhibition. They also showed that miR-26a overexpression and E2F7 silencing could desensitize breast tumor cells to tamoxifen, reducing cell viability and inducing G1 cell cycle arrest [Citation31].
LncRNAs and miRs and the crosstalk between them are eminent players in the pathophysiological processes of cancers. LncRNAs have been shown to play pivotal roles in regulating multiple cellular processes in normal cells or tumor formation and development of cancerous cells through various mechanisms [Citation32]. However, few studies have described the regulatory mechanisms of lncRNA-miR-mRNA in cancer. In this setting, HOX Antisense Intergenic RNA (HOTAIR) is a lncRNA located at the HoxC gene cluster on chromosome 12. It has been demonstrated that HOTAIR has a significant role in silencing HoxD gene expression in the tumor through interactions with chromatin-modifying enzymes and regulates the expression of the PTEN gene [Citation33–35]. In this setting, growth arrest-specific transcript 5 (GAS5) can compete with PTEN to bind miR-21; thus, it can positively regulate the expression of PTEN and negatively regulate miR-21 expression. In other words, a decreased or increased expression of GAS5 can lead to overexpression or reduced expression of miR-21 and subsequently cause the down-regulation or up-regulation of PTEN in tumor cells [Citation36,Citation37]. GAS5 can also induce PTEN expression by inhibiting miR-103, miR-196b, miR-205, and miR-32 [Citation38,Citation39]. Furthermore, the regulation of miR-181a on the PTEN gene was mediated by a lncRNA X–inactive specific transcript (XIST). The inhibition of XIST can lead to a significant increase in cell proliferation and liver cancer invasion, leading to a decreased PTEN expression [Citation40]. These observations collectively led us to propose the novel hypothesis that such interactions may increase cell proliferation and hinder apoptosis through inhibition or direct activation of target genes involved in these pathways.
Overall, our results demonstrated that the changes in the candidate lncRNA-miR-mRNA network were associated with poor OS in breast cancer patients. In this context, the prognosis is an important indicator of disease treatment. Therefore, we hypothesized that this lncRNA-miR-mRNA network might significantly influence breast cancer’s pathogenesis and prognosis. In the present study, the patients with a high expression of miR-21, miR-20b, IGF1R, and E2F2, and a low expression of miR-125a, PDCD4, and PTEN exhibited a shorter overall survival rate. In addition, the candidate lncRNAs were not conducive to the prognosis of patients, and the regulation between miRs and lncRNAs may be more complicated. In this setting, Gao et al. (2021) observed that, unlike high expression miRs, low expression lncRNAs/miRs were significantly associated with a better overall survival rate. They found that 10 lncRNA and 6 miRs can predict the overall survival of patients with breast cancer [Citation41]. Like Tuersong et al. (2019) [Citation42], Jing-Jing Wang et al. (2019) found that six lncRNAs, two miRs, and nine mRNAs were negatively/positively associated with OS; thus, these RNAs may serve as potential prognostic biomarkers of OS in patients with breast cancer [Citation43]. These instances can show the high versatile potential of the ceRNA network in the clinic. Xiao et al. (2015) demonstrated that MALAT1 might promote the expression of ZEB2 by expanding miR-200s [Citation44]. Chen et al. (2017) revealed that the top 10 aberrantly expressed lncRNAs have essential roles through a lncRNA-miR-mRNA network [Citation45]. Li et al. (2018) described a novel ceRNA network including 11 lncRNAs, 9 miRs, and 41 mRNAs in cancer [Citation46]. Accordingly, an investigation into the ceRNA network may provide insight into specific disease processes and aid the development of novel therapeutic strategies [Citation43]. Our results highlighted the potential of the lncRNA-miR-mRNA network in understanding the pathogenesis of breast cancer. Simultaneously, we demonstrated that this panel could dynamically change during the treatment phases. They may propose innovative concepts and an experimental basis for identifying predictive biomarkers and therapeutic targets.
Conclusion
Overall, monitoring the lncRNA, miRs, and target genes during the treatment can be an appropriate diagnostic tool for estimating the identification and efficacy of therapeutic approaches. Understanding their underlying interactions will better diagnose and identify potential sites for more selective tumor therapy. Thus, it is worthwhile to thoroughly characterize the mechanisms underlying breast cancer’s aggressive characteristics for developing novel targets such as non-coding RNAs for the diagnosis and treatment.
Author contributions
MM and SK: sample processing, data analysis, and manuscript preparation. AMA: study conception and design and manuscript revision. VK, MGZ, MZ, and RO: sample collection and data analysis. EP: article revision. HR and ZM: sample processing and data analysis. ZB: article revision.
Compliance with ethical standards
The data that support the findings of this study are available from the corresponding author, AMA, upon reasonable request.
Availability of data and materials
Please contact the authors for data requests.
Ethical approval
All methods were performed under the relevant guidelines and regulations. All procedures performed in studies involving human participants were under the ethical standards of the institutional and/or national research committee and with the 1964 Helsinki declaration and its later amendments or comparable ethical standards. The experimental procedures and care protocols were approved by a review board committee of Dzful University of Medical Sciences (NO: IR.DUMS.REC. 1396.30) and registered by the Iranian Randomized Control Trial (IRCT) ethical board (NO: IRCT2016080818745N11). Written informed consent was obtained from each participant before the sample collection.
Acknowledgments
This study was co-funded by the Dzful University of Medical Sciences (Grant Number: 933) and the Tehran University of Medical Sciences (Grant Number: 38472). Research reported in this publication was also supported by Elite Researcher Grant Committee under award number [Grant Number: 971158] from the National Institute for Medical Research Development (NIMAD), Tehran, Iran.
Disclosure statement
No potential conflict of interest was reported by the author(s).
Additional information
Funding
References
- Schrijver WA, van Diest PJ, Moelans CB, et al. Unravelling site-specific breast cancer metastasis: a microRNA expression profiling study. Oncotarget. 2017;8(2):3111.
- Faghihi MA, Zhang M, Huang J, et al. Evidence for natural antisense transcript-mediated inhibition of microRNA function. Genome Biol. 2010;11(5):R56.
- Cui M, You L, Ren X, et al. Long non-coding RNA PVT1 and cancer. Biochem Biophys Res Commun. 2016;471(1):10–14.
- Harbeck N, Penault-Llorca F, Cortes J, et al. Breast cancer. Nat Rev Dis Primers. 2019;5(1):66.
- Saito Ramalho A, Dantas Lopes A, Talans A, et al. Molecular targets for therapeutic interventions in human papillomavirus-related cancers. Oncol Rep. 2010;24(6):1419–1426.
- Wang Z, Guo M, Ai X, et al. Identification of potential diagnostic and prognostic biomarkers for colorectal cancer based on GEO and TCGA databases. Front Genet. 2021;14(11):602922.
- D-c Y, Chen X-Y, Li X, et al. Transcript levels of spindle and kinetochore-associated complex 1/3 as prognostic biomarkers correlated with immune infiltrates in hepatocellular carcinoma. Sci Rep. 2021;11(1):1–12.
- Sarver AL, Sarver AE, Yuan C, et al. OMCD: oncomiR cancer database. BMC Cancer. 2018;18(1):1–6.
- Gao Y, Shang S, Guo S, et al. Lnc2Cancer 3.0: an updated resource for experimentally supported lncRNA/circRNA cancer associations and web tools based on RNA-seq and scRNA-seq data. Nucleic Acids Res. 2021;49(D1):D1251–D1258.
- Bao Z, Yang Z, Huang Z, et al. LncRNADisease 2.0: an updated database of long non-coding RNA-associated diseases. Nucleic Acids Res. 2019;47(D1):D1034–D1037.
- Anuraga G, Wang W-J, Phan NN, et al. Potential prognostic biomarkers of nima (Never in mitosis, gene a)-related kinase (nek) family members in breast cancer. J Pers Med. 2021;11(11):1089.
- Vejnar CE, Blum M, Zdobnov EM. miRmap web: comprehensive microRNA target prediction online. Nucleic Acids Res. 2013;41(W1):W165–W168.
- Dweep H, Gretz N, Sticht C. miRWalk database for miRNA–target interactions. RNA Mapping: Springer; 2014. p. 289–305.
- Agarwal V, Bell GW, Nam J-W, et al. Predicting effective microRNA target sites in mammalian mRNAs. elife. 2015;4:e05005.
- Pathan M, Keerthikumar S, Ang CS, et al. FunRich: an open access standalone functional enrichment and interaction network analysis tool. Proteomics. 2015;15(15):2597–2601.
- Zhou R-S, Zhang E-X, Sun Q-F, et al. Integrated analysis of lncRNA-miRNA-mRNA ceRNA network in squamous cell carcinoma of tongue. BMC Cancer. 2019;19(1):1–10.
- Kohl M, Wiese S, Warscheid B. Cytoscape: software for visualization and analysis of biological networks. data mining in proteomics. Springer; 2011. p. 291–303.
- Assenov Y, Ramírez F, Schelhorn S-E, et al. Computing topological parameters of biological networks. Bioinformatics. 2008;24(2):282–284.
- Khalighfard S, Alizadeh AM, Irani S, et al. Plasma miR-21, miR-155, miR-10b, and Let-7a as the potential biomarkers for the monitoring of breast cancer patients. Sci Rep. 2018;8(1):1–11.
- Chen H, Liu H, Zou H, et al. Evaluation of plasma miR-21 and miR-152 as diagnostic biomarkers for common types of human cancers. J Cancer. 2016;7(5):490.
- Flavin RJ, Smyth PC, Laios A, et al. Potentially important microRNA cluster on chromosome 17p13. 1 in primary peritoneal carcinoma. Mod Pathol. 2009;22(2):197–205.
- Rahimkhani M, Mordadi A, Gilanpour M. Detection of urinary Chlamydia trachomatis, Mycoplasma genitalium and human papilloma virus in the first trimester of pregnancy by PCR method. Ann Clin Microbiol Antimicrob. 2018;17(1):1–7.
- Khalighfard S, Kalhori MR, Amiriani T, et al. A systematic approach introduced novel targets in rectal cancer by considering miRNA/mRNA interactions in response to radiotherapy. Cancer Biomarkers. 2022;33(1):97–110.
- Anastasov N, Höfig I, Vasconcellos IG, et al. Radiation resistance due to high expression of miR-21 and G2/M checkpoint arrest in breast cancer cells. Radiat Oncol. 2012;7(1):206.
- Wang W, Y-p L. MicroRNAs in breast cancer: oncogene and tumor suppressors with clinical potential. J Zhejiang Univ Sci B. 2015;16(1):18–31.
- Volinia S, Calin GA, Liu C-G, et al. A microRNA expression signature of human solid tumors defines cancer gene targets. Proceedings of the National Academy of Sciences, U.S.A. 2006;103:2257–2261.
- Ma W, Yu J, Qi X, et al. Radiation-induced microRNA-622 causes radioresistance in colorectal cancer cells by down-regulating Rb. Oncotarget. 2015;6(18):15984.
- Pavlopoulou A, Oktay Y, Vougas K, et al. Determinants of resistance to chemotherapy and ionizing radiation in breast cancer stem cells. Cancer Lett. 2016;380(2):485–493.
- Chen P, Xu W, Luo Y, et al. MicroRNA 543 suppresses breast cancer cell proliferation, blocks cell cycle and induces cell apoptosis via direct targeting of ERK/MAPK. Onco Targets Ther. 2017;10:1423.
- Alizadeh S, Isanejad A, Sadighi S, et al. Effect of a high-intensity interval training on serum microRNA levels in women with breast cancer undergoing hormone therapy. A single-blind randomized trial. Ann Phys Rehabil Med. 2019;62(5):329–335.
- Liu J, Li X, Wang M, et al. A miR-26a/E2F7 feedback loop contributes to tamoxifen resistance in ER-positive breast cancer. Int J Oncol. 2018;53(4):1601–1612.
- Reddy KB. MicroRNA (miRNA) in cancer. Cancer Cell Int. 2015;15(1):38.
- Gupta RA, Shah N, Wang KC, et al. Long non-coding RNA HOTAIR reprograms chromatin state to promote cancer metastasis. Nature. 2010;464(7291):1071–1076.
- Sparmann A, van Lohuizen M. Polycomb silencers control cell fate, development and cancer. Nat Rev Cancer. 2006;6(11):846–856.
- Rinn JL, Kertesz M, Wang JK, et al. Functional demarcation of active and silent chromatin domains in human HOX loci by noncoding RNAs. cell. 2007;129(7):1311–1323.
- Hu L, Ye H, Huang G, et al. Long noncoding RNA GAS5 suppresses the migration and invasion of hepatocellular carcinoma cells via miR-21. Tumor Biol. 2016;37(2):2691–2702.
- Cao L, Chen J, Ou B, et al. GAS5 knockdown reduces the chemo-sensitivity of non-small cell lung cancer (NSCLC) cell to cisplatin (DDP) through regulating miR-21/PTEN axis. Biomed Pharmacother. 2017;93:570–579.
- Gao Z-Q, J-f W, Chen D-H, et al. Long non-coding RNA GAS5 suppresses pancreatic cancer metastasis through modulating miR-32-5p/PTEN axis. Cell Biosci. 2017;7(1):66.
- Guo C, W-q S, Sun P, et al. LncRNA-GAS5 induces PTEN expression through inhibiting miR-103 in endometrial cancer cells. J Biomed Sci. 2015;22(1):100.
- Chang S, Chen B, Wang X, et al. Long non-coding RNA XIST regulates PTEN expression by sponging miR-181a and promotes hepatocellular carcinoma progression. BMC Cancer. 2017;17(1):248.
- Gao S, Lu X, Ma J, et al. Comprehensive analysis of lncRNA and miRNA regulatory network reveals potential prognostic non-coding RNA involved in breast cancer progression. Front Genet. 2021;12:931.
- Tuersong T, Li L, Abulaiti Z, et al. Comprehensive analysis of the aberrantly expressed lncRNA‑associated ceRNA network in breast cancer. Mol Med Rep. 2019;19(6):4697–4710.
- Wang JJ, Huang YQ, Song W, et al. Comprehensive analysis of the lncRNA‑associated competing endogenous RNA network in breast cancer. Oncol Rep. 2019;42(6):2572–2582.
- Xiao H, Tang K, Liu P, et al. LncRNA MALAT1 functions as a competing endogenous RNA to regulate ZEB2 expression by sponging miR-200s in clear cell kidney carcinoma. Oncotarget. 2015;6(35):38005.
- Chen W-J, Tang R-X, R-q H, et al. Clinical roles of the aberrantly expressed lncRNAs in lung squamous cell carcinoma: a study based on RNA-sequencing and microarray data mining. Oncotarget. 2017;8(37):61282.
- Li F, Huang C, Li Q, et al. Construction and comprehensive analysis for dysregulated long non-coding RNA (lncRNA)-associated competing endogenous RNA (ceRNA) network in gastric cancer. Med Sci Monit. 2018;24:37.