
ABSTRACT
Little is known about the role of hsa_circ_0103232 in melanoma. This study researched the role of hsa_circ_0103232 in melanoma progression. Hsa_circ_0103232 expression in clinical tissues of melanoma patients and melanoma cells was detected by qRT-PCR. Hsa_circ_0103232 localization in melanoma cells was visualized by fluorescence in situ hybridization. Hsa_circ_0103232 effect on melanoma cells viability, proliferation, migration, and invasion was explored by cell counting kit-8 (CCK-8) assay, Edu experiment, wound healing assay, and Transwell experiment. RNA pull-down assay and dual-luciferase reporter gene assay were performed to verify the binding of hsa_circ_0103232 with miR-661, and the binding of miR-661 and RAB3D. Xenograft tumor models were constructed. Western blot and immunohistochemistry were used for protein expression detection. Hsa_circ_0103232 expression was increased in melanoma patients, indicating lower overall survival. Hsa_circ_0103232 was mainly expressed in the cytoplasm of melanoma cells. Silencing hsa_circ_0103232 suppressed melanoma cell viability, proliferation, migration, invasion, and epithelial–mesenchymal transition (EMT) (P < 0.01). Hsa_circ_0103232 functioned as a sponge of miR-661 to increase RAB3D expression. miR-661 overexpression partially reversed hsa_circ_0103232 promoting effect on melanoma cells viability, proliferation, migration, invasion, and EMT (P < 0.01). In melanoma patients, hsa_circ_0103232 expression was negatively correlated with miR-661 and positively correlated with RAB3D. Silencing hsa_circ_0103232 suppressed melanoma cell growth in vivo and Ki67 and RAB3D expression in xenograft tumors (P < 0.01). Hsa_circ_0103232 is a tumor promoter in melanoma to enhance malignant phenotype and growth in vivo via sponging miR-661/RAB3D. Hsa_circ_0103232 may be a novel target for melanoma treatment.
Introduction
Melanoma is one of the most aggressive skin cancers, arising from melanocytes. It only accounts for about 4% of skin cancer patients. However, approximately 75% of all skin cancer deaths are due to this deadly disease [Citation1]. In recent years, the incidence of melanoma worldwide is increasing rapidly [Citation2]. Despite standard and novel therapies, such as surgery, chemotherapy, and even immunotherapy, the prognosis is still very poor for metastatic melanoma [Citation2,Citation3]. Therefore, it is very important to understand the molecular mechanism of melanoma development and progression to develop novel and effective treatment strategies.
In recent years, accumulating evidence has demonstrated that circular RNAs (circRNAs) are important regulators of tumorigenesis and progression [Citation4]. circRNAs are widely expressed in eukaryotes with a specific expression pattern in tissues and cells [Citation5]. Structurally, circRNAs are single-stranded, covalently closed noncoding circular RNA molecules with high stability [Citation6]. CircRNAs have selectively conserved target sites of microRNAs (miRNAs), which can regulate the downstream gene expression by sponging miRNAs [Citation7,Citation8]. miRNAs are a family of single-stranded non-coding small RNAs with a length of about 22 nucleotides. It regulates gene expression at the post-transcriptional level, thereby participating in the regulation of multiple disease development [Citation9,Citation10]. Clinical study has indicated that the target therapy of melanoma showed its superiority [Citation11]. At present, some circRNAs have been researched to be promising targets for melanoma, such as circ_0062270 and circ_0017247 [Citation12,Citation13]. However, more circRNAs still need to be discovered to provide more effective targets for the target treatment of melanoma. Recently, Yang et al. [Citation14] compared circRNAs profile expression in 5 uveal melanoma tissues and 5 normal uvea tissues. Hsa_circ_0103232 was discovered to be highly expressed in uveal melanoma tissues than in normal uvea tissues, suggesting that hsa_circ_0103232 might be a promising target for uveal melanoma treatment. At present, the expression and function of hsa_circ_0103232 in melanoma have not yet been studied. Based on this, we performed preliminary research and found the abnormally up-regulated hsa_circ_0103232 in melanoma cells. Then, this study hypothesized that hsa circ_0103232 might be involved in regulating the progression of melanoma. Thus, this study was designed to research the exact function of hs_circ_0103232 in melanoma.
The CircInteractome is a novel and useful tool for providing miRNAs containing binding sites to circRNAs [Citation15]. To explore the molecular mechanism of hsa_circ_0103232 in regulating melanoma, an online bioinformatics analysis was performed using CircInteractome (https://circinteractome.nia.nih.gov). It was found that five miRNAs (miR-142-5p, miR-661, miR-495, miR-583, and miR-605) had common binding site for hsa_circ_0103232. Our preliminary research showed that hsa_circ_0103232 knockdown had the greatest promotion effect on miR-661 expression in melanoma cells. Therefore, miR-661 was selected as the target of hsa_circ_0103232 and it was used in the following study. Moreover, through Targetscan (http://www.targetscan.org/vert_71), RAB3D was found to possess a binding site of miR-661. Previous study has revealed that RAB3D was a target of miR-661, and hsa_circ_0088732 could enhance the progression of glioma via sponging miR-661 to elevate the expression of RAB3D [Citation16]. Based on the online bioinformatics analysis and the above previous study, hsa_circ_0103232 was thus hypothesized to regulate melanoma progression by sponging miR-661/RAB3D. A series of experiments were performed to verify this hypothesis in this study. The discovery of this study will provide important theoretical clues for hsa_circ_0103232 as a treatment target of melanoma.
Methods
Ethics committee approval
This study had been approved by the ethics committee of Chongqing University Cancer Hospital and complied with the Declaration of Helsinki. All participants had signed written informed consent.
Patients and clinical samples
From January 2007 to March 2008, 47 melanoma cases that underwent surgical resection at Chongqing University Cancer Hospital were enrolled in this study. These patients were diagnosed with melanoma for the first time. They had no previous history of other cancer-related diseases and treatment history. All patients were surgically removed in our hospital. The melanoma tissues of 47 cases, as well as paracancer tissues of 39 cases, were collected during surgery and stored at −80°C immediately. After surgery, all patients were followed up for 150 months. According to the melanoma treatment guidelines, the resection range was determined based on the different stages, and the paracancer tissues were taken as close to the outer edge as possible to ensure that they were adjacent normal tissues. The distance between the resected tumor tissues and the paracancer tissues was 2 cm [Citation17,Citation18].
Cell lines and culture
Melanoma cell lines (SKMel1, A375, and A875) and normal human epidermal melanocytes (NHEM) were commercially obtained from the American Type Culture Collection (ATCC, Manassas, VA, USA). The cell lines were separately cultured in Dulbecco’s modified eagle’s medium (DMEM) with 10% fetal bovine serum (FBS), 100 U/mL penicillin, and 100 U/mL streptomycin at 37°C, 5% CO2. DMEM, FBS, penicillin, and streptomycin were all purchased from Solarbio (Beijing, China).
Fluorescence in situ hybridization (FISH)
NHEM, SKMel1, and A375 cells were cultured in 6-well plates for 24 h with DMEM (10% FBS) at 37°C, 5% CO2. Alexa Fluor 488-labeled hsa_circ_0103232 (RiboBio, Guangzhou, China) was used to probe cells strictly according to the instructions. The hsa_circ_0103232 expression signals were detected using a Fluorescent in Situ Hybridization Kit (RiboBio, Guangzhou, China) in line with the instructions. The nuclear staining was performed using 4′, 6-diamidino-2-phenylindole (DAPI). The expression and localization of hsa_circ_0103232 in SKMel1 and A375 cells were observed under a fluorescence microscope. Hsa_circ_0103232 expression was presented as green fluorescence, and the nuclear was displayed as blue fluorescence. FISH experiment was carried out independently three times. The relative hsa_circ_0103232 fluorescence intensity of SKMel1 and A375 cells was normalized to that of NHEM cells. The difference in fluorescence intensity among the three cell lines was analyzed by one-way variance analysis and Tukey’s post hoc test.
Cell transfection
SKMel1 and A375 cells were cultured with DMEM (without FBS) in 6-well plates. shRNA targeting hsa_circ_0103232 and corresponding negative control (NC) (GeneChem, Shanghai, China) were separately transfected into SKMel1 and A375 cells using Lipofectamine 3000 (Thermo Fisher Scientific, Waltham, MA, USA). A375 cells were cotransfected using both hsa_circ_0103232 vector and miR-661 mimic, or both hsa_circ_0103232 vector and miR-661 mimic NC, or both empty vector and miR-661 mimic NC. Moreover, A375 cells were separately transfected by miR-661 mimic, mimic NC, RAB3D siRNA and siRNA NC. Vectors, miR-661 mimic, miR-661 mimic NC, RAB3D siRNA, and siRNA NC were all commercially provided by GeneChem (Shanghai, China). The transfection was carried out strictly according to the instructions of Lipofectamine 3000. Cells were transfected for 8 h at 37°C, 5% CO2. Thereafter, the cells were cultured with DMEM (10% FBS) for 48 h at 37°C, 5% CO2.
Cell counting kit-8 (CCK-8) assay
SKMel1 and A375 cells (1 × 10⁴ cells) were cultured with 100 μL of DMEM (10% FBS) in 96-well plates at 37°C, 5% CO2. Five replicate wells were set in each group. At 0, 6, 12, 24 and 48 h, 10 μL CCK-8 reagents were added to incubate cells for 4 h at 37°C. The optical density (OD) value of each well was determined using a porous microplate reader (BioTek, Winooski, VT, USA). CCK-8 assay was performed independently three times. The difference comparison of OD value was implemented by two tailed paired Student’s t-test (for between sh-NC group and sh-hsa_circ_0103232-1 group, between miR-NC group and miR-661 mimic group, and between siNC group and siRAB3D group) and one-way variance analysis followed by Tukey’s post hoc test (for among oe-NC + miR-NC group, oe-hsa_circ_0103232 + miR-NC group, and oe-hsa_circ_0103232 + miR-661 mimic group).
Edu experiment
SKMel1 and A375 cells were (1 × 10⁵ cells) cultured with 1 mL of DMEM (10% FBS) in 6-well plates at 37°C, 5% CO2. After 48 h of culture, the proliferation was evaluated using an Edu assay kit (Abbkine, Wuhan, China) in line with the instructions. DAPI was used for nuclear staining. The number of Edu positive cells was counted in 5 random non-overlapping fields of view under a fluorescence microscope. EdU experiment was independently implemented three times. The difference comparison of EdU positive cell number was implemented by two tailed paired Student’s t-test (for between sh-NC group and sh-hsa_circ_0103232-1 group, between miR-NC group and miR-661 mimic group, and between siNC group and siRAB3D group) and one-way variance analysis followed by Tukey’s post hoc test (for among oe-NC + miR-NC group, oe-hsa_circ_0103232 + miR-NC group, and oe-hsa_circ_0103232 + miR-661 mimic group).
Wound healing assay
SKMel1 and A375 cells (1 × 10⁷ cells) were cultured with 1 mL of DMEM (10% FBS) for 24 h in 6-well plates at 37°C, 5% CO2. A straight wound was made through the center of the bottom using a 200 μl pipette tip. The wound width was measured after discarding the residual liquid in each well. The plates were placed at 37°C, 5% CO2 for another 24 h. The residual liquid was discarded. The wound width was recorded again. The relative wound width was determined by the final wound width/the initial wound width. Wound healing assay was independently conducted three times. The difference comparison of the relative wound width was implemented by two tailed paired Student’s t-test (for between sh-NC group and sh-hsa_circ_0103232-1 group, between miR-NC group and miR-661 mimic group, and between siNC group and siRAB3D group) and one-way variance analysis followed by Tukey’s post hoc test (for among oe-NC + miR-NC group, oe-hsa_circ_0103232 + miR-NC group, and oe-hsa_circ_0103232 + miR-661 mimic group).
Transwell experiment
SKMel1 and A375 cells (1 × 10⁵ cells) were seeded into the Transwell chambers with 200 μL of DMEM (without FBS). The Transwell chambers were pre-spread with 100 μL of Matrigel. Then, 500 μL of DMEM (10% FBS) was added into the lower chambers. Cells were placed at 37°C, 5% CO2 for 24 h. The residual liquid in each well was discarded. The invasion cells were fixed by 4% paraformaldehyde and stained with 0.1% crystal violet staining solution. The number of invasion cells was counted in 5 random non-overlapping fields of view under an inverted light microscope Transwell experiment was independently performed three times. The difference comparison of invasion cell number was implemented by two tailed paired Student’s t-test (for between sh-NC group and sh-hsa_circ_0103232-1 group, between miR-NC group and miR-661 mimic group, and between siNC group and siRAB3D group) and one-way variance analysis followed by Tukey’s post hoc test (for among oe-NC + miR-NC group, oe-hsa_circ_0103232 + miR-NC group, and oe-hsa_circ_0103232 + miR-661 mimic group).
RNA pull down assay
HEK-293 cells (ATCC, Manassas, VA, USA) were cultured with DMEM (without FBS) in 6-well plates. The biotinylated hsa_circ_0103232 sense, hsa_circ_0103232 antisense, RAB3D sense, and RAB3D antisense were commercially provided by GeneChem (Shanghai, China). HEK-293 cells were transfected by these biotinylated sense or antisense. After 48 h of culture at 37°C, 5% CO2, cells were collected and lysed. The lysate was incubated with 50 μL of magnetic beads (without RNase) (Dynal Biotech, Lake Success, NY, USA) on rotator for 12 h at 4°C. Trizol regent (Solarbio, Beijing, China) was used to purify RNAs. The beads-bound miR-661 was qualified by quantitative real-time polymerase chain reaction (qRT-PCR). The RNA pull-down assay was independently executed three times. The difference comparison of miR-661 enrichment was analyzed by one-way variance analysis followed by Tukey’s post hoc test (for among Beads group, Antisense group and Sense group).
Dual luciferase reporter gene assay
The luciferase reporters were purchased from GeneChem (Shanghai, China), including pGL3-hsa_circ_0103232-mutant type (Mut) sequence luciferase reporter, pGL3-hsa_circ_0103232-wild type (WT) sequence luciferase reporter, pGL3-RAB3D-Mut sequence luciferase reporter, and pGL3-RAB3D-WT sequence luciferase reporter. HEK-293 cells were cultured with DMEM (without FBS) in 6-well plates, followed by being cotransfected by the reporter plasmid and miR-661 mimic or miR-661 negative control. The transfection was performed in line with the instructions of Lipofectamine 3000. Cells were transfected for 8 h at 37°C, 5% CO2. After that, the cells were cultured with DMEM (10% FBS) for 48 h at 37°C, 5% CO2. The luciferase activity was detected using a Dual-Luciferase Reporter Assay System (Promega, Madison, WI, USA) according to the instructions. Renilla luciferase activity was used as the control of firefly luciferase activity. Dual-luciferase reporter gene assay was implemented independently three times. The difference comparison of relative hsa_circ_0103232 and RAB3D reporter luciferase activities was analyzed by two tailed paired Student’s t-test (for between miR-NC group and miR-661 mimic group).
Western blot
RIPA Lysis Buffer (Solarbio, Beijing, China) was added into cells to extract total proteins on ice. Protease inhibitor cocktails were contained in the RIPA Lysis Buffer. Sodium dodecyl-sulfate polyacrylamide gel electrophoresis (SDS-PAGE) was carried out to separate proteins for 2 h ay 100 V. At 280 mA, the proteins were transferred onto polyvinylidene difluoride (PVDF) membranes for 2 h. Skimmed milk (5%) was used to treat proteins for 1 h at room temperature. Rabbit anti-primary antibodies (1:1000, Abcam, Cambridge, Massachusetts, USA) were used to probe proteins for 12 at 4°C, including anti-E-cadherin (1:1000, ab15148), anti-Slug (1:1000, ab27568), anti-MMP-9 (1:1000, ab38898), anti-RAB3D (1:1000, ab221125), and anti-β-actin (1:1000, ab8227). β-Actin was used as the control. Tris-buffered saline tween-20 (TBST) was used to wash the PVDF membranes for 3 times. Horseradish peroxidase (HRP)-conjugated goat anti-rabbit secondary antibody (1:5000, ab97051, Abcam) was added to incubate the proteins for 2 h at room temperature. The protein bands were visualized by an enhanced chemiluminescence kit (Beyotime, Shanghai, China) according to the instructions. The protein band density was evaluated using the Image J software (National Institutes of Health, Maryland, USA). Western blot was implemented independently three times. The difference comparison of protein levels was performed by two tailed paired Student’s t-test (for between sh-NC group and sh-hsa_circ_0103232-1 group, between miR-NC group and miR-661 mimic group, and between siNC group and siRAB3D group) and one-way variance analysis followed by Tukey’s post hoc test (for among oe-NC + miR-NC group, oe-hsa_circ_0103232 + miR-NC group, and oe-hsa_circ_0103232 + miR-661 mimic group).
Xenograft tumor models
The animal experiments have been approved by the animal ethics committee of Chongqing University Cancer Hospital. Nude mice (4 weeks old, n = 10) were purchased from Shanghai Experimental Animal Center, Chinese Academy of Sciences (Shanghai, China). All the mice had free access to food and water in a 12 h day/night cycle room at (22 ± 2)°C. A375 cells stably transfected by hsa_circ_0103232 shRNA and negative control were dispersed in phosphate buffered saline (PBS) (1 × 10⁵ cells/mL). Then, 100 μL of each cell suspension was injected subcutaneously into the back of nude mice. Each cell suspension was injected into five nude mice. Every 7 days, the long diameter (L) and short diameter (W) of xenograft tumors were measured using a vernier caliper. The formula of LW2/2 was used to calculate the tumor volume. After 28 days, nude mice were euthanized and the xenograft tumors were stripped. After being weighed, the xenograft tumors were stored at −80°C immediately. The difference comparison of tumor volume and weight was performed by two tailed paired Student’s t-test (for between sh-NC group and sh-hsa_circ_0103232-1 group).
Immunohistochemistry (IHC)
The xenograft tumors were fixed by 4% paraformaldehyde, followed by being embedded in paraffin. Afterward, the xenograft tumors were sliced into sections with 6 μm in thickness. The sections were spread onto coverslips, followed by being treated with 3% H2O2 for 10 min. Normal goat serum was used to block the sections for 2 h. Primary antibodies (1:200, rabbit anti-Ki67, ab15580; rabbit anti-anti-RAB3D, ab221125; Abcam, Cambridge, Massachusetts, USA) were added to probe the sections for 12 h at 4°C. PBS was used to wash the sections for 3 times. Secondary antibody was then added to treat the sections for 1 h at room temperature. The sections were washed with PBS and stained with diaminobenzidine (DAB) for 10 min. After being washed and dehydrated, the sections were observed under a microscope.
qRT-PCR
In line with the instructions, the total RNAs in tissues and cells were extracted by treating with Trizol (Solarbio, Beijing, China). For miRNAs expression detection, a Mir-X miR First-Strand Synthesis Kit (TaKaRa, Otsu, Shiga, Japan) was used for the synthesis of cDNA in line with the instructions. The qRT-PCR was performed with SYBR Premix Ex Taq II (TaKaRa, Otsu, Shiga, Japan) strictly according to the instructions. U6 was as the control of miRNAs. For hsa_circ_0103232 and RAB3D mRNA expression detection, a PrimeScript RT reagent kit (TaKaRa, Otsu, Shiga, Japan) was used for the synthesis of cDNA according to the instructions. The PCR reaction was performed on a Roche LightCycler® 480II PCR instrument (Roche Molecular Biochemicals, Mannheim, Germany) using SYBR Premix Ex Taq II (TaKaRa, Otsu, Shiga, Japan) in line with the instructions. β-Actin was as the control of hsa_circ_0103232 and RAB3D mRNA. The relative expression of hsa_circ_0103232, RAB3D mRNA, and miRNAs was determined by 2−∆∆CT method. qRT-PCR was independently conducted three times. The difference comparison of hsa_circ_0103232, miRNA abd mRNA levels was performed by two tailed paired Student’s t-test (for between tumor tissues and paracancer tissues and between sh-NC group and sh-hsa_circ_0103232-1 group) and one-way variance analysis followed by Tukey’s post hoc test (for among NHEM, SKMel1, A375, and A875 cell lines and among sh-NC group, sh-hsa_circ_0103232-1 group, and sh-hsa_circ_0103232-2 group).
Statistical analysis
All experiments were independently implemented at least for three times. All data were expressed as mean ± standard deviation and processed by SPSS 19.0 software (SPSS, Inc., Chicago, IL, USA). Kaplan–Meier curve was used for the analysis of survival, and the difference of survival was analyzed by the log-rank test. Pearson’s correlation analysis was applied for the correlation analysis between hsa_circ_0103232 and miR-661, between miR-661 and RAB3D mRNA, as well as between hsa_circ_0103232 and RAB3D mRNA. The difference between the two groups was compared by two tailed paired Student’s t-test. The differences among multiple groups were compared by one-way variance analysis, followed by Tukey’s post hoc test. P-values were marked in quantitative plots, and P < 0.05 was regarded as a statistically significant difference (* P < 0.05; ** P < 0.01; ## P < 0.01).
Results
Hsa_circ_0103232 expression was increased in melanoma
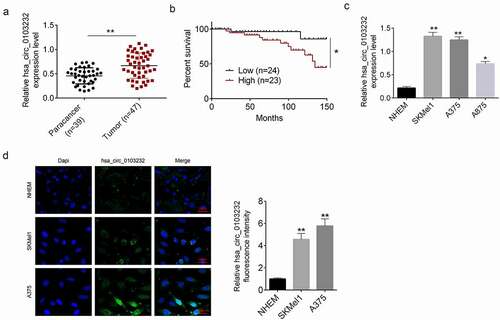
Hsa_circ_0103232 expression in melanoma tissues (n = 47) and paracancer tissues (n = 39) was detected by qRT-PCR. demonstrated that hsa_circ_0103232 expression in melanoma tissues was more abundant than that in paracancer tissues (P < 0.01). The 47 melanoma cases were divided into low circ_0103232 expression group (n = 24) and high circ_0103232 expression group (n = 23) according to the median (0.798). Relative to patients with low hsa_circ_0103232 expression, patients with high hsa_circ_0103232 expression showed poor survival after surgery (P < 0.05) (). The expression of hsa_circ_0103232 in melanoma cell lines (SKMel1, A375, and A875) was researched by using normal human epidermal melanocytes (NHEM) as control. Consistently, the melanoma cell lines (SKMel1, A375, and A875) expressed significantly higher hsa_circ_0103232 expression than normal human epidermal melanocytes (NHEM) (0.214 ± 0.035) (P < 0.05 or P < 0.01) (). FISH verified that hsa_circ_0103232 was mainly expressed in the cytoplasm. Moreover, melanoma cells (SKMel1 and A375 cells) had higher hsa_circ_0103232 fluorescence intensity than normal human epidermal melanocytes (NHEM) (P < 0.01) ().
Figure 1. Hsa_circ_0103232 expression was increased in melanoma. (a) qRT-PCR revealed that hsa_circ_0103232 expression was increased in melanoma tissues. (b) Kaplan–Meier curve indicated that high hsa_circ_0103232 expression was associated with poor survival of melanoma patients. (c) qRT-PCR illustrated that hsa_circ_0103232 expression was increased in melanoma cell lines (SKMel1, A375 and A875). (d) FISH verified that hsa_circ_0103232 was mainly expressed in the cytoplasm, and highly expressed in the melanoma cells (SKMel1 and A375). * P < 0.05. ** P < 0.01.
Silencing hsa_circ_0103232 suppressed melanoma cells proliferation, migration, invasion, and epithelial–mesenchymal transition (EMT)
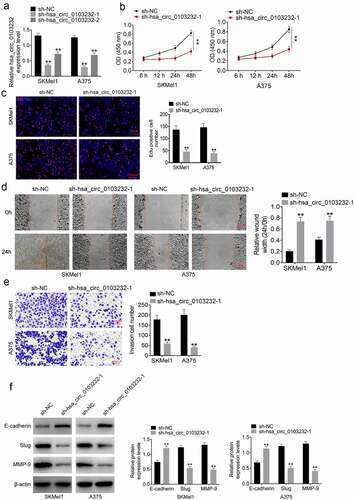
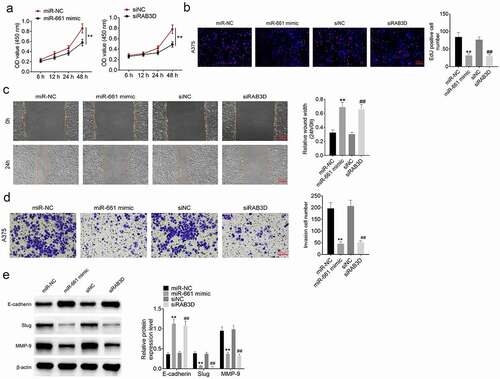
As shown in , hsa_circ_0103232 expression in SKMel1 and A375 cells was markedly silenced by shRNA (P < 0.01). sh-hsa_circ_0103232-1 had better knockdown efficiency than sh-hsa_circ_0103232-2. CCK-8 assay and Edu experiments exhibited that SKMel1 and A375 cells of sh-hsa_circ_0103232-1 group had much lower OD value and Edu positive cells than that of sh-NC group (P < 0.01) (). Wound healing assay and Transwell experiment were carried out to assess migration and invasion abilities. Higher relative wound width and more invasion cells were found in SKMel1 and A375 cells of sh-hsa_circ_0103232-1 group when relative to sh-NC group (P < 0.01) (). EMT was an important process for enhancing the migration and invasion abilities of tumor cells. Therefore, this study researched the EMT-related protein expression by using Western blot. As a result, higher E-cadherin protein expression and lower Slug and MMP-9 protein expression were found in sh-hsa_circ_0103232-1 group when compared with sh-NC group (P < 0.01) (). Thus, it might be that hsa_circ_0103232 silencing suppressed the migration and invasion abilities of melanoma cells by inhibiting the EMT.
Figure 2. Silencing hsa_circ_0103232 suppressed melanoma cells proliferation, migration, invasion and EMT. (a) qRT-PCR revealed that hsa_circ_0103232 expression in SKMel1 and A375 cells was effectively silenced by shRNA. (b) CCK-8 assay verified that silencing hsa_circ_0103232 suppressed melanoma cells viability. (c) Edu experiment indicated that silencing hsa_circ_0103232 inhibited melanoma cells proliferation. (d) Wound healing assay illustrated that silencing hsa_circ_0103232 attenuated melanoma cells migration. (e) Transwell experiment demonstrated that silencing hsa_circ_0103232 inhibited melanoma cells invasion. (f) Western blot revealed that silencing hsa_circ_0103232 suppressed melanoma cells EMT. ** P < 0.01.
Hsa_circ_0103232 functioned as a sponge of miR-661 to increase RAB3D expression
CircInteractome (https://circinteractome.nia.nih.gov) predicted that hsa_circ_0103232 possessed the binding site of miR-142-5p, miR-661, miR-495, miR-583, and miR-605. However, hsa_circ_0103232 knockdown significantly increased the expression of miR-142-5p, miR-661, and miR-605 and had no obvious effect on the expression of miR-495 and miR-583 in SKMel1 and A375 cells. Among miR-142-5p, miR-661, and miR-605, hsa_circ_0103232 knockdown had the greatest promotion effect on miR-661 expression. Therefore, miR-661 was selected as the subject in the following study.
The binding site between hsa_circ_0103232 and miR-661 is shown in . RNA pull-down assay showed that miR-661 was effectively enriched by hsa_circ_0103232 (P < 0.01) (). Dual-luciferase reporter gene assay exhibited that miR-661 mimic significantly reduced the luciferase activity of hsa_circ_0103232-WT reporter (P < 0.01). However, miR-661 mimic did not obviously affect the luciferase activity of hsa_circ_0103232-Mut reporter (). These data verified that miR-661 was sponged by hsa_circ_0103232.
Figure 3. Hsa_circ_0103232 functioned as a sponge of miR-661 to increase RAB3D expression. (a) CircInteractome predicted the miRNAs containing the binding site of hsa_circ_0103232. (b) CircInteractome predicted the binding site between hsa_circ_0103232 and miR-661. (c) RNA pull down assay indicated that miR-661 was effectively enriched by hsa_circ_0103232. (d) Dual luciferase reporter gene assay exhibited that miR-661 was a target gene of hsa_circ_0103232. (e) Targetscan showed the binding site between RAB3D and miR-661. (f) RNA pull down assay revealed that miR-661 was obviously enriched by RAB3D. (g) Dual luciferase reporter gene assay verified that RAB3D was target gene of miR-661. (h) Western blot illustrated that hsa_circ_0103232 silencing decreased RAB3D protein expression in SKMel1 and A375 cells. * P < 0.05. ** P < 0.01.
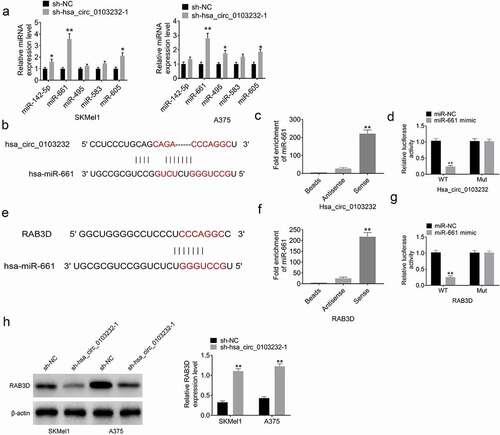
Targetscan (http://www.targetscan.org/vert_71) showed the binding site between RAB3D and miR-661 (). RNA pull-down assay exhibited that miR-661 was obviously enriched by RAB3D (P < 0.01) (). According to dual-luciferase reporter gene assay, miR-661 mimic had no obvious effect on RAB3D-Mut reporter luciferase activity, but prominently reduced RAB3D-WT reporter luciferase activity (P < 0.01) (). Thus, RAB3D was a target gene of miR-661, and directly inhibited by miR-661. Western blot displayed that hsa_circ_0103232 silencing significantly reduced the expression of RAB3D protein in SKMel1 and A375 cells (P < 0.01) (). All of these data indicated that hsa_circ_0103232 functioned as a sponge of miR-661 to increase RAB3D expression.
miR-661 partially reversed hsa_circ_0103232 promoting effect on melanoma cells proliferation, migration, invasion, and EMT
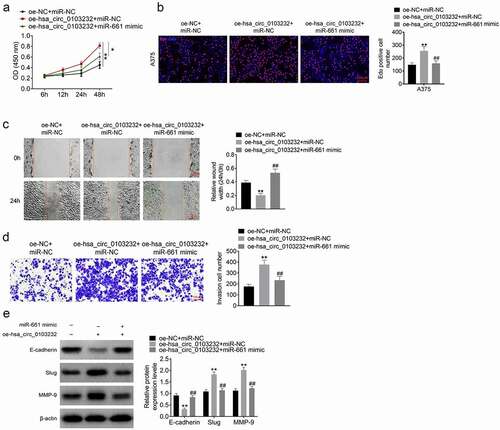
CCK-8 assay and Edu experiment presented much higher OD values and more Edu positive cells in A375 cells of oe-hsa_circ_0103232 + miR-NC group than that of oe-NC + miR-NC group (P < 0.01). Conversely, relative to oe-hsa_circ_0103232 + miR-NC group, lower OD value and less Edu positive cells were observed in A375 cells of oe-hsa_circ_0103232 + miR-661 mimic group (P < 0.01) (). Based on wound healing assay and Transwell experiment, lower relative wound width and more invasion cell number were found in A375 cells of oe-hsa_circ_0103232 + miR-NC group when compared with oe-NC + miR-NC group (P < 0.01). In comparison with oe-hsa_circ_0103232 + miR-NC group, A375 cells of oe-hsa_circ_0103232 + miR-661 mimic group had much higher relative wound width and less invasion cell number (P < 0.01) (). Western blot displayed that, relative to oe-NC + miR-NC group, A375 cells of oe-hsa_circ_0103232 + miR-NC group exhibited lower E-cadherin protein expression and higher Slug and MMP-9 protein expression (P < 0.01). When compared with oe-hsa_circ_0103232 + miR-NC group, higher E-cadherin protein expression and lower Slug and MMP-9 protein expression were presented in A375 cells of oe-hsa_circ_0103232 + miR-661 mimic group (P < 0.01) ().
Figure 4. miR-661 partially reversed hsa_circ_0103232 promoting effect on melanoma cells proliferation, migration, invasion and EMT. (a) CCK-8 assay illustrated that miR-661 partially reversed hsa_circ_0103232 promoting effect on melanoma cells viability. (b) Edu experiment revealed miR-661 partially reversed hsa_circ_0103232 promoting effect on melanoma cells proliferation. (c) Wound healing assay indicated that miR-661 partially reversed hsa_circ_0103232 promoting effect on melanoma cells migration. (d) Transwell experiment demonstrated that miR-661 partially reversed hsa_circ_0103232 promoting effect on melanoma cells invasion. (e) Western blot reveal that miR-661 partially reversed hsa_circ_0103232 promoting effect on melanoma cells EMT. ** P < 0.01 compared with oe-NC + miR-NC group. ## P < 0.01 compared with oe-hsa_circ_0103232 + miR-NC group.
miR-661 acted as a tumor suppressor and RAB3D was an oncogene in melanoma
The exact function of miR-661 and RAB3D in melanoma was researched. A375 cells were subjected to transfection with miR-661 mimic, mimic NC, RAB3D siRNA and siRNA NC, respectively. As displayed in , A375 cells of miR-661 mimic group had lower OD value, lower EdU positive cell number, higher relative wound width, and lower invasion cell number than miR-NC group (P < 0.01). At the same time, compared to siNC group, A375 cells of siRAB3D group showed lower OD value, lower EdU positive cell number, higher relative wound width, and lower invasion cell number (P < 0.01). Western blot exhibited much higher E-cadherin protein expression and lower Slug and MMP-9 protein expression in A375 cells of miR-661 mimic group, when relative to miR-NC group (P < 0.01). Moreover, matched to siNC group, higher E-cadherin protein expression and lower Slug and MMP-9 protein expression were observed in A375 cells of siRAB3D group (P < 0.01) (). Thus, miR-661 could suppress the progression of melanoma and it acted as a tumor suppressor in melanoma. However, RAB3D was an oncogene in melanoma.
Figure 5. miR-661 acted as a tumor suppressor and RAB3D was an oncogene in melanoma (a) CCK-8 assay implied that miR-661 suppressed the viability of melanoma cells and RAB3D had the opposite function. (b) EdU experiment indicated that miR-661 inhibited the proliferation ability of melanoma cells and RAB3D showed the opposite function. (c) Wound healing assay revealed that miR-661 possessed inhibitory effect on the migration ability of melanoma cells and RAB3D exhibited the opposite function. (d) Transwell experiment suggested that miR-661 could inhibit the invasion capacity of melanoma cells and RAB3D presented the opposite function. (e) Western blot indicated that miR-661 attenuated the EMT in melanoma cells and RAB3D possessed the opposite function. ** P < 0.01 compared with miR-NC group. ** P < 0.01 compared with siNC group.
Hsa_circ_0103232 expression in melanoma was negatively correlated with miR-661 and positively correlated with RAB3D
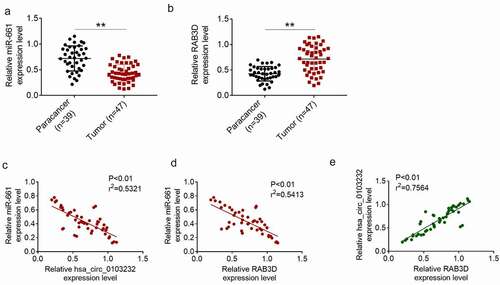
miR-661 and RAB3D mRNA expression in clinical tissues of melanoma patients were determined by qRT-PCR. As shown in , compared with paracancer tissues, melanoma tissues exhibited much lower miR-661 expression and higher RAB3D mRNA expression (P < 0.01). Pearson’s correlation analysis showed that hsa_circ_0103232 expression was negatively correlated with miR-661 expression in melanoma tissues (P < 0.01) (). Simultaneously, RAB3D mRNA expression was negatively correlated with miR-661 expression (P < 0.01) but positively correlated with hsa_circ_0103232 expression (P < 0.01) ().
Figure 6. Hsa_circ_0103232 expression in melanoma was negatively correlated with miR-661 and positively correlated with RAB3D. (a) qRT-PCR indicated that miR-661 expression was reduced in melanoma tissues. (b) qRT-PCR revealed that RAB3D mRNA expression was increased in melanoma tissues. (c) Pearson’s correlation analysis illustrated that hsa_circ_0103232 expression was negatively correlated with miR-661 expression in melanoma tissues. (d) Pearson’s correlation analysis revealed that RAB3D mRNA expression was negatively correlated with miR-661 expression in melanoma tissues. (e) Pearson’s correlation analysis indicated that RAB3D mRNA expression was positively correlated with hsa_circ_0103232 expression in melanoma tissues. ** P < 0.01.
Silencing hsa_circ_0103232 suppressed melanoma cells growth in vivo
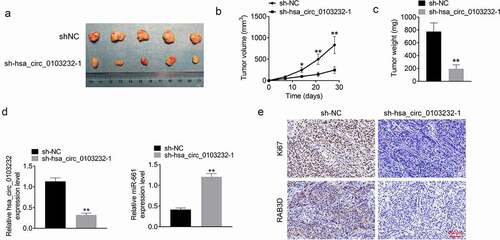
Xenograft tumor model was established using nude mice. After 28 days of subcutaneous injection, a much larger tumor volume and weight were shown in mice of sh-hsa_circ_0103232-1 group when relative to sh-NC group (P < 0.05 or P < 0.01) (). qRT-PCR presented that, relative to sh-NC group, prominently lower hsa_circ_0103232 expression and higher miR-661 expression were observed in xenograft tumors of sh-hsa_circ_0103232-1 group (P < 0.01) (). IHC exhibited less Ki67 and RAB3D proteins positive staining in xenograft tumors of sh-hsa_circ_0103232-1 group when compared with sh-NC group ().
Figure 7. Silencing hsa_circ_0103232 suppressed melanoma cells growth in vivo. (a) The xenograft tumors in nude mice were obtained after 28 days of subcutaneous injection. (b and c) Silencing hsa_circ_0103232 reduced A375 cells growth in vivo.(d) qRT-PCR revealed the decreased hsa_circ_0103232 expression and increased miR-661 expression in xenograft tumors. (e) IHC indicated that silencing hsa_circ_0103232 reduced Ki67 and RAB3D proteins expression in xenograft tumors. * P < 0.05. ** P < 0.01.
Discussion
This study focused on clarifying the function and underlying mechanism of hsa_circ_0103232 in melanoma progression. The results confirmed that hsa_circ_0103232 expression was abnormally increased in melanoma patients. High hsa_circ_0103232 expression was associated with poor survival after surgery. A series experiment indicated that hsa_circ_0103232 silencing attenuated melanoma cell malignancy in vitro and growth in vivo. EMT is an important factor in promoting tumor metastasis [Citation19]. The dysregulation of some EMT-related protein expressions, such as reduction of E-cadherin and increase of Slug and MMP-9, is important sign of aggravation of EMT [Citation20]. This study revealed that hsa_circ_0103232 silencing attenuated EMT in melanoma cells by elevating E-cadherin expression and reducing Slug and MMP-9 expression. CircRNAs are resistant to the degradation of RNase R or RNA exonuclease, so it is considered as promising targets for treatment of cancers and other human diseases [Citation21]. The function of several circRNAs has been identified, such as circ_0016418, circ_0020710, circ_0017247, circ-GLI1, and circ_0079593 [Citation13,Citation22–25], which were considered as cancer-promoting genes in melanoma. This was the first time that hsa_circ_0103232 was identified to be an oncogene in melanoma.
The most well-known function of circRNAs is the “circRNA-miRNA-mRNA” network, also known as the “miRNA sponge” [Citation14]. However, not all circRNAs can act as sponge of miRNAs. CircRNAs acting as miRNAs sponge should be mainly expressed in the cytoplasm and have putative binding site of miRNAs [Citation26]. In this study, FISH showed that hsa_circ_0103232 was mainly expressed in the cytoplasm of melanoma cells. RNA pull-down assay and dual-luciferase reporter gene assay confirmed that hsa_circ_0103232 could be directly bound to miR-661. Thus, miR-661 was confirmed to be a target gene of hsa_circ_0103232. Currently, the function of miR-661 in human tumors is still controversial. It was proved that miR-661 attenuated glioma progression by inhibiting proliferation, migration, and invasion [Citation27]. However, miR-661 was a cancer promoting gene in non-small cell lung cancer, ovarian cancer, and pancreatic ductal adenocarcinoma [Citation28–30]. However, the exact function of miR-661 in melanoma remains unknown at present. In this study, miR-661 expression was researched to be reduced in melanoma patients. This was the first time that miR-661 was revealed to be downregulated in melanoma cases. Moreover, this study demonstrated that miR-661 overexpression suppressed the malignant phenotype of melanoma cells. Therefore, this study first identified that miR-661 acted as a tumor suppressor in melanoma. Rescue experiment revealed that miR-661 partially reversed hsa_circ_0103232 promoting effect on melanoma cells viability, proliferation, migration, invasion, and EMT. Therefore, hsa_circ_0103232 might promote melanoma progression via sponging miR-661.
RAB3D was identified as a downstream target of miR-661. Through RNA pull-down assay and dual-luciferase reporter gene assay, it was confirmed that RAB3D expression was directly inhibited by miR-661. Simultaneously, hsa_circ_0103232 silencing decreased RAB3D protein expression in melanoma cells. RAB3D is a member of the RAB family, which serves an oncogenic role in several tumors [Citation31,Citation32]. RAB3D knockdown was proved to inhibit tumor cell migration and invasion. Meanwhile, RAB3D silencing attenuated EMT in tumor cells by increasing E-cadherin protein expression [Citation33]. RAB3D is an important factor in promoting tumor metastasis, which silencing may be a way to inhibit the metastasis of tumors [Citation32]. Previous work had shown that RAB3D overexpression partially reversed the inhibition of lncRNA CAR10 silencing on the malignant phenotype of melanoma cells in vitro [Citation34]. However, data on the exact function of RAB3D in melanoma are still not available. This study initially indicated that RAB3D was up-modulated in patients with melanoma. RAB3D silencing weakened the malignant phenotype of melanoma cells. Thus, RAB3D was an oncogene in melanoma. Taken together, hsa_circ_0103232 might facilitate melanoma progression by enhancing RAB3D expression via sponging miR-661. Thus, in future animal studies and clinical practice, the development of drugs targeting hsa_circ_0103232 inhibition will be conductive to the target therapy of melanoma. There are limitations in this study. Rescue experiments should be performed by simultaneously overexpressing hsa_circ_0103232 and silencing RAB3D. However, due to laboratory limitations, this issue cannot currently be performed. This will be the focus of our future research.
Conclusion
In summary, this study revealed that hsa_circ_0103232 was overexpressed in melanoma. Hsa_circ_0103232 silencing suppressed melanoma cell malignancy in vitro and growth in vivo. Mechanistically, hsa_circ_0103232 might facilitate melanoma progression by enhancing RAB3D expression via sponging miR-661. Therefore, hsa_circ_0103232 might be used as a novel target for melanoma treatment. In the future animal studies and clinical practice, the development of drugs targeting hsa_circ_0103232 inhibition will be conductive to the target therapy of melanoma.
Highlights
Hsa_circ_0103232 expression was increased in melanoma patients.
Silencing hsa_circ_0103232 suppressed melanoma progression.
Hsa_circ_0103232 functioned as a sponge of miR-661 to increase RAB3D expression.
Hsa_circ_0103232 promoted melanoma progression by sponging miR-661.
Data availability
The data of the present study are available from the corresponding author on reasonable request.
Disclosure statement
No potential conflict of interest was reported by the author(s).
Additional information
Funding
References
- Davis LE, Shalin SC, Tackett AJ. Current state of melanoma diagnosis and treatment. Cancer Biol Ther. 2019;20(11):1366–1379.
- Luan W, Ding Y, Yuan H, et al. Long non-coding RNA LINC00520 promotes the proliferation and metastasis of malignant melanoma by inducing the miR-125b-5p/EIF5A2 axis. J Exp Clin Cancer Res. 2020;39(1):96.
- Zhou WJ, Wang H-Y, Zhang J, et al. NEAT1/miR-200b-3p/SMAD2 axis promotes progression of melanoma. Aging (Albany NY). 2020;12(22):22759–22775.
- Chen S, Yang Z. Circular RNAs: characteristics, function and role in human cancer. Histol & Histopathol Cell & Mol Biol. 2018;33:887–893.
- Kristensen LS, Andersen MS, Stagsted LVW, et al. The biogenesis, biology and characterization of circular RNAs. Nat Rev Genet. 2019;20(11):675–691.
- Vo JN, Cieslik M, Zhang Y, et al. The landscape of circular RNA in cancer. Cell. 2019;176(4):869–881.e13.
- Zhang X, Zhang J, Zheng K, et al. Long noncoding RNAs sustain high expression levels of exogenous octamer-binding protein 4 by sponging regulatory microRNAs during cellular reprogramming. J Biol Chem. 2019;294(47):17863–17874.
- Li Z, Deng X, Lan Y. Identification of a potentially functional circRNA-miRNA-mRNA regulatory network in type 2 diabetes mellitus by integrated microarray analysis. Minerva Endocrinology. 2021. DOI:10.23736/S2724-6507.21.03370-8
- Manvati MKS, Khan J, Verma N, et al. Association of miR-760 with cancer: an overview. Gene. 2020;747:144648.
- Wang X, Yao Z, Fang L. miR-22-3p/PGC1β suppresses breast cancer cell tumorigenesis via PPARγ. PPAR Res. 2021;2021:1–15.
- Sun J, Kirichenko DA, Chung JL, et al. Perioperative outcomes of melanoma patients undergoing surgery after receiving immunotherapy or targeted therapy. World J Surg. 2020;44(4):1283–1293.
- Chen X, Tang Y, Yan J, et al. Circ_0062270 upregulates EPHA2 to facilitate melanoma progression via sponging miR-331-3p. J Dermatol Sci. 2021;103(3):176–182.
- Chen Z, Kang K, Chen S, et al. Circular RNA circ_0017247 promotes melanoma migration and invasion via targeting miR-145. Eur Rev Med Pharmacol Sci. 2020;24(17):8630.
- Yang X, Li Y, Liu Y, et al. Novel circular RNA expression profile of uveal melanoma revealed by microarray. Chin J Cancer Res. 2018;30(6):656–668.
- Dudekula DB, Panda AC, Grammatikakis I, et al. CircInteractome: a web tool for exploring circular RNAs and their interacting proteins and microRNAs. RNA Biol. 2016;13(1):34–42.
- Jin T, Liu M, Liu Y, et al. Lcn2-derived Circular RNA (hsa_circ_0088732) inhibits cell apoptosis and promotes EMT in glioma via the miR-661/RAB3D axis. Front Oncol. 2020;10:170.
- Chen X, Gao J, Liang N. DUXAP8 knockdown inhibits the development of melanoma by regulating the miR-3182/NUPR1 pathway. Oncol Lett. 2021;22(1):495.
- Wang Z, Liu Y. MicroRNA-633 enhances melanoma cell proliferation and migration by suppressing KAI1. Oncol Lett. 2021;21(2):88.
- Zhao G, Zhang W, Dong P, et al. EIF5A2 controls ovarian tumor growth and metastasis by promoting epithelial to mesenchymal transition via the TGFβ pathway. Cell Biosci. 2021;11(1). DOI:10.1186/s13578-021-00578-5.
- Chen L, Wu Q, Xu X, et al. Cancer/testis antigen LDHC promotes proliferation and metastasis by activating the PI3K/Akt/GSK-3β-signaling pathway and the in lung adenocarcinoma. Exp Cell Res. 2021;398(2):112414.
- Alhasan A, Izuogu OG, Al-Balool HH, et al. Circular RNA enrichment in platelets is a signature of transcriptome degradation. Blood. 2016;127(9):e1.
- Lu R, Zhang X, Li X, et al. Circ_0016418 promotes melanoma development and glutamine catabolism by regulating the miR-605-5p/GLS axis. Int J Clin Exp Pathol. 2020;13(7):1791–1801.
- Wei CY, Zhu M-X, Lu N-H, et al. Circular RNA circ_0020710 drives tumor progression and immune evasion by regulating the miR-370-3p/CXCL12 axis in melanoma. Mol Cancer. 2020;19(1):84.
- Chen J, Zhou X, Yang J, et al. Circ-GLI1 promotes metastasis in melanoma through interacting with p70S6K2 to activate Hedgehog/GLI1 and Wnt/β-catenin pathways and upregulate Cyr61. Cell Death Dis. 2020;11(7):596.
- Lu J, Li Y. Circ_0079593 facilitates proliferation, metastasis, glucose metabolism and inhibits apoptosis in melanoma by regulating the miR-516b/GRM3 axis. Mol Cell Biochem. 2020;475(1–2):227–237.
- Liu S, Chen L, Chen H, et al. Circ_0119872 promotes uveal melanoma development by regulating the miR-622/G3BP1 axis and downstream signalling pathways. J Exp Clin Cancer Res. 2021;40(1):66.
- Li Z, Liu Y-H, Diao H-Y, et al. MiR-661 inhibits glioma cell proliferation, migration and invasion by targeting hTERT. Biochem Biophys Res Commun. 2015;468(4):870–876.
- Liu F, Cai Y, Rong X, et al. MiR-661 promotes tumor invasion and metastasis by directly inhibiting RB1 in non small cell lung cancer. Mol Cancer. 2017;16(1):122.
- Zhu T, Yuan J, Wang Y, et al. MiR-661 contributed to cell proliferation of human ovarian cancer cells by repressing INPP5J expression. Biomed Pharmacother. 2015;75:123–128.
- Lv F, Zheng K, Yu J, et al. MicroRNA-661 expression is upregulated in pancreatic ductal adenocarcinoma and promotes cell proliferation. Oncol Lett. 2018;16(5):6293–6298.
- Luo Y, Ye G-Y, Qin S-L, et al. High expression of Rab3D predicts poor prognosis and associates with tumor progression in colorectal cancer. Int J Biochem Cell Biol. 2016;75:53–62.
- Yang J, Liu W, Lu X, et al. High expression of small GTPase Rab3D promotes cancer progression and metastasis. Oncotarget. 2015;6(13):11125–11138.
- Zhang J, Kong R, Sun L. Silencing of Rab3D suppresses the proliferation and invasion of esophageal squamous cell carcinoma cells. Biomed Pharmacother. 2017;91:402–407.
- Xie J, Zheng Y, Xu X, et al. Long Noncoding RNA CAR10 contributes to melanoma progression by suppressing miR-125b-5p to Induce RAB3D expression. Onco Targets Ther. 2020;13:6203–6211.