
ABSTRACT
Nucleolar and spindle associated protein 1 (NUSAP1), an indispensable mitotic regulator, has been reported to be involved in the development, progression, and metastasis of several types of cancer. Here, we investigated the expression and biological function of NUSAP1 in human glioblastoma (GBM), an aggressive brain tumor type with largely ineffective treatment options. Analysis of the molecular data in CGGA, TCGA and Rembrandt datasets demonstrated that NUSAP1 was significantly upregulated in GBM relative to low grade gliomas and non-neoplastic brain tissue samples. Kaplan-Meier analysis indicated that patients with tumors showing high NUSAP1 expression exhibited significantly poorer survival in both CGGA (P = 0.002) and Rembrandt cohorts (P = 0.017). Analysis of RNA sequencing data from P3-cells with stable knockdown of NUSAP1 revealed topoisomerase 2A (TOP2A) as a possible molecule downregulated by the loss of NUSAP1. Molecular analysis of the CGGA data revealed a strong correlation between NUSAP1 and TOP2A expression in primary gliomas and recurrent gliomas samples. SiRNA knockdown of either NUSAP1 or TOP2A in U251, T98 and GBM derived patient P3 cells inhibited GBM cell proliferation and invasion, and induced cell apoptosis. Finally, stable knockdown of NUSAP1 with shRNA led to decreased tumor growth in an orthotopic xenograft model of GBM in mice. Taken together, NUSAP1 gene silencing induced apoptosis possibly through the downregulation of the candidate downstream molecule TOP2A. Interference with the expression of NUSAP1 might therefore inhibit malignant progression in GBM, and NUSAP1 might thus serve as a promising molecular target for GBM treatment.
KEYWORDS:
Introduction
Glioblastoma multiforme (GBM) is the most malignant type of primary human brain tumor characterized by a high proliferation rate and an unfavorable prognosis [Citation1–3], where the 5-year survival rate remains dismally at less than 5% [Citation4–6]. Over the past 40 years, numerous therapeutic modalities have been implemented to enhance survival. However, due to the highly invasive nature of GBM, tumor tissue cannot be completely removed with surgery, which leads to tumor recurrence. Rigorous molecular analysis of GBM is ongoing to understand the development of the disease and its property of invasion for the identification of novel biomarkers and efficacious therapeutic avenues.
Nucleolar and spindle associated protein 1 (NUSAP1), a 55-kD vertebrate protein is localized to spindle microtubules during mitosis and an indispensable mitotic regulator [Citation7,Citation8]. In the normal cell cycle, the expression of NUSAP1 protein reaches its peak in the G2 phase and decreases after the cell enters the division phase. However, high expression of NUSAP1 has been reported in several types of cancer. NUSAP1, for example, has been found to be associated with metastasis of cervical carcinoma [Citation9]. In breast cancer, NUSAP1 has been shown to affect the DNA damage response by controlling BRCA1 protein levels [Citation7]. NUSAP1 has also been identified as a potential marker for breast ductal carcinoma in situ and a cause of resistance to therapy [Citation7]. Increased expression of NUSAP1 was demonstrated to be involved in tumor recurrence in prostate cancer and mediated by E2F1 Citation10. Knockout of the NUSAP1 gene notably inhibited cell proliferation, migration and invasion in colorectal cancer through the loss of DNMT1 gene expression [Citation11]. Downregulation of NUSAP1 suppressed cell proliferation, migration, and invasion in gastric cancer [Citation12,Citation13]. NUSAP1 was also shown to be regulated by microRNA 193a-5p in hepatocellular carcinoma [Citation14] and to promote the progression of bladder cancer [Citation15,Citation16]. These findings all together indicate that upregulation of NUSAP1 correlates with cancer progression. However, the biological function of NUSAP1 in GBM remains to be clarified.
In the present study, we investigated the expression and function of NUSAP1 in human GBM. We first analyzed molecular and clinical data in publicly available databases and found that NUSAP1 expression is significantly upregulated in GBM tissue samples and GBM cell lines. We subsequently used knockdown strategies in models in vitro and in vivo to explore the function of NUSAP1 in GBM and to identify co-regulated molecules, such as topoisomerase 2A (TOP2A), that might mediate the function of NUSAP1. Our results thus provide a potential strategy for a new targeted therapy for the treatment of GBM.
Materials and methods
Ethics statement
All animal procedures were approved by the Institutional Animal Care and Use Committee (IACUC) of Shandong University (Jinan, China). All experiments performed with human samples were approved by the Research Ethics Committee of Shandong University. Informed written consent was obtained from all participants.
Database searches
The Chinese Glioma Genome Atlas (CGGA, http://www.cgga.org.cn/), the Cancer Genome Atlas (TCGA, http://cancergenome.nih.gov/), Rembrandt (http://www.betastasis.com/glioma/rembrandt/), and STRING (functional protein association networks; https://string-db.org/) databases were mined for relevant molecular and protein association networks data.
Cell lines and cultures
Human GBM cell lines (U251, T98, U87, and A172) were obtained from the Chinese Academy of Sciences Cell Bank (Shanghai, China). P3, the in vivo propagated primary GBM tumor cell line and the GFP-luciferase stable U251 (GFP+ U251) glioma cell line were kindly provided by Prof. Rolf Bjerkvig, University of Bergen. U251, T98, U87, and A172 Cells were grown in Dulbecco’s modified Eagle’s medium (DMEM; SH30022.01B, Gibco; Gaithersburg, MD, USA) supplemented with 10% fetal bovine serum (10082147 Hyclone; GE Healthcare Life Sciences; Pittsburgh, PA, USA), whereas P3 cells were grown in Neurobasal Medium (#21103-049, NBM; ThermoFisher Scientific; Waltham, MA,) supplemented with 2% B27 (#A3653401, ThermoFisher Scientific), 1% L-glutamine (#BE17-605E, BioNordika; Oslo, Norway), 1% penicillin/streptomycin (#17-603E, BioNordika) and 20 ng/mL EGF (#236-eg-200, R&D Systems; Minneapolis, MN) in 5% CO2 in a humidified incubator at 37°C.
SiRNA transfections and lentiviral transduction
Gene-specific siRNAs synthesized by GenePharma (Shanghai, China) were transfected into gliomas cells to knockdown NUSAP1 and TOP2A expression. The following nonspecific random sequences were used as the nonspecific negative control (si-NC) sequences: sense 5’ UUC UCC GAA CGU GUC ACG UTT- 3’; and antisense 5’- ACG UGA CAC GUU CGG AGA ATT- 3’. The sequences of the NUSAP1#1, NUSAP1#2 and NUSAP1#3 siRNAs are the following: 5’-GCA GGA UCA UUC AGA GAU ATT UAU CUC UGA AUG AUU CUG CTT-3’, 5’-GCA CCA AGA AGC UGA GAA UTT AUU CUC AGC UUC UUG GUG CTT-3’ and 5’-GGA AAU GGA GUC CAU UGA UTT AUC AAU GGA CUC CAU UUC CTT-3’. The sequences of the TOP2A#1, TOP2A #2 and TOP2A #3 siRNAs are the following: 5’-GAC UGU CUG UUG AAA GAA UTT AUU CUU UVA ACA GAC AGU CTT −3’, 5’- CUC CUA ACU UCU AGU AAC UTT AGU UAC UAG AAG UUA GGA GTT-3’ and 5’-GAU CCA CCA AAG AUG UCA ATT UUG ACA UCU UUG GUG GAU CTT-3’. The siRNAs were transfected into U251, T98 and P3 cells for 48 h using Lipofectamine 2000 (Invitrogen, 11668-027) according to the manufacturer’s protocol. Lentiviral vectors expressing human shRNA targeting NUSAP1 (shNUSAP1, LV2017-18615, GenePharma) or scrambled-control (shNC) were used to generate stable cell clones expressing shNUSAP1 or a nonspecific shRNA as the control. Transfected/infected with lentivirus clones were selected using 1 mg/mL of puromycin (Selleckchem; Houston, TX, USA). Western blot analysis was used to evaluate siRNA knockdown efficiency.
Cell proliferation and invasion assays
EdU incorporation (C103103, Ribobio; Guangzhou, China) was used to determine cell proliferation according to the manufacturer’s protocol. Briefly, cells were seeded into 24-well plates at a density of 5.0 × 10⁴ cells per well and incubated overnight. After treatment, EdU was incorporated into proliferating cells and assessed through a catalyzed reaction with a fluorescently labeled azide. EdU positive cells were determined under fluorescence microscopy and quantified. Five random views from images acquired under a light microscope were used to count EdU positive cells.
For the invasion assay, transwell migration plates (8 μm pore size, Corning; Sigma-Aldrich, St. Louis, MO, USA) were coated with matrigel (Becton-Dickinson; Bedford, MA, USA) for 4 h. 2 × 10⁴ cells in 100 μL of DMEM without FBS were seeded into the upper chamber, and 600 μL of medium containing 10% FBS was added to the lower chamber. After 24 h at 37°C, the inserts were removed and migrated cells on the lower side of the insert were fixed with 4% formalin for 15 min, rinsed twice with PBS, and stained with 0.1% crystal violet for 10 min. The cells remaining in the upper chamber were removed with a cotton swab. Five random views from images acquired under a light microscope were used to count migrated cells.
3D invasion assay
Cells were transfected with different siRNA, incubated for 48 h, and then (3,000/well) seeded into 3D Culture Qualified 96 well spheroid formation plates. Cells were incubated in a humidified chamber with 5% CO2 at 37°C for 72 h. Plates were placed on ice for 15 min, and 50 μL of invasion matrix was added to each well in the plates. Plates were centrifuged at 300 × g at 4°C for 5 min and incubated at 37°C for 1 h. Medium (100 μL) was added to the wells, and the plates were incubated for 3–6 days. Images of the spheroids were captured at 0 h and every 24 h under bright field microscopy with a 5× objective. The 3rd day images of P3 cells and the 6th day images of U251 and T98 cells were used for statistical analysis. The images were analyzed with the software ImageJ.
Immunohistochemistry and western blotting analysis
Immunohistochemistry (IHC) staining of the target proteins and evaluations of the intensities of staining were performed as previously described [Citation17]. Briefly, paraffin-embedded samples were sectioned and mounted on microscope slides. Heat-induced epitope retrieval was performed in 10 mmol/L citric acid buffer at pH 7.2 in a microwave. The sections were blocked with goat serum and incubated with primary antibodies at 4°C overnight. The sections were then rinsed with PBS and incubated with horse-radish peroxidase-linked goat anti-rabbit, followed by visualization with the substrate diaminobenzidine and counter staining with Mayer’s hematoxylin.
Western blot analysis of the target proteins in glioma cells and human glioma samples was performed as previously described [Citation18]. GBM cells were treated for 48 h and then lysed for 30 min in RIPA Lysis Buffer (Beyotime; Shanghai, China) supplemented with phenylmethanesulfonyl fluoride (PMSF, Beyotime). Cells were sonicated to enhance lysis. Lysates were centrifuged, and protein concentrations of the supernatants were determined using the BCA assay according to the manufacturer’s protocol (Beyotime). Proteins lysates (20 µg) were separated using 10–12% sodium dodecyl sulfate polyacrylamide gel electrophoresis (SDS-PAGE). The separated proteins were transferred to polyvinylidene difluoride (PVDF) membranes (0.22 μM, Millipore; Burlington, MA, USA). PVDF membranes were blocked with 5% skim milk in Tris-buffered saline with Tween 20 (TBST, 20 mmol/L Tris-HCL, pH 8.0), 150 mM NaCl, 0.1% Tween 20 or with 5% BSA in TBST for phosphoproteins) for 1 h at room temperature. The membrane was incubated with primary antibodies overnight at 4°C followed by incubation with the corresponding species appropriate secondary antibodies (1:2000) for 1 h at room temperature. Luminous intensity was detected with the Chemiluminescence Imager (Bio-Rad; Hercules, CA, USA) according to the manufacturer’s protocol.
The following antibodies were used: NUSAP1 (#12024-1-AP; 1: 300, IHC; 1: 1000, WB; Proteintech, Chicago, IL, USA); TOP2A (#MA5-32096; 1: 500, IHC; 1: 1000, WB; Invitrogen; Carlsbad, California, USA); MKI67 (#ab15580; 1:500, IHC; Abcam; Cambridge, UK); mouse anti-β-actin (#TA-09, 1:2000, WB; ZSGB-BIO; Beijing, China;); and anti-GAPDH antibody (#BA2913, 1:2000, WB; Boster Bio; Wuhan, China;). β-actin and GAPDH proteins were used as the loading controls.
Flow cytometric analysis of apoptosis
GBM cells were first seeded into 6-well culture plates and transfected with siRNAs (si-NC, siN1-2 and siN1-3). Adherent cells and floating cells were harvested, re-suspended in 1x binding buffer, and incubated with Annexin V-FITC (BD Biosciences; San Jose, CA, USA) and propidium iodide according to the manufacturer’s instructions. Apoptotic cells were assessed with flow cytometry (ACEA Biosciences), and the software Flowjo (Tree Star; Ashland, OR, USA) was used to analyze the data.
RNA sequencing
The RNA-Seq libraries were prepared using the Illumina TruSeq™ RNA sample preparation Kit (Illumina; San Diego, CA, USA), and sequenced through paired-end (150 base paired-end reads) sequencing with the Illumina NovaSeq 6000 platform. Raw data was then quality filtered to generate “clean reads” for further analysis. The clean reads were then aligned to the human genome reference (hg19) using the STAR software and the reference-based assembly of transcripts was performed using HISAT2. We used Picard to compare the results to remove redundancy and subsequently Sentieon software to detect Single Nucleotide Variations (SNVs) and InDels. All previously identified SNVs and InDels were determined using the dbsnp database. Gene expression values were expressed as reads per kilobase of exon per million fragments mapped (FPKM) using kallisto software. To identify true differentially expressed genes (DEGs), the false discovery rate (FDR) was used for the rectification of the p-values. The DEGs (P-value≤0.05, |Log2FC|≥1) were subjected to enrichment analyses of GO and KEGG pathways. Protein-to-protein interaction network analyses of DEGs were performed using the STRING database, and visualization of the protein-protein interaction network was performed with Cytoscape software.
STRING to predict the function protein association network of NUSAP1
Searches for protein interaction networks were performed in the STRING platform (www.string-db.org). Networks for NUSAP1 were searched under the protein by name, and Homo sapiens was selected as the organism. A network for NUSAP1 was subsequently created.
Quantitative real-time PCR (RT-qPCR)
RNA was extracted from glioma cells with the RNA- Quick Purification Kit (RN001, EZ Bioscience; Roseville, MN, USA) according to the manufacturer’s protocol. Reverse transcription was performed using the High- Capacity cDNA Reverse Transcription Kit (Applied Biosystems; Waltham, MA) according to the manufacturer’s protocols. The cDNA was subjected to real- time PCR using the quantitative PCR Agilent Stratagene System Mx-3000P (Agilent; Santa Clara, CA, USA). The sequences of the PCR primers were the following: Homo- GAPDH -183 F primer, GCACCGTCAAGGCTGAGAAC, Homo- GAPDH -183 R primer, TGGTGAAGACGCCAGTGGA; Homo- NUSAP1 -165 F primer, CCATGAATGAACTGAAGCAGCA, Homo- NUSAP1 -165 R primer, GTGACCCCTTCAGACCCAAG; Homo- TOP2A -168 F primer, TCAGGCGTTTGATGGATGGA, Homo- TOP2A -168 R primer, TCCATGTTCTGACGGGAAGC; Homo- MT1F -71 F primer, TGCTGCTCCTGCTGCC; Homo- MT1F- 71 R primer, TTCTCTGACGCCCCTTTGC; Homo- S1PR1 -79 F primer, CTCCGTGTTCAGTCTCCTCG; Homo- S1PR1 -79 R primer, ATTGCTCCCGTTGTGGAGTT; Homo- IGFN1 -200 F primer, CACAGCTTCCGTATCAGGGTG; Homo- IGFN1 -200 R primer, TTGGTGTGGATGCGGTCGG; Homo- UTP14C -155 F primer, GTCTTTGGCAGTTCCCACAATAAT; Homo- UTP14C -155 R primer, CGTCCTTTGGCTTACTCGCC; Homo- KRT6A -117 F primer, CTACTCCTATGGCAGTGGTCT; Homo- KRT6A -117 R primer, GTGGTGTACTTGATGGTGGA; Homo- ANO1 -166 F primer, AAGCTCATCCGCTACCTGAA; Homo- ANO1 -166 R primer, CAAACAGGGTGACGAAGCCA; Homo- UFSP1 -171 F primer, GCTGGAGAGGCTTTACTCGC; and Homo- UFSP1 -171 R primer, TCACTGGGGCTTTTTGGAGT. The relative miRNA/mRNA expression normalized to U6/GAPDH was analyzed using GraphPad Prism 6 software.
Intracranial xenograft model
The xenograft tumor model was developed in mice and assessed as previously described. Briefly, athymic mice (male; 4 weeks old; 20–30 g; Shanghai SLAC Laboratory Animal Co., Ltd.; Shanghai, China) were randomly divided into four groups: U251-shNC (n = 6), U251-shNUSAP1 (n = 6), P3-shNC (n = 6) and P3-shNUSAP1 (n = 6). The mice were anesthetized with chloral hydrate and securely placed on a stereotactic frame. A longitudinal incision was made in the scalp and a 1 mm-diameter hole was drilled 2.5 mm lateral to the bregma. P3-shNC, P3-shNUSAP1, GFP-luciferase stable U251-shNC and U251-shNUSAP1 glioma cells (2 × 10⁵) in 10 μL of PBS were implanted 2.5 mm into the right striatum using a Hamilton syringe. U251 injected mice were then monitored through bioluminescence imaging every week. Mice were injected with 100 mg luciferin (Caliper), simultaneously anesthetized with isoflurane, and subsequently imaged with a cooled charge-coupled device camera (IVIS-200, Xenogen; Alameda, CA, USA). Bioluminescence values of tumors were quantitated using the Living Image 2.5 software package (Xenogen). Mice were euthanized when the weight dropped by more than 20% and perfused with 4% paraformaldehyde in PBS. Excised tumor tissues were formalin-fixed, paraffin- embedded, and sectioned. Sections were either stained with hematoxylin and eosin (H&E) or used for IHC.
Statistical analysis
All statistical analyses and experimental graphs were performed using GraphPad Prism 8 software. χ2-tests were applied to compare categorical variables, and continuous variables were analyzed using ANOVA and Dunnett t test. Three independent experiments were performed, and results were expressed as the mean ± the standard deviation (SD). P-values determined from different comparisons are indicated as follows: *P < 0.05; ** P < 0.01; *** P < 0.001. P values<0.05 were considered to be statistically significant.
Results
NUSAP1 expression is upregulated in high-grade gliomas and inversely associated with glioblastoma patient prognosis
To begin to understand the role of NUSAP1 in the development of human gliomas, we first examined expression of the gene in primary tumor samples by analyzing molecular data in publicly available datasets, including the Chinese Glioma Genome Atlas (CGGA), the Cancer Genome Atlas (TCGA) and Rembrandt. We found NUSAP1 to be significantly upregulated in high grade gliomas (grades III and IV, HGG) compared with low grade gliomas (grade II, LGG) and normal brain tissue (NBT) (). Kaplan-Meier analysis of the expression data in the CGGA and Rembrandt datasets demonstrated that high NUSAP1 expression in tumors predicted shorter overall survival in patients ().
Figure 1. NUSAP1 expression is up-regulated in high grade gliomas and inversely associated with glioblastoma patient prognosis. A. Relative expression levels of NUSAP1 mRNA in normal brain (NBT), low grade glioma (LGG) and high grade glioma tissue samples from the CGGA, TCGA and rembrandt databases. **P < 0.01 and ***P < 0 .001. B. Kaplan-Meier analyses showing differences in overall survival for patients with low and high NUSAP1 expressing gliomas from CGGA, TCGA and rembrandt databases. C. Representative images of immunohistochemical staining for NUSAP1 in 4-μm sections from normal brain tissue samples (NBT), and grade II, III and IV (GBM) gliomas. Scale bar = 100 μm. D. Immunohistochemical scores for NUSAP1 in normal brain tissue samples (NBT), and grade II, III, and IV (GBM) gliomas. Five random fields from each section were counted. Data are shown as the mean ± SD. *P < 0.05, **P < 0 .01 and ***P < 0.001. E. Western blot analysis of NUSAP1 levels in grade II, III and IV gliomas. F. Western blot analysis of NUSAP1 levels in U87, A172, U251,T98 and GBM patient derived P3 cell lines.
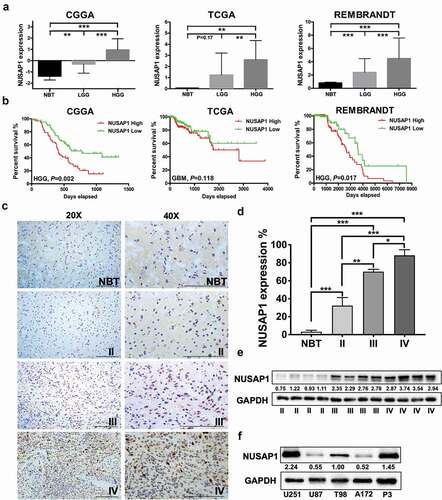
To determine whether NUSAP1 protein levels correspondingly increased, we performed immunohistochemistry (IHC) with an antibody against NUSAP1 on paraffin-embedded glioma (grade II, n = 10; grade III, n = 10; and grade IV, n = 15) and normal brain tissue (NBT; n = 5) samples. IHC staining and quantitative analyses of mean NUSAP1 IHC staining scores showed that the NUSAP1 protein levels also increased with increasing disease grade (). Western blot analysis confirmed that expression of NUSAP1 protein was significantly upregulated in GBMs (grade IV) compared with low grade gliomas ().
We also performed western blot analysis to determine NUSAP1 protein levels in GBM (U87, A172, U251, and T98) and patient-derived GBM (P3) cell lines. U251, T98, and P3 cell lines displayed higher NUSAP1 protein levels than U87 and A172 (~2-5x; ). All together, these data demonstrated that NUSAP1 was significantly upregulated in glioma samples and enhanced expression was correlated with disease progression in clinical glioma patients.
Downregulation of NUSAP1 inhibits cell proliferation and invasion and promotes apoptosis in glioma cells
Further analysis of the molecular data in the CGGA revealed a strong correlation between the expression of NUSAP1 and proliferation-associated molecules, such as MKI67 and PCNA, in primary gliomas samples and recurrent gliomas samples (). Therefore, we next examined the possible function of NUSAP1 in the development of human glioma in siRNA knockdown studies of NUSAP1 in U251, T98, and P3 GBM cell lines in vitro. Each of the three siRNAs targeting NUSAP1 (siN1-1, siN1-2, and siN1-3) exhibited significant knockdown of NUSAP1 as demonstrated on western blot (). In EdU assays, the number of EdU positive cells decreased by ~ 30% relative to the control in all three cell lines transfected with siN1-2 and siN1-3, demonstrating that loss of NUSAP1 inhibited cell proliferation (). Silencing of NUSAP1 with siN1-2 and siN1-3 also significantly inhibited invasion capabilities of U251, T98, and P3 GBM cell lines in transwell assays and 3D invasion assays (, Supplementary Figure 1A and 1B).
Figure 2. Down-regulation NUSAP1 expression inhibits glioma cell proliferation and invasion, and induces apoptosis. A. Correlation between mRNA expression of NUSAP1 and proliferation-related molecules MKI67 and PCNA in primary and recurrent gliomas samples in the CGGA database. B. Western blot to confirm knockdown efficiency of NUSAP1 with siRNA in U251, T98, and P3 cells. C. Fluorescence microscopy of EdU incorporation in U251, T98, and P3-siN1-2,-3 siRNAs. Pollo 567 (red color) detects EdU, while DAPI (blue color) stains nuclei. Scale bar = 50 μm. D. Statistical analysis of the number of EdU-positive cells for U251, T98, and P3 cell lines transfected with siRNAs. All data are expressed as the mean ± SD of values from experiments performed in triplicate. **P < 0.01. E. Transwell invasion results of si-NC/N1-2,-3 in U251, T98 and P3 GBM cells for 24 h. Scale bar = 100 μm. F. Statistical results of the invasive ratio of si-NC/N1-2, −3 in U251, T98 and P3 GBM cells for 24 h. **P < 0.01. G. Flow cytometric analysis to detect apoptosis in U251, T98, and P3-siN1-2, −3 siRNA cells as determined by annexin V-and/or FITC and propidium iodide staining for DNA content. The percentages of annexin V-and/or FITC-positive cells are indicated.
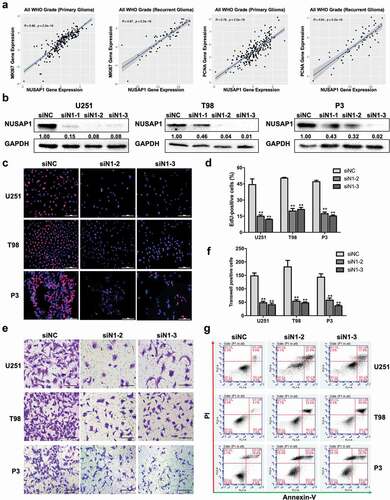
To identify possible cellular mechanisms involved in the inhibition of cell proliferation with loss of NUSAP1, we used flow cytometry to determine whether NUSAP1 knockdown induced apoptosis. Knockdown with siN1-2 and siN1-3 induced early (annexin V+/PI−) and/or late (annexin V+/PI+) stage apoptosis in all three cell lines (siN1-2/siN1-3 vs siNC, U251 ~ 2.7/2.23x; T98 ~ 6.4/9.7x; P3 ~ 1.4/1.5x; ). Taken together, these results indicated that NUSAP1 might promote malignant progression of GBM and thereby function as a potential oncogene.
Downregulation of NUSAP1 inhibits mRNA and protein expression levels of TOP2A in GBM cells
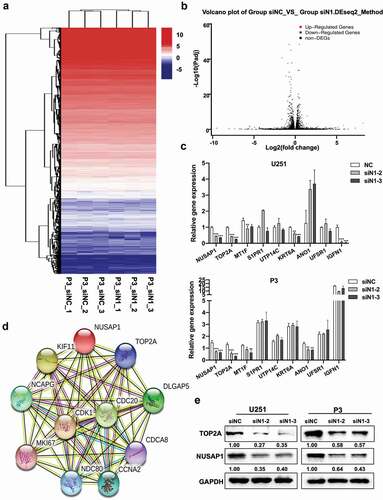
To further elucidate the molecular pathways mediating the putative oncogenic activity of NUSAP1, we first performed mRNA sequencing to identify gene expression changes following the silencing of NUSAP1 in P3 cells. The results demonstrated that loss of NUSAP1 led to significant downregulation of 8 genes, including MT1F, S1PR1, IGFN1, UTP14C, TOP2A, KRT6A, ANO1, and UFSP1, and upregulation of 5 genes, including SERF1B, ADCY10P1, DIRC3, INMT-MINDY4, and TMLHE-AS1, in P3 cells (). RT-qPCR confirmed that knockdown of NUSAP1 led to a decrease in TOP2A, MT1F, KRT6A and IGFN1 in U251 cells and TOP2A, MT1F and ANO1 in P3 cells (). We then used the bioinformatics analysis platform STRING to identify NUSAP1 association networks. STRING is a bioinformatics platform developed to aid in the prediction of protein association networks. This analysis yielded a potential relationship between NUSAP1 and TOP2A (). Western blot confirmed a possible relationship, demonstrating that knockdown of NUSAP1 led to decreased levels of TOP2A in U251 and P3 cell lines (~ 60% and 40%, respectively; ). These results demonstrated that loss of NUSAP1 directly altered expression of genes involved in cell proliferation, such as TOP2A.
Figure 3. Down-regulation of NUSAP1 inhibits mRNA and protein expression levels of TOP2A in GBM cells. A. Hierarchical clustering based on the differentially expressed genes obtained through RNA sequencing of P3 siNC and P3 siN1 cells. B. Significantly up- or down-regulated genes identified through analysis of RNA sequencing data obtained from stable knockdown of NUSAP1 in P3 cells. C. Results of quantitative RT-PCR with different primers. Data are shown as the mean ± SD. *P < 0.05, **P < 0.01 and ***P < 0.001. D. STRING, is a bioinformatics tool developed to aid in the prediction of protein association networks. E. Western blot analysis of NUSAP1 and TOP2A levels in U251 and P3 cell lines transfected with NUSAP1 siRNAs.
Loss of TOP2A inhibits proliferation and invasion, and induces apoptosis in GBM cells
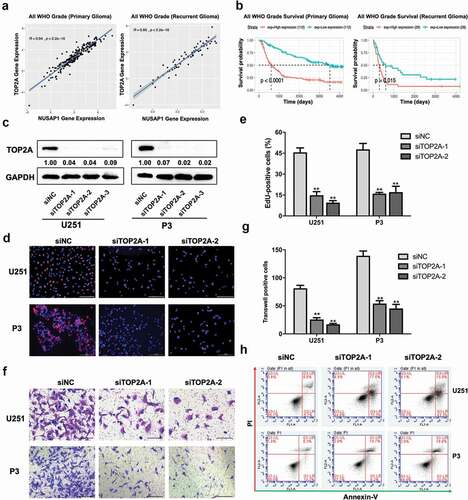
Analysis of molecular data from the CGGA showed a strong correlation between the expression of TOP2A and NUSAP1 in primary and recurrent gliomas samples (). Kaplan-Meier analysis of clinical and molecular data from the CGGA revealed that high TOP2A expression in primary and recurrent gliomas samples predicted shorter overall survival in patients (P < 0.0001 and P = 0.015, primary and recurrent glioma samples, respectively; ). We therefore further investigated the role of TOP2A in the development of human glioma by knocking down TOP2A expression in U251 and P3 GBM cells with three small-interfering RNAs, siTOP2A-1, siTOP2A-2, and siTOP2A-3. All three siRNAs achieved significant knockdown of TOP2A as assessed on western blot, and we therefore used siTOP2A-1 and siTOP2A-2 in functional experiments (). The percentage of EdU positive cells decreased by ~ 30% in U251 and P3 cells transfected with siTOP2A-1 and siTOP2A-2 relative to the control siRNA (siNC; ). The number of invading cells in transwell assays and 3D invasion assays also decreased significantly in U251 and P3 cells with knockdown of TOP2A (~ 60% in transwell assays and ~ 90% in 3D assays; , Supplementary Figure 1C and 1D) of glioma cells. Finally, to determine possible mechanisms contributing to the inhibition of cell growth, we used flow cytometry to determine whether TOP2A knockdown induced apoptosis. SiTOP2A-1 and siTOP2A-2 knockdown in both U251 and P3 cell lines led to up to ~ 4x and ~ 2x increase, respectively, in apoptosis (). Taken together, these results indicated that loss of TOP2A in GBM cells inhibited GBM cell growth by triggering apoptosis.
Figure 4. Down-regulation TOP2A expression inhibits glioma cell proliferation and invasion, and induces apoptosis in glioma cells. A. Correlation between NUSAP1 and TOP2A mRNA expression levels in primary and recurrent gliomas samples in the CGGA database. B. Kaplan-Meier analyses showing differences in overall survival for patients with low and high TOP2A expressing in primary and recurrent gliomas. The data were obtained from CGGA databases. C. Western blot to confirm siRNA knockdown efficiency of TOP2A in U251 and P3 cells. D. Fluorescence microscopy of EdU incorporation in U251 and P3-siTOP2A-1, −2 siRNAs. Pollo 567 (red color) detects EdU, while DAPI (blue color) stains nuclei. Scale bar = 50 μm. E. Statistical analysis of the number of EdU-positive cells for U251 and P3 cell lines transfected with siRNAs. All data are expressed as the mean ± SD of values from experiments performed in triplicate. **P < 0.01. F. Transwell invasion results of siNC/TOP2A-1, −2 U251 and P3 GBM cells for 24 h. Scale bar = 100 μm. G. Statistical results of the invasive ratio of siNC/TOP2A-1, −2 in U251 and P3 GBM cells for 24 h. **P < 0.01. H. Flow cytometric analysis of apoptosis in U251- and P3-siTOP2A-1,-2 siRNAs cells as determined with annexin V-and/or FITC and propidium iodide staining for DNA content. The percentages of annexin V-and/or FITC-positive cells are indicated.
Downregulation of NUSAP1 inhibits the expression of TOP2A and glioma growth and invasion in vivo
To investigate the effect of NUSAP1 on GBM tumor growth in vivo, we examined the effect of the loss of NUSAP1 in an orthotopic tumor model. We transduced U251 and P3 cells with a retrovirus containing an shRNA targeting NUSAP1, and implanted U251-shNC, U251-shNUSAP1, P3-shNC and P3-shNUSAP1 cells intracranially into nod-scid mice. Tumor size at 28 days was decreased in both U251- and P3-shNUSAP1 cells compared to controls based on the bioluminescence values of the mice (). Overall survival was also enhanced in animals bearing U251- or P3-shNUSAP1 tumors compared to shNC control groups (P < 0.01, ). H&E staining of tumor sections showed that tumor sizes and invasion were markedly decreased in both U251- and P3-shNUSAP1 xenografts compared to controls ().
Figure 5. Down-regulation of NUSAP1 inhibits the expression of TOP2A, and leads to reduced glioma growth and invasion in vivo. A. U251 cells expressing luciferase were orthotopically implanted into athymic nude mice. Tumor growth was monitored using the IVIS-200 imaging system for detection of bioluminescence. Bioluminescent signals were measured at days 7, 14, 21, and 28 after implantation. B. Kaplan-Meier survival analysis of overall survival, and log rank analysis to assess the statistical significance of the differences. C. Representative images of H&E staining and immunohistochemical staining for NUSAP1, MKI67, and TOP2A in xenograft sections from mice injected with U251- and P3-shNC or U251- and P3-shNUSAP1 cells. Scale bar = 100 μm. D. Graphic representation of IHC scoring for NUSAP1, MKI67, and TOP2A expression in xenograft sections. All data are presented as the mean ± SD, **P < 0.01.
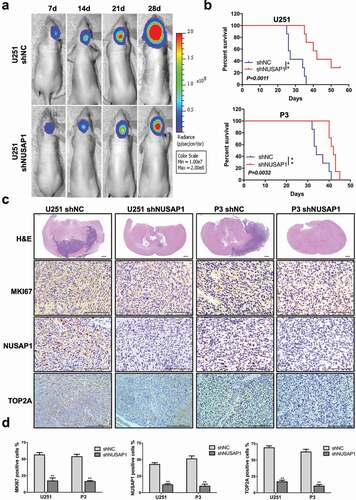
Finally, immunohistochemical staining performed on xenograft sections demonstrated that MKI67 and TOP2A as well as NUSAP1 were decreased in U251- and P3-shNUSAP1 xenografts compared with U251- and P3-shNC xenografts ().
Discussion
Molecular targeted therapy has become a promising treatment strategy for prolonging the survival of cancer patients, including those with GBM. Therefore, identifying new therapeutic targets is essential for designing more effective tumor-specific regimens. In this study, we demonstrated that NUSAP1, a gene involved in mitotic regulation, might also promote the malignant progression of human GBM. Analysis of the clinical and molecular data from CGGA, TCGA and Rembrandt databases revealed high expression of NUSAP1 in high-grade glioma tissues relative to non-neoplastic brain tissue samples. Immunohistochemistry performed on our own cohort of primary tumor samples confirmed that expression of NUSAP1 increased with increasing glioma grade. Moreover, NUSAP1 overexpression was significantly correlated with poor patient survival. In functional studies, knockdown of NUSAP1 inhibited GBM cell growth in vitro and in vivo. Finally, loss of NUSAP1 triggered apoptosis which might be due to the concomitant loss of TOP2A. These results indicate that NUSAP1 might have a role as an oncogene in the development of human GBM and may serve as a novel molecular target in therapeutic treatment of the disease.
NUSAP1 plays an important role in spindle formation, bundling microtubules, attachment to chromosomes and mitotic regulation [Citation19,Citation20]. It has been implicated in the development, progression, metastasis, and poor prognosis in a variety of cancer types, including non-small-cell lung cancer [Citation21], bladder cancer [Citation15], astrocytoma [Citation22], colorectal cancer [Citation11], and cervical carcinoma [Citation9]. Knockout of NUSAP1 has been shown to inhibit cell proliferation, migration and invasion through loss of DNMT1 expression in human colorectal cancer [Citation11]. Zulfiqar investigated NUSAP1 as a novel biomarker in prostate cancer after surgery [Citation23]. Our study also demonstrated that the knockdown of NUSAP1 with siRNA, as in the colorectal cancer model, inhibited proliferation and invasion in U251, T98, and P3 GBM cell lines. We also found that the cellular process underlying suppression of cell growth might be the induction of apoptosis.
To reveal possible pathways mediating this response, we used RNA sequencing to identify genes co-regulated with loss of NUSAP1 in the P3 GBM cell line. RNA sequencing showed that knockdown of NUSAP1 significantly downregulated expression of 8 genes, MT1F, S1PR1, IGFN1, UTP14C, TOP2A, KRT6A, ANO1, and UFSP1, and upregulated 5 genes, including SERF1B, ADCY10P1, DIRC3, INMT-MINDY4, and TMLHE-AS1. RT-qPCR was used to confirm a decrease in TOP2A and MT1F in both U251 and P3 cell lines induced with knockdown of NUSAP1. Using the STRING platform, we identified potential signaling pathways associated with these genes and showed that NUSAP1 expression was correlated with KIF11, TOP2A, NCAPG, DLGAP5, CDC20, CDK1, MKI67, NDC80, and CCNA2. Based on the results of our analysis of public databases, our RNA-seq and RT-qPCR data, we further investigated the relationship between NUSAP1 and TOP2A. Western blot analysis revealed that loss of NUSAP1 led to decreased protein levels of TOP2A in U251 and P3 GBM cells.
Topoisomerase 2A (TOP2A), a member of the DNA topoisomerases, is an enzyme controlling DNA super-helicity and unlinks double-stranded DNA segments during cellular processes such as replication and transcription [Citation24,Citation25]. Many studies have shown that TOP2A plays a crucial role in the tumorigenesis and progression of a variety of malignancies, such as adrenocortical carcinoma [Citation26], bladder cancer [Citation27], prostate cancer [Citation28], liver cancer [Citation29], and breast cancer [Citation25,Citation30]. Analysis of the molecular data in the CGGA database confirmed that there was a strong correlation between TOP2A and NUSAP1 expression in gliomas samples. High TOP2A expression in primary and recurrent gliomas predicted shorter overall survival in patients. In functional studies, knockdown of TOP2A in U251 and P3 GBM cells suppressed cell proliferation and invasion capabilities possibly through the induction of apoptosis. Taken together, our data indicated that TOP2A might act downstream of NUSAP1 in the development and progression of GBM.
In conclusion, we demonstrated that NUSAP1 inhibits proliferation and invasion of GBM cells in vitro and in vivo possibly through the triggering of apoptosis. The induction of apoptosis might be due to the concomitant downregulation of the expression of TOP2A. Thus, our study provides new insights into the possible oncogenic role of NUSAP1 in the development of human GBM and furthermore demonstrates the therapeutic relevance of silencing NUSAP1 in malignant human brain tumors.
Supplemental Material
Download TIFF Image (2.6 MB)Acknowledgments
The authors thank Prof. Rolf Bjerkvig for providing the primary P3 GBM tumor cell line.
Disclosure statement
No potential conflict of interest was reported by the author(s).
Supplementary material
Supplemental data for this article can be accessed online at https://doi.org/10.1080/15384101.2022.2074199
Additional information
Funding
References
- Alifieris C, Trafalis DT. Glioblastoma multiforme: pathogenesis and treatment. Pharmacol Ther. 2015;152:63–82.
- Minniti G, Lombardi G, Paolini S. Glioblastoma in elderly patients: current management and future perspectives. Cancers (Basel). 2019;11(3).
- Avril T, Etcheverry A, Pineau R, et al. CD90 expression controls migration and predicts Dasatinib response in Glioblastoma. Clin Cancer Res. 2017;23(23):7360–7374.
- Bush NA, Chang SM, Berger MS. Current and future strategies for treatment of glioma. Neurosurg Rev. 2017;40(1):1–14.
- Vollmann-Zwerenz A, Leidgens V, Feliciello G, et al. Tumor cell invasion in Glioblastoma. Int J Mol Sci. 2020;21(6).
- Altinoz MA, Elmaci I. Targeting nitric oxide and NMDA receptor-associated pathways in treatment of high grade glial tumors. hypotheses for nitro-memantine and nitrones. Nitric Oxide. 2018;79:68–83.
- Kotian S, Banerjee T, Lockhart A, et al. NUSAP1 influences the DNA damage response by controlling BRCA1 protein levels. Cancer Biol Ther. 2014;15(5):533–543.
- Raemaekers T, Ribbeck K, Beaudouin J, et al. NuSAP, a novel microtubule-associated protein involved in mitotic spindle organization. J Cell Biol. 2003;162(6):1017–1029.
- Li H, Zhang W, Yan M, et al. Nucleolar and spindle associated protein 1 promotes metastasis of cervical carcinoma cells by activating Wnt/beta-catenin signaling. J Exp Clin Cancer Res. 2019;38(1):33.
- Gulzar ZG, McKenney JK, Brooks JD, et al. Increased expression of NuSAP in recurrent prostate cancer is mediated by E2F1. Oncogene. 2013;32(1):70–77. DOI:10.1038/onc.2012.27.
- Han G, Wei Z, Cui H, et al. NUSAP1 gene silencing inhibits cell proliferation, migration and invasion through inhibiting DNMT1 gene expression in human colorectal cancer. Exp Cell Res. 2018;367(2):216–221.
- Ge Y, Li Q, Lin L, et al. Downregulation of NUSAP1 suppresses cell proliferation, migration, and invasion via inhibiting mTORC1 signalling pathway in gastric cancer. Cell Biochem Funct. 2020;38(1):28–37.
- Guo H, Zou J, Zhou L, et al. NUSAP1 promotes gastric cancer tumorigenesis and progression by stabilizing the YAP1 protein. Front Oncol. 2020;10:591698.
- Roy S, Hooiveld GJ, Seehawer M, et al. microRNA 193a-5p regulates levels of nucleolar- and spindle-associated protein 1 to suppress hepatocarcinogenesis. Gastroenterology. 2018;155(6):1951–66 e26.
- Gao S, Yin H, Tong H, et al. Nucleolar and Spindle Associated Protein 1 (NUSAP1) promotes bladder cancer progression through the TGF-beta signaling pathway. Onco Targets Ther. 2020;13:813–825.
- Chen Y, Liu J, Zhang W, et al. O-GlcNAcylation enhances NUSAP1 stability and promotes bladder cancer aggressiveness. Onco Targets Ther. 2021;14:445–454.
- Zhou W, Wang J, Qi Q, et al. Matrine induces senescence of human glioblastoma cells through suppression of the IGF1/PI3K/AKT/p27 signaling pathway. Cancer Med. 2018;7(9):4729–4743.
- Zhou W, Xu G, Wang Y, et al. Oxidative stress induced autophagy in cancer associated fibroblast enhances proliferation and metabolism of colorectal cancer cells. Cell Cycle. 2017;16(1):73–81.
- Wadia PP, Coram M, Armstrong RJ, et al. Antibodies specifically target AML antigen NuSAP1 after allogeneic bone marrow transplantation. Blood. 2010;115(10):2077–2087.
- Nie J, Wang H, He F, et al. Nusap1 is essential for neural crest cell migration in zebrafish. Protein Cell. 2010;1(3):259–266.
- Xu Z, Wang Y, Xiong J, et al. NUSAP1 knockdown inhibits cell growth and metastasis of non-small-cell lung cancer through regulating BTG2/PI3K/Akt signaling. J Cell Physiol. 2020;235(4):3886–3893.
- Wu X, Xu B, Yang C, et al. Nucleolar and spindle associated protein 1 promotes the aggressiveness of astrocytoma by activating the Hedgehog signaling pathway. J Exp Clin Cancer Res. 2017;36(1):127.
- Gulzar ZG, McKenney JK, Brooks JD. Increased expression of NuSAP in recurrent prostate cancer is mediated by E2F1. Oncogene. 2013;32(1):70–77.
- Drlica K, Zhao X. DNA gyrase, topoisomerase IV, and the 4-quinolones. Microbiol Mol Biol Rev. 1997;61(3):377–392.
- Seoane JA, Kirkland JG, Caswell-Jin JL, et al. Chromatin regulators mediate anthracycline sensitivity in breast cancer. Nat Med. 2019;25(11):1721–1727.
- Jain M, Zhang L, He M, et al. TOP2A is overexpressed and is a therapeutic target for adrenocortical carcinoma. Endocr Relat Cancer. 2013;20(3):361–370.
- Zeng S, Liu A, Dai L, et al. Prognostic value of TOP2A in bladder urothelial carcinoma and potential molecular mechanisms. BMC Cancer. 2019;19(1):604.
- de Resende Mf, Vieira S, Chinen LTD, et al. Prognostication of prostate cancer based on TOP2A protein and gene assessment: TOP2A in prostate cancer. J Transl Med. 2013;11(1):36.
- Liu LM, Xiong DD, Lin P, et al. DNA topoisomerase 1 and 2A function as oncogenes in liver cancer and may be direct targets of nitidine chloride. Int J Oncol. 2018;53(5):1897–1912.
- Yang Z, Liu Y, Shi C, et al. Suppression of PTEN/AKT signaling decreases the expression of TUBB3 and TOP2A with subsequent inhibition of cell growth and induction of apoptosis in human breast cancer MCF-7 cells via ATP and caspase-3 signaling pathways. Oncol Rep. 2017;37(2):1011–1019.