
ABSTRACT
Breast carcinoma is one of the common causes of cancer-related mortality in women. Maternally expressed gene 3 (MEG3), a lncRNA located at 14q32, can be involved in carcinogenesis. In this study, we discovered that MEG3 was downregulated by CpG hypermethylation within its gene promoter. Functionally, treatment of breast cancer cells with the DNA methylation inhibitor 5-AzadC as well as silencing of DNA methyltransferase-1 (DNMT1) could decrease the abnormal hypermethylation of the MEG3 promoter, reverse MEG3 expression, inhibit cell proliferation and promote cell apoptosis. In addition, we found that MEG3 expression was negatively correlated with DNMT1. Mechanistically, MEG3 knockdown combined with 5-AzadC or sh-DNMT1 treatment restored the expression of Notch1 receptor, leading to the Notch1 pathway activation, and promoted the progression of epithelial mesenchymal transformation (EMT). Finally, the mice tumor model experiments showed that DNMT1 knockdown can increase MEG3 expression and inhibit tumor growth. Collectively, our findings uncovered that DNMT1-mediated MEG3 demethylation leads to MEG3 upregulation, which in turn inhibits the Notch1 pathway and EMT process in breast cancer.
1. Introduction
Breast cancer remains a major health problem and is the most frequently diagnosed cancer in women [Citation1]. It is also one of the most common malignant tumor in China [Citation2]. Advances in early diagnosis and therapies have resulted in a 38% decrease in mortality of breast cancer patients, but almost all the patients who develop organ metastatic disease and high postoperative recurrence will succumb to it [Citation3–5]. Therefore, there is a pivotal need for novel strategies, especially molecular targets, to improve the treatment of breast cancer.
Long non-coding RNAs (lncRNAs) are a class of transcripts more than 200 nucleotides in length with limited or no protein-coding ability [Citation6]. Increasing evidence indicates that significant numbers of lncRNAs are involved in a variety of tumor biological processes such as proliferation, apoptosis, invasion and metastasis, etc. [Citation7,Citation8]. Aberrant expressions of lncRNAs including GAS5, NEAT1, ROPM, and MEG3 have been reported in breast cancer [Citation9–12]. Among them, lncRNA MEG3 is an imprinted gene belonging to the imprinted DLK1-MEG3 locus located at chromosome 14q32.3 in humans [Citation13]. The loss of MEG3 expression has been found in many human tumors [Citation12,Citation14]. Notably, it was reported that MEG3 is downregulated in breast cancer and plays a negative role in tumor cell biological processes [Citation15,Citation16]. Therefore, it has been hypothesized that MEG3 is a tumor suppressor gene. However, the specific mechanisms of unusually low expression of MEG3 in breast cancer are still unclear. Previous studies indicated that MEG3 is downregulated by aberrant CpG methylation at its promoters in a variety of tumors such as esophageal cancer, hepatocellular carcinoma, etc., which is associated with the expression of DNA methyltransferases (DNMTs) [Citation17,Citation18]. It also suggested that DNMT1 overexpression may be responsible for the aberrant DNA methylation of tumor-related genes in gliomas [Citation19]. Meanwhile, MEG3 overexpression inhibited breast cancer cell proliferation and invasion, suggesting that MEG3 expression may also be regulated by aberrant CpG methylation [Citation15]. More importantly, treatment with a DNA methylation inhibitor, 5-aza-2-deoxycytidine (5-AzadC), resulted in re-expression of MEG3 in multiple human breast cancer tumor cell lines [Citation20]. Collectively, DNA methylation-mediated epigenetic control of MEG3 may play an important role in the process of breast cancer. Therefore, in this study, we sought to investigate the expression and promoter methylation status of MEG3 as well as its function and molecular mechanisms in breast cancer.
2. Materials and methods
2.1. Patients and specimens
A total of 28 paired cancerous and matched paracancerous tissues that were at least 2 cm away from the edge of the tumors were collected from patients by radical breast cancer resection in the First Affiliated Hospital of the University of Science and Technology (USTC) of China. The diagnosis of all the tumor tissues was confirmed by pathologists based on World Health Organization (WHO) classification. The data, including age, primary tumor size, lymph nodes metastasis, histological grade, estrogen receptor (ER) status, progesterone receptor (PR) status, HER-2 status, and subtype, were obtained from clinical and pathological records. The clinicopathological characteristics of all the breast cancer patients are outlined in . Fresh tumor samples were immediately frozen in liquid nitrogen, perfectly preserved at −80°C and stored until use. The present research was approved by the Ethics Committee of the USTC of China. Informed consent was signed by all of the enrolled patients.
Table 1. Clinical characteristics of breast cancer patients.
2.2. Cell culture and transfection
The human breast tumor cell lines MCF-7 and MDA-MB-231 were a kind gift from Pro. Tao Zhu (USTC of China). The normal breast mammary epithelial cell line MCF-10A was obtained from the Cell Bank of the Chinese Academy of Science (Shanghai, China). All cells are cultured in DMEM containing 10% fetal bovine serum (FBS, Gibco, USA), 100 U/mL penicillin and 50 μg/mL streptmycin, and maintained at 37°C incubator with 5% CO2. Small-interfering RNA oligonucleotides against DNMT1 gene (si-DNMT1), scrambled sequence (sncRNA), shRNA-DNMT1 (sh-DNMT1), shRNA-MEG3 (shMEG3) or control (shRNA-NC) were synthesized by GenePharma (Generay, Shanghai, China). Furthermore, MEG3 overexpression plasmid pcDNA3.1-MEG3 (pcDNA-MEG3) or control (pcDNA3.1 vector) was also synthesized by GenePharma. All transfection was performed using Lipofectamine 2000 (Invitrogen, Carlsbad, USA) according to the manufacturer’s protocol. Thus, the cells were harvested for further evaluation at 48 h after transfection.
2.3. Methylation analysis of MEG3 CpG islands by methylation-specific polymerase chain reaction (MSP) and bisulfite genomic sequencing (BGS)
Genomic DNA was extracted using the QIAamp DNA mini kit (QIAGEN, Hilden, Germany). The MSP and BGS were performed as previously described [Citation21]. The primers of the MEG3 gene for MSP that included one specific for the methylated sequence (MEG3-M, forward, 5’-TTCGTATTTTTCGATGGATGTTTC-3’; reverse, 5’-ATATATAAAAAAAATCGCCCCGAT-3’) and the other for the unmethylated sequence (MEG3-U, forward, 5’-TTGTATTTTTTGATGGATGTTTTGA-3’; reverse, 5’-CAATATATAAAAAAAATCACCCCAAT-3’). The primers of the MEG3 gene for BGS were used: forward, 5’-TTTAGTGGAAGAGGAAGGGGTATAG-3’; reverse, 5’-CCAAACAAAATAAATTCAAACACAAT-3’.
2.4. Demethylation experiments using 5-aza-2’-deoxycytidine
Demethylation treatment with 5-AzadC (Sigma-Aldrich, St Louis, USA) was performed as previously reported [Citation22].
2.5. Quantitative real-Time PCR
Total RNA was extracted from tissues and cells by using TRIzol reagent (Invitrogen, Carlsbad, USA). Reverse transcription was performed using a first-strand cDNA synthesis kit (Fermentas, USA) according to the manufacturer’s instructions. Quantitative real-time PCR analysis was conducted by using SYBR Green PCR master mix (QIAGEN, Germany) in an Applied Biosystem 7500 instrument (ABI, USA). The relative gene expression was calculated by using the 2−ΔΔct method and expressed as fold change relative to the respective control. All amplifications were normalized by GAPDH. Primers are listed in Supplementary Table 1.
2.6. Western blot analysis
Cells were lysed and harvested in RIPA lysis buffer (Beyotime, China). Total protein concentrations were quantified with a Bicin Choninic Acid (BCA) protein assay kit (Boster, Wuhan, China). Fifty micrograms of protein was separated by denaturing 8% or 10% sodium dodecyl sulfate-polyacrylamide gel electrophoresis (SDS-PAGE) and electrotransferred to PVDF membranes (Millipore Corporation, Billerica, USA). After blocking with 5% milk, membranes was incubated with the following antibodies overnight at 4°C: anti-DNMT-1, anti-Notch1, anti-HES1, anti-N-cadherin, anti-E-cadherin, anti-cyclinD1, anti-Vimentin and anti-Ki-67 (Cell Signaling Technology Inc., USA), anti-Bax (Zen BioScience, Chengdu, China), anti-Bcl-2 (Boster Biological Technology, Wuhan, China), anti-GAPDH (Santa Cruz Biotechnology Inc., Santa Cruz, CA) as a control. Anti-mouse IgG and anti-rabbit IgG horseradish peroxidase-conjugated antibodies were used as secondary antibodies correspondingly. The proteins were detected by chemiluminescence reagents (Model No. ChemiQ 4600, Bioshine).
2.7. Cell proliferation assay and colony formation assay
The cell proliferation capacity was assessed by using Cell Counting Kit-8 (CCK-8) and colony formation assay. At 0, 24, 48 and 72 h after siRNA transfection or 5-AzadC treatment, the CCK-8 solution was added to each well and incubated for 4 h. The absorbance was measured at 450 nm using a microplate reader SpectraMax i3x microplate (Molecular Devices, USA).
With respect to colony formation assay, cells were seeded in six-well plates after 72 h of siRNA transfection or 10 μM 5-AzadC treatment, and then cultured for 14 d in culture medium with 10% FBS as previously performed [Citation9].
2.8. Apoptosis analysis
Seventy-two hours after the transfection or treatment as described above, quantification of apoptotic cells was measured by Annexin-V-FITC Apoptosis Detection Kit (Bestbio, China) according to the protocols. Analyses were conducted using a CytoFLEX flow cytometer (Beckman Coulter).
2.9. In vivo tumor model
BALB/c nude mice (aged 4–6 wk, weighing 18–22 g) were obtained from Slake Jingda Laboratory Animal Company (Hunan, China) and housed under pathogen-free conditions. The mice were randomly divided into two groups (n = 6/group). MDA-MB-231 cells with shRNA-DNMT1 or shRNA-NC were subcutaneously injected into the left armpits (200 μl) of nude mice, respectively. Tumor growth was measured every 5 d, and tumor volume was calculated with the equation: volume = 0.5 × width2 × length. After 25 d, all mice were sacrificed and tumors were separated and photographed.
2.10. Statistical analysis
Data were expressed as the mean ± standard deviation and analyzed using SPSS 19.0 statistics software (SPSS Inc., USA). Significant differences were analyzed between two groups using Mann–Whitney U test or Student’s t test, and among several groups using one-way analysis of variance (ANOVA). The statistical significance was defined as *P < 0.05 or **P < 0.01. All experiments were performed in triplicate.
3. Results
3.1. LncRNA MEG3 was hypermethylated and downregulated in human breast cancer tissues and cells lines
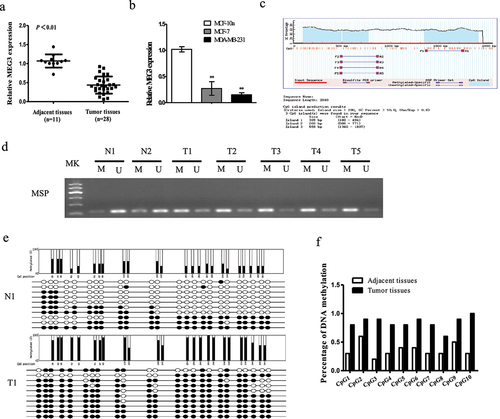
We first detected the expression status of MEG3 in tumor tissues (n = 28) and adjacent tissues (n = 11) of breast cancer by qRT-PCR. The results showed that the expression of MEG3 was downregulated in tumor tissues than in normal tissues. Consistently, MEG3 was highly expressed in MCF10A cells, but greatly decreased in MCF-7 and MDA-MB-231 cell lines ()). A typical CpG island (CGI) was identified in the MEG3 gene near exon 1 using the CGI Searcher (http://ccnt.hsc.usc.edu/cpgislands2) according to three parameters: Island size >200 bp, GC content >50%, and Obs CpG/Exp CpG >0.60 ()), suggesting MEG3 was sensitive to methylation-mediated silencing. To explore whether the MEG3 silencing in breast cancer is related to promoter hypermethylation, we analyzed the methylation status of MEG3 CGI with MSP in tumor tissues. As expected, complete methylated status was demonstrated in tumor tissues. It showed that the methylation rate of the promoter region of MEG3 was 71.42% (20/28) in breast cancer tissues, and 18.18% (2/11) in 11 normal tissues ()). The MSP results were further confirmed by BGS analysis of the methylation status of MEG3 in breast cancer and adjacent tissues ()). The above results suggested that the promoter of MEG3 represented hyper-methylation status in breast cancer.
Figure 1. Methylation of MEG3 promoter and downregulation of MEG3 in human breast cancer samples and cells lines. (a) The MEG3 expression was detected by qRT-PCR in breast cancer samples. (b) The MEG3 expression was detected by qRT-PCR in MCF-7 and MDA-MB-231 cells. (c) Schematic representation of percent guanine (g) and cytosine (C) nucleotides of the MEG3 gene and location of CpG dinucleotides. (d) MEG3 hypermethylation was observed in human breast cancer samples by MSP method. (e) Methylation status of MEG3 promoter region of paracancerous tissues and breast cancer samples was analyzed by BSP method. (f). Percentage of DNA methylation. Data are shown as the mean ± SD (n = 3). *P < 0.05, **P < 0.01 vs. respective control.
In order to further ascertain downregulation of MEG3 is related to methylation, the breast cancer cells were treated with an inhibitor of DNA methylation 5-AzadC. As shown in ), after being treated with 10 µM 5-AzadC, the MEG3 expression was obviously upregulated, whereas DNMT1 expression was markedly downregulated, but there was no significance when treated with 2.5 µM or 5 µM 5-AzadC. Additionally, the promoter methylation of MEG3 in MCF-7 ()) or MDA-MB-231 ()) cells was reduced. These results revealed that the promoter methylation was responsible for the MEG3 downregulation in breast cancer cells.
Figure 2. 5-AzadC treatment induced MEG3 promoter demethylation and MEG3 expression in breast cancer cells. (a and b) Cells were treated with different concentrations of 5-AzadC (2.5, 5 or 10 µM). The expression levels of MEG3 and DNMT1 were detected by qRT-PCR in MCF-7 and MDA-MB-231 cells. (c and d) Cells were treated with 10 µM 5-AzadC. The MEG3 promoter methylation level was detected by MSP method. Data are shown as the mean ± SD (n = 3). *P < 0.05, **P < 0.01 vs. respective control.
3.2. Demethylation of MEG3 by 5-AzadC inhibits cell proliferation and induces apoptosis in breast cancer cells
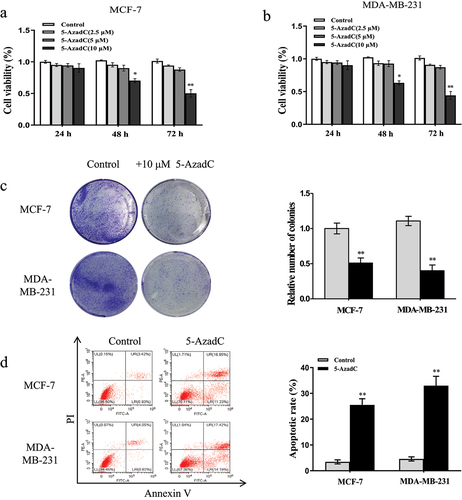
To uncover the function of demethylation of MEG3 by 5-AzadC in breast cancer, the CCK8, colony formation, and apoptosis assays were performed. As described in ), the CCK8 assay indicated that the cell viability of MCF-7 and MDA-MB-231 cells was remarkably suppressed after treated with 10 µM 5-AzadC for 48 h and 72 h. Consistently, treatment with 10 µM 5-AzadC strikingly decreased colony formation ability of MCF-7 and MDA-MB-231 cells compared to the corresponding controls ()). Furthermore, flow cytometry analysis observed that 10 µM 5-AzadC significantly induced MCF-7 and MDA-MB-231 cells apoptosis compared with the control group ()). Overall, all of the data concluded that demethylation of the MEG3 promoter inhibited the proliferation and induced apoptosis of breast cancer cell lines.
Figure 3. 5-AzadC treatment inhibits cell proliferation and induces cells apoptosis in breast cancer cells. (a and b) Cells were treated with different concentrations of 5-AzadC (2.5, 5 or 10 µM). The cell viability was measured by CCK8 in MCF-7 and MDA-MB-231 cells. (c) Cells were treated with 10 µM 5-AzadC. The colony forming ability was detected by colony forming assay. (d) Cells were treated with 10 µM 5-AzadC. The cell apoptosis was detected by flow cytometry. Data are shown as the mean ± SD (n = 3). *P < 0.05, **P < 0.01 vs. respective control.
3.3. DNMT1 mediates hypermethylation of MEG3 in breast cancer cells
To further investigate the possible effect of DNMT1 on the methylation of the MEG3 gene promoter, we evaluated the expression and function of DNMT1 in breast cancer. The results in ) demonstrated that the expression of DNMT1 was strongly increased in breast cancer tumor tissues (n = 28) compared with that in adjacent tissues (n = 11). Furthermore, the mRNA expression level of DNMT1 was negatively correlated with MEG3 level in breast cancer tissues ()). Then, DNMT1 expression was downregulated in breast cancer cells by si-DNMT1 compared with their counterparts ()). Further, the MSP assay showed that lowering of DNMT1 in MCF-7 and MDA-MB-231 cells reversed the MEG3 methylation and restored the MEG3 expression ()).
Figure 4. DNMT1 mediates hypermethylation of MEG3 in breast cancer cells. (a) The DNMT1 mRNA expression was detected by qRT-PCR in breast cancer samples. (b) The DNMT1 mRNA expression was negatively correlated with MEG3 expression in breast cancer samples. (c and d)Cells were transfected with si-DNMT1 or sncRNA. The expression levels of MEG3 and DNMT1 were detected by qRT-PCR in MCF-7 and MDA-MB-231 cells. (e) Cells were transfected with si-DNMT1 or sncRNA. The MEG3 promoter methylation level was detected by MSP method. Data are shown as the mean ± SD (n = 3). *P < 0.05, **P < 0.01 vs. respective control.
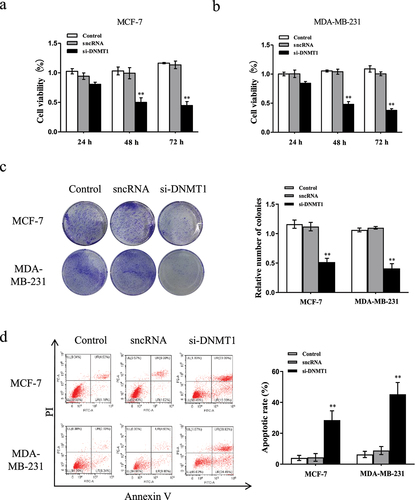
Moreover, the data from CCK8 assay indicated that transfection with si-DNMT1 for 48 h and 72 h could reduce the cell viability of MCF-7 and MDA-MB-231 cells compared to its control sncRNA ()). Subsequently, the colony formation assay observed that transfection with si-DNMT1 dramatically inhibited the colony formation ability in MCF-7 and MDA-MB-231 cells compared to sncRNA ()). As described in ), it suggested that DNMT1 knockdown substantially increased the MCF-7 cells apoptosis by about 25% and MDA-MB-231 cells apoptosis by about 40% compared to their negative controls. Taken together, these data demonstrated that DNMT1 mediated hypermethylation of MEG3 expression levels, which positively correlated with breast cancer proliferation potentialities, suggesting that MEG3 was implicated in breast cancer progression.
Figure 5. DNMT1 knockdown inhibits cell proliferation and induced cells apoptosis in breast cancer cells. Cells were transfected with si-DNMT1 or sncRNA. (a and b) The cell viability was measured by CCK8 in MCF-7 and MDA-MB-231 cells. (c) The colony forming ability was detected by colony forming assay. (d) The cell apoptosis was detected by flow cytometry. Data are shown as the mean ± SD (n = 3). *P < 0.05, **P < 0.01 vs. respective control.
3.4. Demethylation of MEG3 inhibits EMT and Notch1 signaling pathway in breast cancer cells
Next, we attempted to explore the underlying mechanisms of MEG3 methylation. As shown in , compared with the controls, the mRNA expression levels of DNMT1, Notch1, HES1, N-cadherin, Vimentin, Cyclin D1 were significantly decreased, whereas E-cadherin was increased by treated with 10 µM 5-AzadC in MCF-7 and MDA-MB-231 cells ()). In accordance with the aforementioned results, the protein expression levels of DNMT1, Notch1, HES1, N-cadherin, Vimentin, Cyclin D1 were decreased and E-cadherin was increased ()). Meanwhile, as illustrated in , DNMT1 sliencing by transfected with si-DNMT1 notably declined the mRNA and protein expression levels of DNMT1, Notch1, HES1, N-cadherin, Vimentin, Cyclin D1, whlile enhanced the levels of E-cadherin in breast cancer cells compared to negative control ()
Figure 6. Epigenetic silencing of MEG3 represses the Notch1 pathway in breast cancer cells. (a and c) Cells were treatment with 10 µM 5-AzadC. The mRNA and protein expression levels of DNMT1, Notch1, HES1, E-cadherin, N-cadherin, Vimentin, and CyclinD1 were detected by qRT-PCR and western blot in MCF-7 and MDA-MB-231 cells. (b and d) Cells were transfected with si-DNMT1 or sncRNA. The mRNA and protein expression levels of DNMT1, Notch1, HES1, E-cadherin, N-cadherin, Vimentin, and CyclinD1 were detected by qRT-PCR and western blot in MCF-7 and MDA-MB-231 cells. (e) Cells were transfected with pcDNA-MEG3 or co-treated with 10 µM 5-AzadC. The expression level of MEG3 was detected by qRT-PCR in MDA-MB-231 cells. (f) Cells were co-transfected with pcDNA-MEG3 and shNDMT1. The expression level of MEG3 was detected by qRT-PCR in MDA-MB-231 cells. (g) Cells were transfected with pcDNA-MEG3 or co-treatment with 10 µM 5-AzadC. The mRNA and protein expression levels of DNMT1, Notch1, HES1, E-cadherin, N-cadherin, Vimentin, and CyclinD1 were detected by qRT-PCR and western blot in MDA-MB-231 cells. (h) Cells were co-transfected with pcDNA-MEG3 and shNDMT1. The mRNA and protein expression levels of DNMT1, Notch1, HES1, E-cadherin, N-cadherin, Vimentin, and CyclinD1 were detected by qRT-PCR and western blot in MDA-MB-231 cells. Data are shown as the mean ± SD (n = 3). *P < 0.05, **P < 0.01 vs. respective control.
Figure 6. Continued
Further, the expression level of MEG3 was overexpressed in the pcDNA-MEG3, sh-DNMT1 or 5-AzaC group relative to corresponding controls in the MDA-MB-231 cells ()). More interesting, when MDA-MB-231 cells transfected with sh-MEG3 and then co-treated with 5-AzaC, we found that MEG3 expression level was obviously decreased ()). Similar results were obtained after being co-treated with sh-DNMT1 ()). As described in ), the data revealed that compared to relevant controls, the protein expression levels of DNMT1, Notch1, HES1, N-cadherin, Vimentin, and Cyclin D1 were significantly decreased whereas E-cadherin distinctly increased in MDA-MB-231 cells transfected with pcDNA-MEG3, sh-DNMT1 or 5-AzadC. Moreover, the results were consistent with the previous findings after being treated with sh-MEG3 + 5-AzadC or sh-MEG3+ sh-DNMT1. The protein expression levels of DNMT1, Notch1, HES1, N-cadherin, E-cadherin, Vimentin, and Cyclin D1 were apparently reversed ()). Remarkably, we found evidence that DMNT1-mediated epigenetic silencing of MEG3 led to activation of the Notch1 signaling pathway and promoted the occurrence of EMT in breast cancer cells.
3.5 Downregulation of DNMT1 inhibits tumor growth in nude mice
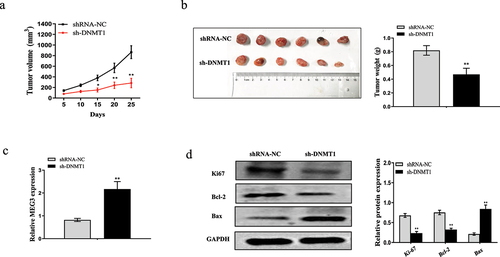
Nude mice xenografts model was applied to further assess the role of DNMT1 in tumorigenicity of breast cancer cells. As shown in ), the average volume and weight of the tumors were significantly lower in the sh-DNMT1 group than that in shRNA-NC. Consistent with previous results, we confirmed that the expression of MEG3 was upregulated in the sh-DNMT1 group compared with shRNA-NC ()). In addition, downregulated DNMT1 suppressed the expression levels of Ki-67, Bcl-2 and increased the expression level of Bax ()). Collectively, these data together demonstrated that downregulation of DNMT1 decreased MEG3 level, induced apoptosis and inhibited tumor growth in vivo.
Figure 7. Downregulated DNMT1 inhibits tumor growth in vivo. MDA-MB-231 cells infected sh-DNMT1 or shRNA-NC were subcutaneously injected into the nude mice. (a) The tumor volume was measured every 5 d for 25 d. (b) The representative photographs and average weights of dissected tumors. (c) The expression of MEG3 in resected tumor masses was detected by qRT-PCR. (d) The protein expressions of Ki67, Bcl-2 and Bax in resected tumor masses were detected by western blot analysis. Data are shown as the mean ± SD (n = 3). *P < 0.05, **P < 0.01 vs. respective control.
4. Discussion
Despite the clinical development of screening and treatment, metastatic breast cancer is one of the leading causes of cancer-related death among women [Citation23–25]. According to the cancer statistics estimates, about 266,120 new breast cancer cases and 40,920 breast cancer deaths occurred in 2018 [Citation26]. Accumulating data support a key role for the targeted therapies in treatment of malignant tumor cells by interfering with the transduction of key signaling pathways or inhibiting the function of tumor-specific molecules, thus improving the survival of cancer patients significantly [Citation27].
Recently, the explosion of clinical and experimental data on tumor-related lncRNAs have ushered new promises. Dysregulation of lncRNAs have been reported to play key roles in proliferation, invasion and metastasis of tumor cells [Citation28–30]. LncRNA maternally expressed gene 3 (MEG3) was downregulated in a variety of human tumors, such as breast cancer, cervical cancer, gastric cancer, and colorectal cancer [Citation31–34]. In addition, Zhang et al. [Citation35] showed that upregulation of MEG3 inhibited cell proliferation, colony formation and promoted cell apoptosis in MDA-MB-231 cells. Consistently, we showed the similar result that MEG3 was excellently decreased in breast cancer tissues and breast cancer cell lines. Overexpression of MEG3 inhibits breast cancer cell proliferation and promotes cell apoptosis in vitro. All these data indicated that MEG3 serves as a tumor suppressor in breast cancer.
Epigenetic gene silencing of tumor suppressor genes is associated with promoter CpG island (CGI) hypermethylation, which is considered to be an early event during tumor development [Citation36–38]. Previous studies have shown that aberrant DNA methylation resulted in the proliferation of malignant tumors mainly by silencing of tumor suppressor genes and influencing their associated transcriptional pathways [Citation39]. Mounting evidences reported that MEG3 promoter hypermethylation can lead to MEG3 expression loss in pituitary adenomas, gliomas, cervical cancer and hepatoma [Citation12,Citation20,Citation40,Citation41]. Based on these, we proposed a hypothesis that MEG3 expression loss may be connected with the methylation of promoter region in breast cancer. In this study, we showed that MEG3 was epigenetically methylated in primary breast tissues and cells, and remained unmethylated in normal breast tissues and cells. The reduced MEG3 expression was closely associated with promoter methylation. As we know, treatment with 5-AzadC can lead to genome-wide hypomethylation and thus inhibit cancer cell growth [Citation42], which was expected to be a promising new-generation treatment regime for multiple types of cancer [Citation43]. Additionally, a recent study by Liu et al. [Citation44] showed that 5-AzadC increased MEG3 expression by inhibiting DNA hypermethylation, which suppressed the proliferation, migration, invasion and induced apoptosis in human hepatoma cells. We also affirmed that 5-AzadC incubation can diminish aberrant hypermethylation of MEG3 and inhibit the proliferation and promote apoptosis. These results strongly indicated that hyper-methylation of the MEG3 promoter contributed to the downregulation of MEG3 and supported an epigenetic mechanism of regulation of MEG3 expression in breast cancer.
In mammals, DNA methyltransferases (DNMTs) are enzymes that catalyze the methylation of mammalian genomic [Citation45], including three major DNMTs: DNMT1, DNMT3a and DNMT3b [Citation46]. In epigenetic events, DNMTs are responsible for the transfer of methyl groups from the universal methyl donor s-adenosine-lmethionine to the 5-position of DNA cytosine residues [Citation47]. The increasing data supported that DNMT1 was frequently up-regulated in various human cancers [Citation12,Citation48,Citation49]. For instance, long non-coding RNA-HAGLR suppressed tumor growth of lung adenocarcinoma through recruiting DNMT1 on E2F1 promoter to increase local DNA methylation [Citation50]. Moreover, loss of DNMT1 inhibited the proliferation, migration and invasion of esophageal squamous cell carcinoma cells by suppressing the methylation of tumor suppressor gene promoter RASSF1A and death-related protein kinase [Citation51]. Simultaneously, Kruer et al. [Citation52] revealed that activation of pRb decreased expression of DNMT1, thus increasing MEG3 expression in lung A549 and SK-MES-1 cancer cells. In this study, we confirmed that DNMT1 was up-regulated in breast cancer tissues, and DNMT1 expression was negatively correlated with the MEG3 expression. Knockdown of DNMT1 strongly reversed the methylation of MEG3 promoter and subsequently promoted MEG3 expression, accompanied by inhibiting cells proliferation and accelerating the induction of cells apoptosis. Therefore, our result implied that inhibition of DNMT1 promoted the expression of tumor suppressor MEG3 and influenced the occurrence and development of breast cancer.
Notch signaling is a highly conservative signal regulated many physiological events, including cell fate determination, tissue maturity, tumor progression, and EMT [Citation53]. Recently, Suman et al. [Citation54] found that Notch1 activation or silence was critical for the proliferation, migration, and invasion of breast cancer cells. Moreover, Rui et al. [Citation55] showed that both proliferation and invasion of breast cancer cells can be significantly weakened by reducing the expression of Notch1. Interesting, activation of Notch1 also promoted breast cancer progression by activating the EMT [Citation56]. A research conducted by Zhang et al. [Citation57] suggested that MEG3 inhibits EMT process through sponging miR-421 in breast cancer. In this study, we found that treatment with DNA methylation inhibitor 5-AzadC or sh-DNMT1 alone inhibited the expression of HES1, cyclin D1, N-cadherin, Vimentin and Notch1, whereas increased expression of E-cadherin in breast cancer cells. Of note, shMEG3 combined with 5-AzadC or sh-DNMT1 treatment was able to reverse these proteins levels. It provided sufficient evidence that epigenetic silencing of MEG3 mediated by DNMT1 led to the activation of Notch1 signaling pathway and subsequently regulated the growth of breast cancer cells. Likewise, our study provided noteworthy evidence that the EMT process was closely related to Notch1 signaling in breast cancer cells. Moreover, the in vivo results strongly proved that DNMT1-mediated demethylation of MEG3 inhibited breast cancer tumorigenesis.
In conclusion, our observations imply that MEG3 exerts its tumor suppressor activity by inhibiting cell proliferation and colony formation, inducing apoptosis, and suppressing EMT; this may be partly through DNMT1, which controls demethylation of MEG3 promoter and inhibits Notch1 signaling pathway. Notably, the expression of MEG3 can be restored by epigenetic modification, which implicits that MEG3 is a candidate tumor suppressor gene related to the pathogenesis and progression of human breast cancer.
Supplemental Material
Download Zip (258.2 KB)Acknowledgments
We thank Prof. Tao Zhu for offering MCF-7 and MDA-MB-231 cell lines.
Disclosure statement
No potential conflict of interest was reported by the author(s).
Supplementary material
Supplemental data for this article can be accessed online at https://doi.org/10.1080/15384101.2022.2094662
Additional information
Funding
References
- Siegel RL, Miller KD, Jemal A. Cancer statistics, 2019. CA Cancer J Clin. 2019;69(1):7–34.
- Chen W, Zheng R, Baade PD, et al. Cancer statistics in China, 2015. CA Cancer J Clin. 2016;66(2):115–132.
- Garcia-Martinez L, Zhang Y, Nakata Y, et al. Epigenetic mechanisms in breast cancer therapy and resistance. Nat Commun. 2021;12(1):1786.
- Sun YS, Zhao Z, Yang Z-N, et al. Risk factors and preventions of breast cancer. Int J Biol Sci. 2017;13(11):1387–1397.
- Loibl S, Poortmans P, Morrow M, et al. Breast cancer. Lancet. 2021;397(10286):1750–1769.
- Zhang W, Guan X, Tang J. The long non-coding RNA landscape in triple-negative breast cancer. Cell Prolif. 2021;54(2):e12966.
- Fang Y, Fullwood MJ. Roles, functions, and mechanisms of long non-coding RNAs in cancer. Genomics Proteomics Bioinformatics. 2016;14(1):42–54.
- Cai Q, Wang S, Jin L, et al. Long non-coding RNA GBCDRlnc1 induces chemoresistance of gallbladder cancer cells by activating autophagy. Mol Cancer. 2019;18(1):82.
- Chen Z, Pan T, Jiang D, et al. The lncRNA-GAS5/miR-221-3p/DKK2 axis modulates ABCB1-mediated adriamycin resistance of breast cancer via the Wnt/beta-Catenin signaling pathway. Mol Ther Nucleic Acids. 2020;19:1434–1448.
- Park MK, Zhang L, Min K-W, et al. NEAT1 is essential for metabolic changes that promote breast cancer growth and metastasis. Cell Metab. 2021;33(12):2380–2397 e9.
- Liu S, Sun Y, Hou Y, et al. A novel lncRNA ROPM-mediated lipid metabolism governs breast cancer stem cell properties. J Hematol Oncol. 2021;14(1):178.
- Dong S, Ma M, Li M, et al. LncRNA MEG3 regulates breast cancer proliferation and apoptosis through miR-141-3p/RBMS3 axis. Genomics. 2021;113(4):1689–1704.
- Miyoshi N, Wagatsuma H, Wakana S, et al. Identification of an imprinted gene, Meg3/Gtl2 and its human homologue MEG3, first mapped on mouse distal chromosome 12 and human chromosome 14q. Genes Cells. 2000;5(3):211–220.
- Yan H, Luo B, Wu X, et al. Cisplatin induces pyroptosis via activation of MEG3/NLRP3/caspase-1/GSDMD pathway in triple-negative breast cancer. Int J Biol Sci. 2021;17(10):2606–2621.
- Zhang CY, Yu M-S, Li X, et al. Overexpression of long non-coding RNA MEG3 suppresses breast cancer cell proliferation, invasion, and angiogenesis through AKT pathway. Tumour Biol. 2017;39(6):1010428317701311.
- Zhang Z, Weaver DL, Olsen D, et al. Long non-coding RNA chromogenic in situ hybridisation signal pattern correlation with breast tumour pathology. J Clin Pathol. 2016;69(1):76–81.
- Braconi C, Kogure T, Valeri N, et al. microRNA-29 can regulate expression of the long non-coding RNA gene MEG3 in hepatocellular cancer. Oncogene. 2011;30(47):4750–4756.
- Dong Z, Zhang A, Liu S, et al. Aberrant methylation-mediated silencing of lncRNA MEG3 functions as a ceRNA in esophageal cancer. Mol Cancer Res. 2017;15(7):800–810.
- Hervouet E, Vallette FM, Cartron PF. Impact of the DNA methyltransferases expression on the methylation status of apoptosis-associated genes in glioblastoma multiforme. Cell Death Dis. 2010;1:e8.
- Zhao J, Dahle D, Zhou Y, et al. Hypermethylation of the promoter region is associated with the loss of MEG3 gene expression in human pituitary tumors. J Clin Endocrinol Metab. 2005;90(4):2179–2186.
- Boyanapalli SS, Li W, Fuentes F, et al. Epigenetic reactivation of RASSF1A by phenethyl isothiocyanate (PEITC) and promotion of apoptosis in LNCaP cells. Pharmacol Res. 2016;114:175–184.
- Li J, Bian E-B, HE X-J, et al. Epigenetic repression of long non-coding RNA MEG3 mediated by DNMT1 represses the p53 pathway in gliomas. Int J Oncol. 2016;48(2):723–733.
- Schneider U, Walsh L, Newhauser W. Tumour size can have an impact on the outcomes of epidemiological studies on second cancers after radiotherapy. Radiat Environ Biophys. 2018;57(4):311–319.
- Viale PH. Breast density and breast cancer. J Adv Pract Oncol. 2020;11(1):32–33.
- Walsh SM, Zabor EC, Flynn J, et al. Breast cancer in young black women. Br J Surg. 2020;107(6):677–686.
- Yang B, Gao G, Wang Z, et al. Long non-coding RNA HOTTIP promotes prostate cancer cells proliferation and migration by sponging miR-216a-5p. Biosci Rep. 2018;38:5.
- Bou-Dargham MJ, Draughon S, Cantrell V, et al. Advancements in human breast cancer targeted therapy and immunotherapy. J Cancer. 2021;12(23):6949–6963.
- Wang J, Su Z, Lu S, et al. LncRNA HOXA-AS2 and its molecular mechanisms in human cancer. Clin Chim Acta. 2018;485:229–233.
- Zhao D, Wang S, Chu X, et al. LncRNA HIF2PUT inhibited osteosarcoma stem cells proliferation, migration and invasion by regulating HIF2 expression. Artif Cells Nanomed Biotechnol. 2019;47(1):1342–1348.
- Chen X, Gao J, Yu Y, et al. LncRNA FOXD3-AS1 promotes proliferation, invasion and migration of cutaneous malignant melanoma via regulating miR-325/MAP3K2. Biomed Pharmacother. 2019;120:109438.
- Sun L, Li Y, Yang B. Downregulated long non-coding RNA MEG3 in breast cancer regulates proliferation, migration and invasion by depending on p53ʹs transcriptional activity. Biochem Biophys Res Commun. 2016;478(1):323–329.
- Pan X, Cao Y-M, Liu J-H, et al. MEG3 induces cervical carcinoma cells’ apoptosis through endoplasmic reticulum stress by miR-7-5p/STC1 axis. Cancer Biother Radiopharm. 2021;36(6):501–510.
- Jiao J, Zhang S. Long noncoding RNA MEG3 suppresses gastric carcinoma cell growth, invasion and migration via EMT regulation. Mol Med Rep. 2019;20(3):2685–2693.
- Wu X, Li J, Ren Y, et al. MEG3 can affect the proliferation and migration of colorectal cancer cells through regulating miR-376/PRKD1 axis. Am J Transl Res. 2019;11(9):5740–5751.
- Zhang Y, Wu J, Jing H, et al. Long noncoding RNA MEG3 inhibits breast cancer growth via upregulating endoplasmic reticulum stress and activating NF-kappaB and p53. J Cell Biochem. 2019;120(4):6789–6797.
- Zhou C, Huang C, Wang J, et al. LncRNA MEG3 downregulation mediated by DNMT3b contributes to nickel malignant transformation of human bronchial epithelial cells via modulating PHLPP1 transcription and HIF-1alpha translation. Oncogene. 2017;36(27):3878–3889.
- Zheng H, Yang S, Yang Y, et al. Epigenetically silenced long noncoding-SRHC promotes proliferation of hepatocellular carcinoma. J Cancer Res Clin Oncol. 2015;141(7):1195–1203.
- Brinkman AB, Nik-Zainal S, Simmer F, et al. Partially methylated domains are hypervariable in breast cancer and fuel widespread CpG island hypermethylation. Nat Commun. 2019;10(1):1749.
- Wu FL, Li R-T, Yang M, et al. Gelatinases-stimuli nanoparticles encapsulating 5-fluorouridine and 5-aza-2’-deoxycytidine enhance the sensitivity of gastric cancer cells to chemical therapeutics. Cancer Lett. 2015;363(1):7–16.
- Zhang J, Lin Z, Gao Y, et al. Downregulation of long noncoding RNA MEG3 is associated with poor prognosis and promoter hypermethylation in cervical cancer. J Exp Clin Cancer Res. 2017;36(1):5.
- Liu LX, Deng W, Zhou X-T, et al. The mechanism of adenosine-mediated activation of lncRNA MEG3 and its antitumor effects in human hepatoma cells. Int J Oncol. 2016;48(1):421–429.
- Christman JK. 5-Azacytidine and 5-aza-2’-deoxycytidine as inhibitors of DNA methylation: mechanistic studies and their implications for cancer therapy. Oncogene. 2002;21(35):5483–5495.
- Zong L, Hattori N, Yasukawa Y, et al. LINC00162 confers sensitivity to 5-Aza-2’-deoxycytidine via modulation of an RNA splicing protein, HNRNPH1. Oncogene. 2019;38(26):5281–5293.
- Zuo Y, Lv Y, Qian X, et al. Inhibition of HHIP promoter methylation suppresses human gastric cancer cell proliferation and migration. Cell Physiol Biochem. 2018;45(5):1840–1850.
- Okano M, Bell DW, Haber DA, et al. DNA methyltransferases Dnmt3a and Dnmt3b are essential for de novo methylation and mammalian development. Cell. 1999;99(3):247–257.
- Zhang J, Hawkins LJ, Storey KB. DNA methylation and regulation of DNA methyltransferases in a freeze-tolerant vertebrate. Biochem Cell Biol. 2020;98(2):145–153.
- Trzeciakiewicz A, Habauzit V, Mercier S, et al. Molecular mechanism of hesperetin-7-O-glucuronide, the main circulating metabolite of hesperidin, involved in osteoblast differentiation. J Agric Food Chem. 2010;58(1):668–675.
- Lee E, Wang J, Yumoto K, et al. DNMT1 regulates epithelial-mesenchymal transition and cancer stem cells, which promotes prostate cancer metastasis. Neoplasia. 2016;18(9):553–566.
- Yang JJ, She Q, Yang Y, et al. DNMT1 controls LncRNA H19/ERK signal pathway in hepatic stellate cell activation and fibrosis. Toxicol Lett. 2018;295:325–334.
- Guo X, Chen Z, Zhao L, et al. Long non-coding RNA-HAGLR suppressed tumor growth of lung adenocarcinoma through epigenetically silencing E2F1. Exp Cell Res. 2019;382(1):111461.
- Bai J, Zhang X, Hu K, et al. Silencing DNA methyltransferase 1 (DNMT1) inhibits proliferation, metastasis and invasion in ESCC by suppressing methylation of RASSF1A and DAPK. Oncotarget. 2016;7(28):44129–44141.
- Kruer TL, Dougherty SM, Reynolds L, et al. Expression of the lncRNA maternally expressed gene 3 (MEG3) Contributes to the control of lung cancer cell proliferation by the Rb pathway. PLoS One. 2016;11(11):e0166363.
- Park HJ, Kim S-R, Kim SS, et al. Visfatin promotes cell and tumor growth by upregulating Notch1 in breast cancer. Oncotarget. 2014;5(13):5087–5099.
- Jiang H, Li X, Wang W, et al. Long non-coding RNA SNHG3 promotes breast cancer cell proliferation and metastasis by binding to microRNA-154-3p and activating the notch signaling pathway. BMC Cancer. 2020;20(1):838.
- Rui X, Zhao H, Xiao X, et al. MicroRNA-34a suppresses breast cancer cell proliferation and invasion by targeting Notch1. Exp Ther Med. 2018;16(6):4387–4392.
- Miao K, Lei JH, Valecha MV, et al. NOTCH1 activation compensates BRCA1 deficiency and promotes triple-negative breast cancer formation. Nat Commun. 2020;11(1):3256.
- Zhang W, Shi S, Jiang J, et al. LncRNA MEG3 inhibits cell epithelial-mesenchymal transition by sponging miR-421 targeting E-cadherin in breast cancer. Biomed Pharmacother. 2017;91:312–319.