
ABSTRACT
Colorectal cancer (CRC) is now the third most prevalent tumor and one of the deadliest cancers worldwide, with an increasing prevalence every year. Therefore, we urgently need to understand the mechanisms regulating the progression of colorectal cancer and find potential diagnostic biomarkers. In this study, we performed an analysis using the TCGA and GEO databases to find a molecular biomarker for the diagnosis of CRC, namely CTPS1. The results of this analysis revealed that CTPS1 could promote tumor proliferation and metastasis. Furthermore, bioinformatics analysis revealed that CTPS1 promoted CRC progression through cell cycle and p53 pathways. Further investigation demonstrated that CTPS1 might be involved in the regulation of CCNB1, RRM2, GTSE1, CDK2 and CHEK2 genes. Moreover, PCR confirmed that CTPS1 regulated GTSE1 and CDK2 molecules. Then, western blot was used to verify that CTPS1 promoted the expression of GTSE1 and CDK2 by inhibiting the expression of p53. In summary, we identified an important diagnostic biomarker for CRC, namely CTPS1, and its importance was validated at the cellular level. These results suggest that CTPS1 could serve as a candidate biomarker for CRC and CTPS1 inhibitors may be a potential treatment for CRC.
1. Introduction
Colorectal cancer (CRC) is now the third most common tumor and one of the deadliest cancers in the world, and the prevalence is increasing every year [Citation1]. There has been considerable improvement in surgical techniques with recent advances in medicine, but CRC remains the leading cause of cancer death due to the relatively few late diagnoses and specific drugs available for CRC. The 5-year survival rate for patients diagnosed with stage I or II disease in CRC is approximately 91% and 82%, respectively. Meanwhile the 5-year survival rate for patients diagnosed with stage IV disease is 12%, implying that early CRC diagnosis can greatly improve patient survival [Citation2–4]. Therefore, early diagnosis is the most effective way to improve survival rates. The gold standard for the diagnosis of CRC is colonoscopy, but the patient compliance is poor and the procedure is not without risks. Although several noninvasive screening or diagnostic tests are now frequently used, including the fecal occult blood test (FOBT) and tests for CEA and CA19-9, the sensitivity and specificity of these markers are still poor compared to colonoscopy [Citation5–7]. Therefore, we urgently need to find new diagnostic markers. For example, neutrophil to lymphocyte ratio (NLR) is a newly discovered tumor marker in recent years, which can be easily obtained in clinical work. Increased NLR is an independent predictor of poor prognosis for several malignancies. In cancer patients receiving conventional chemotherapy, targeted therapy, or immune checkpoint inhibitors, reducing NLR predicts better outcomes. These results indicate that it is necessary to discover new tumor markers [Citation8].The use of bioinformatics analysis can provide us with a large amount of data and the ability to delve into data sets from numerous clinical samples from different independent studies. These provide a data base for the discovery of new diagnostic biomarkers
CTP synthase is a restriction nucleotide found in cells, and its synthesis follows two pathways: A remedial pathway for CTP production from nucleic acid degradation-derived cytidine and a de novo pathway dependent on CTPS activity [Citation9]. Cytidine triphosphate synthase (CTPS), a key enzyme in the synthesis of nucleic acid and phospholipid pathways, has increased activity in renal and hepatic cancers and is a promising therapeutic target [Citation10]. Politi et al. have developed antitumor drugs that specifically target human CTPS, whose mechanism of action is to deplete CTP, a raw material required for cancer cell synthesis, thereby inhibiting tumor progression [Citation11]. CTPS is composed of CTPS1 and CTPS2, and their proteins are 80% homologous [Citation12–14]. The CTPS1 gene encodes a protein with a molecular size of 67 kDa including a CTP synthase domain and a glutamine transfer domain, whose main function is to facilitate the formation of CTP from UTP and glutamine [Citation15]. CTPS1 is required for the de novo synthesis of CTP nucleotides [Citation16]. In ovarian cancer, CTPS1 is highly expressed in cancerous tissues compared to normal tissues, and CTPS1 promotes proliferation and metastasis of tumor cells [Citation17]. CTPS1 plays a critical role in tumor progression [Citation18]. Besides, CTPS1 may also affect the progression of pancreatic and breast cancers [Citation19,Citation20]. On the other hand, a study reported that a lack of CTPS1 resulted in reduced proliferation of TCR-CD3-activated T cells and that CD3-activated T cell proliferation was restored by CTPS1 reversion experiments [Citation21]. Martin et al. further demonstrated that CTPS1 could selectively inhibit the proliferation of pathological T cells, including lymphoma [Citation22]. However, the mechanism of CTPS1 in CRC is not reported in the literature.
This study identified a possible diagnostic biomarker, CTPS1, by bioinformatics analysis. The possible mechanisms by which CTPS1 promoted tumor progression were analyzed by GO and KEGG enrichment. Subsequently, we verified whether interfering with CTPS1 inhibited the biological behavior of CRC cells. Co-expression analysis revealed that CTPS1 might be involved in the regulation of CCNB1, RRM2, GTSE1, CDK2 and CHEK2 genes, and PCR verified that CTPS1 regulates GTSE1 and CDK2 molecules. Finally, we verified by western blot that CTPS1 promoted the expression of GTSE1 and CDK2 by suppressing the expression of p53.
2. Method
2.1. Data source
566 CRC samples and 19 normal colorectal samples were collected with raw statistics from the GEO database (https://www.ncbi.nlm.nih.gov/gds), and the remaining 473 CRC samples and 41 normal colorectal samples collected with raw statistics from the TCGA database (https://www.cancer.gov/about-nci/organization/ccg/research/structural-genomics/tcga). From the collected data, we normalized the RNA expression profiles using the “DESeq2” software package in the R software and transformed the profiles stably considering the differences between each one of them. Our data study was performed in accordance with the TCGA and GEO guidelines for publication and acquisition policy.
2.2. Screening for differential genes
In this study, we used the DESeq2 package in R software to identify differentially expressed genes in the GSE39582 database for CRC, where the controls were normal samples and the experimental group were CRC samples (P < 0.05 and |log2FC|>1), and we obtained 1460 differentially expressed genes. We found 665 up-regulated genes among the differential genes, and 48 genes were associated with metabolism. Then, we found a diagnostic gene marker known as CTPS1 that has not been studied in colorectal cancer. Finally, we discovered 342 genes positively associated with CTPS1 using co-expression analysis (P < 0.01, |Cor| > 0.3). Volcano maps and heat maps were generated using the “ggplot2“ and ”pheatmap” packages of R software, respectively.
2.3. Biofunctional enrichment analysis
We preferentially selected differentially expressed genes in CRC and then assessed co-expression with CTPS1 genes using the Pearson correlation test. Finally, genes associated with CTPS1 co-expression were subjected to GO and KEGG enrichment analysis (P < 0.01, |Cor| > 0.3). To reveal the functional j mechanism of CTPS1 regulation of CRC, we performed GO and KEGG pathway enrichment analysis using the R software. adj. p < 0.05 was considered statistically significant. Additionally, we constructed CTPS1 high and low expression groups and performed a gene set enrichment analysis (GSEA) to validate further the mechanisms involved in the regulation of CRC by CTPS1 (http://software.broadinstitute.org/gsea/).
2.4. Cell lines and siRNA transfection
Human CRC cell lines (SW480, RKO and HCT116) and the normal colorectal cell line FHC were obtained from the Institute of the College of Pharmacy, Lanzhou University, respectively, and cells were cultured in DMEM (Gibco, Grand Island, NY, USA) containing 10% fetal bovine serum. CTPS1 shRNA (shCTPS1), p53 shRNA (shP53) and negative control (NC) shRNA oligonucleotides were designed by Gene Pharma (Shanghai, China). When cells reached 30%-50% confluence, the interferometer was transfected in OptiMEM medium using Lipofectamine 2000 (Life Technologies), following the merchant instructions.
2.5. Quantitative real-time polymerase chain reaction
CRC cells successfully transfected with the shCTPS1 vector were lysed at 4°C for 30 min. Cell concentration was calculated using Nanodrop 2000 (Thermo Fisher Scientific). Total RNA was obtained from cells by extracting with TransZol UP reagent (Transgene, Strasbourg, France) and reverse transcription was performed using the Revert Aid First Strand cDNA Synthesis Kit (Servicebio). Primers were shown as follows: CCNB1 (Forward): 5’-GCCTATTTTGGTTGATACTGCCTC-3’, CCNB1 (Reverse): 5’-CTCCATCTTCTGCATCCACATC-3’. RRM2 (Forward): 5’-ACTTGGTGGAGCGATTTAGCC-3’, RRM2 (Reverse): 5’-CCATAGGTAGCCTCTTTGTCCC-3’. GTSE1 (Forward): 5’-ACGTCAGTTGGCAGGGTCAC-3’, GTSE1 (Reerse): 5’-TCCCTTGTTGGTTCAGTTCTCAT-3’. CDK2 (Forward): 5’-CCTGATTACAAGCCAAGTTCCC-3’, CDK2 (Reverse):5’-CCTGGAAGAAAGGGTGAGCC-3’. CHEK1 (Forward): 5’-GATGTTTGGTCCTGTGGAATAGTA-3’, CHEK1 (Reverse): 5’-CCAAGGGTTGAGGTATGTTTT-3’. CHEK1 (Forwar-d): 5’-GATGTTTGGTCCTGTGGAATAGTA-3’, CHEK1 (Reverse): 5’-TCCAAGGGTTGAGGTATGTTTT-3’. CHEK1 (Reverse): 5’-TCCAAGGGTTGAGGTATGTTTT-3, β-actin(F-orward): 5’-CACCCAGCACAATGAAGATCAAGAT-3’, β-actin (Reverse): 5’-CCAGTTTTTAAATCCTGAGTCAAGC-3’. A PCR was conducted with Fast Start Universal SYBR Green Master Mix (Roche, Basel, Switzerland) and the CFX96 Real-Time System (Applied Biosystems, Life Technologies, Foster City, CA), based on the instructions to measure fluorescence. Data were analyzed using the 2− ΔΔCt method, and β-actin was considered as an internal control.
2.6. Western blotting
Cells successfully transfected with the interfering vector were lysed at 4°C for 30 min. Cell concentration was detected using the BCA protein assay kit (Beyotime Biotechnology Institute, Shanghai, China). Proteins were separated by SDS-PAGE, transferred to polyvinylidene fluoride membranes, and then sealed with skim milk in Tween triple-buffered saline for 2 hours. Appropriate dilutions of primary antibodies, including anti-human β-actin (1:2000; Invitrogen, USA), anti-human p53 (1:1000; Cell Signaling Technology, Danvers, MA, USA), and anti-human CTPS1 (1:1000; affinity), were then incubated with the membranes at 4°C in a refrigerator overnight. Secondary antibodies were diluted with TBST and incubated at room temperature for 1 h. According to the manufacturer’s instructions, immunoreactivity was determined using a chemiluminescent western blot immunoassay kit (Invitrogen). The amount of each protein was semi-quantified and β-actin served as an internal control.
2.7. Transwell assay and cell proliferation assay
Cell migration was performed using a 24-well Transwell chamber and 8 μm polycarbonate membrane. Each well above the chambers was inoculated with 2 × 10⁵ cells and serum-free DMEM medium was added, and 10% fetal bovine serum was added below the chambers. The cells were incubated for 48 hours, fixed in paraformaldehyde and stained with crystal violet. The cells in the lower chamber were counted by five randomized zones. There were three replicates for each experiment. According to the instructions (Servicebio), we determined the number of CRC cells using the Cell Counting Kit-8 (CCK-8). Where 96-well plates were inoculated with 2 × 10³ cells/well, 10 µl CCK-8 and 90 µl serum-free medium reagent were mixed and added to each well, incubated at 37°C for 1 h, and OD values were measured at 12 h, 24 h, 36 h and 48 h at 450 nm and 600 nm. Colony formation assay was conducted as follows: 1 × 10³ cells/well were inoculated in a 6-well plate for 14 d, then fixed with methanol and stained with crystal violet liquid after 20 minutes.
2.8. Data analysis
We used R version 3.5.1 software, IBM SPSS 23 and GraphPad Prism 6.01 to analyze our data. Additionally, p-values < 0.05 were considered statistically significant differences.
3. Result
3.1. Critical gene identification for CRC diagnosis
A series of 585 samples (19 normal samples, 566 CRC samples) were gathered from the GSE39582 database. We acquired 1460 differential genes based on this criterion (P < 0.05 and |log2FC| > 1) and the results were displayed in .
Figure 1. Identification of up-regulated metabolism-related genes in CRC. (a) Volcano plots of GSE39582 gene expression profile. Based on this criterion (adjusted P-value < 0.05 and |log2FC| > 1), the green and red dots indicate down- and up-regulated genes in volcano plots, respectively. (b) In 41 normal tissues and 473 CRC samples, expression matrices of 48 upregulated metabolism-related genes were then clustered in unsupervised hierarchy in the TCGA database. Green and red indicated lower and higher expression levels between genes, respectively.
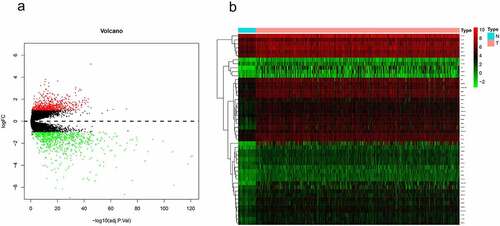
Compared to normal tissue, 665 of the differential genes were upregulated genes, and further analysis of the upregulated genes identified 48 genes associated with metabolism (Supplemetary Table 1). The results in the TCGA database also confirmed that these 48 genes presented a high expression in CRC samples compared to normal tissue (41 normal samples, 473 CRC samples) ().
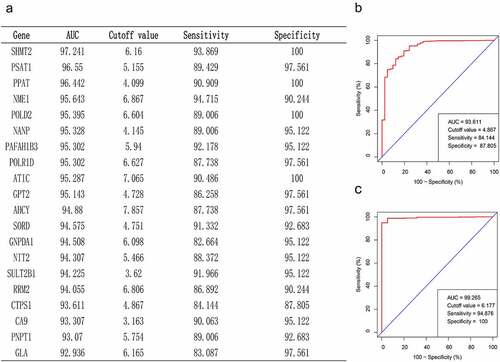
To find the key genes for CRC diagnosis, we performed a ROC curve analysis and compared AUC values to evaluate the sensitivity and specificity of the above 48 genes for CRC diagnosis in the TCGA database. Based on the AUC values, we screened the top 20 genes, which have high diagnostic significance for CRC (). We noticed a gene seldom reported in the table from earlier studies on CRC and other cancers, namely CTPS1. As displayed in , the ROC curve results in the TCGA database revealed that the AUC value of CTPS1 was 93.61, the prediction accuracy was 84.14%, and the specificity was 87.81%. To further verify the diagnostic significance of CTPS1 for CRC, we performed a ROC curve analysis on the GSE39582 database, and the results depicted that the AUC value of CTPS1 was 99.27, with a prediction accuracy of 94.88%, and the specificity was 100% (). ROC curves from the TCGA database and the GSE39582 dataset indicate that CTPS1 has a good sensitivity and specificity for the diagnosis of CRC.
Figure 2. Critical gene identification for CRC diagnosis. (a) In the TCGA database, we filtered out the top 20 genes based on their AUC values. (b, c) Sensitivity and specificity of CTPS1 as a diagnostic biomarker for CRC assessed by ROC curves in TCGA database and GSE39582 dataset, respectively.
3.2. The mechanism of CTPS1 in CRC
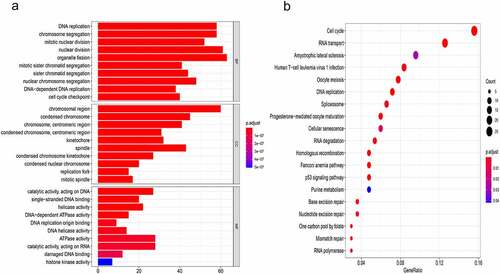
To further explore the mechanisms associated with CTPS1 in HCC, we screened a total of 342 genes positively associated with CTPS1 for GO and KEGG pathway enrichment analysis (Pearson correlation coefficient > 0.30) (Supplemetary Table 2). GO analysis revealed that co-expressed genes were enriched in the ”DNA replication, ”chromosomal region” and ”catalytic activity, acting on DNA” (). KEGG enrichment analysis also demonstrated that these co-expressed genes are actively involved in the cell cycle (). More significantly, we discovered that these genes are associated with the p53 pathway in . These results indicated that CTPS1 could promote CRC progression through the cell cycle and p53 pathways.
Figure 3. The mechanism of CTPS1 in CRC. (a) GO enrichment analysis. MF, CC and BP terms were used for the molecular function, cellular components and biological processes. The y-axis reflected the number of significant enrichment pathways. x-axis reflected the number of genes, and different colors reflected different P values. (b) KEGG pathway enrichment analysis. y-axis and x-axis reflect significant enrichment pathways and enrichment abundance, respectively. The color and size of the spots reflect the various P values and the number of target genes enriched in the relevant pathways, respectively.
3.3. CTPS1 promotes the proliferation and metastasis of CRC cells
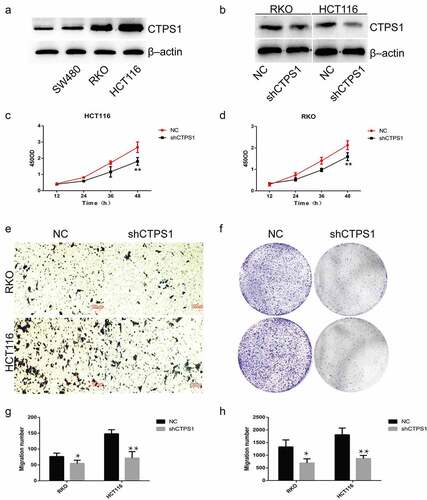
To verify the effect of CTPS1 on CRC cell progression, we performed in vitro experiments. Compared with normal colon cell lines, we found that CTPS1 showed high expression in CRC cells (). We selected cell lines with high expression of CTPS1 in CRC cells for further experiments, and verified the interference efficiency by western blot assay (). Cell activity assay showed that the viability of RKO and HCT116 cells in the negative control group (NC) was significantly higher than that in the silent group (shCTPS1) (). Compared with the NC group, transwell analysis revealed that cell metastasis was significantly suppressed in the shCTPS1 group (). Colony formation analysis indicated that the proliferation of cells in the shCTPS1 group was significantly suppressed (). Furthermore, the histograms pointed out the number of cells in the transwell analysis and colony formation analysis, respectively (). All these results indicated that interference with CTPS1 inhibited the progression of CRC cells.
Figure 4. CTPS1 promotes the proliferation and metastasis of CRC cells. (a) CTPS1 expression was higher in SW480, RKO and HCT116 cells than in normal FHC cell line. (b) The levels of CTPS1 protein in CRC cells transfected with CTPS1 shRNA. (c, d) CCK-8 assay showed that the viability of RKO and HCT116 cells in the NC group was significantly higher than that in the shCTPS1 group. (e) Transwell assay revealed that cell metastasis was significantly suppressed in the shCTPS1 group. (f) Colony formation analysis were made to test the cell proliferation of RKO and HCT116 cells. (g, h) Quantitative analysis of transwell experiments and Colony formation experiments, respectively. (*p < 0.05, **p < 0.01).
3.4. CTPS1 promoted the progression of CRC cells through the p53 pathway
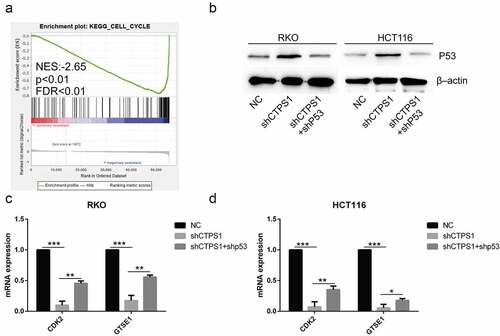
To further investigate the mechanisms associated with CTPS1, we analyzed its signaling pathway using GSEA. Our analysis revealed that CTPS1 was associated with the p53 pathway, which was similar to the outcomes of the above analysis by KEGG (). We then used the TCGA database to forecast important molecules of the p53 pathway and noticed that CTPS1 might be involved in regulating the expression of cell cycle-related CCNB1, RRM2, GTSE1, CDK2 and CHEK2 genes (cor>0.5, p < 0.01) (). To verify the relationship between CTPS1 and the predicted five molecules, we used western blot experiments to confirm that the expression of GTSE1, CDK2 were suppressed in the shCTPS1 group (). There were no differences in CCNB1, RRM2 and CHEK2 gene expressions. Finally, based on the above results, we speculated that CTPS1 might be involved in cell cycle regulation through p53. Moreover, we found that CTPS1 was involved in the regulation of cell cycle via GSEA enrichment analysis, which was consistent with our conjecture (). Western blotting confirmed that the shCTPS1 group promoted the expression of the p53 gene compared with the NC group, and further interference with p53 in the shCTPS1 group (shCTPS1+ shP53) enhanced the inhibitory effect of shCTPS1 on p53. (). The RT-PCR results showed that the expression levels of GTSE1 and CDK2 were inhibited in the shCTPS1 group compared with the NC group, and further interference with p53 in the shCTPS1 group attenuated the inhibitory effect of shCTPS1 on GTSE1 and CDK2 genes (). These results suggest that CTPS1 promotes the expression of GTSE1 and CDK2 by inhibiting p53.
Figure 5. CTPS1 promoted the progression of CRC cells through the p53 pathway. (a) GSEA indicated that CTPS1 was associated with the p53 signaling pathway. X-axis was each gene sorted and Y-axis was the corresponding enrichment score. There was a crest in the graph and the crest was the enrichment score. NES stood for normalized ES and FDR q-value stood for p-value adjusted by multiple assumption testing. (b-f) Co-expression assay forecasts the correlation coefficients of CTPS1 with cell cycle molecules CCNB1, RRM2, GTSE1, CDK2 and CHEK2 (cor>0.5). (g, h) The RT-PCR assay showed that the shCTPS1 group inhibited the expression of GTSE1 and CDK2 compared with the NC group. (*p < 0.05, **p < 0.01,**p<0.001).
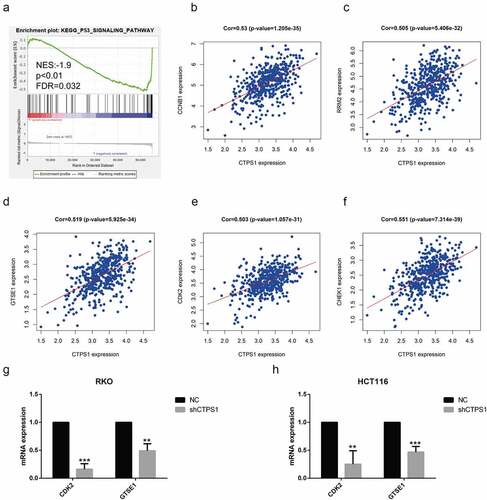
Figure 6. Related mechanisms of CTPS1. (a) GSEA enrichment analysis found that CTPS1 was involved in the regulation of cell cycle. The legend was described as . (b) Western blot assay showed that the shCTPS1 group promoted the expression of p53 protein, while shCTPS1+ shP53 group decreased the expression of p53 compared with the shCTPS1 group. (c) The RT-PCR assay showed that the shCTPS1 group inhibited the expression of GTSE1 and CDK2, and shCTPS1+ shP53 group attenuated the inhibitory effect of shCTPS1 group on GTSE1 and CDK2. (*p < 0.05, **p < 0.01, *** p < 0.001)。.
4. Discussion
Exploring the mechanisms related to CRC progression and finding therapeutic targets for tumors plays an important role in the treatment of tumors. CRC is a highly heterogeneous clinical disease. Among several major genetic mutations in CRC, the RAS mutational status has been recognized as an important biomarker able to predict response to anti-EGFR antibodies. It has also been reported that RAS mutation is correlated with the oncological aggressiveness of CRC, the site-specific risk of recurrence, and the pathologic response to chemotherapy. Furthermore, miRNAs have been shown to have roles as tumor suppressor genes and oncogenes, and their diagnostic, prognostic, and predictive implications are now being explored [Citation23]. CTPS1 is a metabolic enzyme involved in the synthesis of UTP, ATP and CTP of glutamine, which is an essential step in DNA and RNA synthesis during cell proliferation and plays an important role in tumor progression [Citation24,Citation25]. Combined inhibition of CTPS1 and Rad3-related protein (ATR) is synthetically lethal in MYC-overexpressing cancer cells [Citation26]. The results of the triple negative breast cancer study revealed that silencing of CTPS1 significantly inhibited proliferation, migration, invasion and promoted apoptosis of breast cancer cells. Further mechanistic studies revealed that YBX1 could bind to the CTPS1 promoter to promote its transcription [Citation27]. In this study, we used the TCGA and GEO databases to find a molecular marker for the diagnosis of CRC, namely CTPS1, and the analysis suggested that CTPS1 could promote tumor proliferation and metastasis. Additionally, bioinformatics analysis showed that CTPS1 promoted CRC progression through the cell cycle and p53 pathways. We used RT-PCR and western blot to verify whether CTPS1 promoted the expression of cell cycle molecules GTSE1 and CDK2 by inhibiting p53. These results suggested that inhibition of CTPS1 may be a novel approach for CRC prevention and treatment.
In this study, we identified a potential therapeutic target with diagnostic value. We identified a total of 665 genes with upregulated expression in CRC samples from GSE39582, including 48 genes related to metabolism. This was further confirmed in TCGA data. We used ROC curve analysis and comparison of AUC values to assess the sensitivity and specificity of the top 20 genes mentioned above for the diagnosis of CRC in the TCGA database, and we noted that one gene, CTPS1, was rarely reported. GO and KEGG enrichment analysis of CTPS1 co-expressed genes revealed that CTPS1 was associated with cell cycle and p53 pathways. Our team conducted cellular-level studies and found that CTPS1 was highly expressed in tumor cells compared to normal colon cells and that interference with CTPS1 inhibited the proliferation and metastasis of CRC cells. These results suggested that CTPS1 may be a potential target for the treatment of CRC.
To further investigate the mechanism by which CTPS1 promotes CRC cell progression, we performed a GSEA enrichment analysis and found that CTPS1 promotes CRC progression through the cell cycle and p53 pathways. These results are consistent with the enrichment results of GO and KEGG enrichment analysis. We experimentally verified that CTPS1 was associated with cell cycle-related molecules GTSE1 and CDK2, and that this regulatory mechanism was achieved through inhibition of p53. CTPS1 has specifically expressed in the G2 and S phases of the cell cycle [Citation28,Citation29]. Recent studies have reported that GTSE1 promotes the invasive and migratory ability of hepatocellular carcinoma cells, breast cancer, and colorectal cancer, and that GTSE1 confers cisplatin resistance to gastric cancer cells [Citation30,Citation31,Citation32]. In the G1 to S phase transition, CDK2 binds to cyclin E. During the S phase, the cyclin A/CDK2 complex regulates the cell cycle [Citation33,Citation34]. Additionally, CDK2 is also involved in protein degradation, signal transduction, and DNA and RNA metabolism pathways. Moreover, there is new evidence that CDK2 inhibition triggers antitumor activity in a well-defined genetic subset of tumors [Citation35]. Being a tumor suppressor, p53 is a hallmark of almost all tumors through direct mutation or aberration in one of its many regulatory pathways [Citation36]. Recent studies have also shown that deletion or mutation of p53 in tumors affects the recruitment and activity of bone marrow and T cells, leading to immune evasion and facilitating the proliferation and metastasis of tumor cells [Citation37]. These results suggest that CTPS1 is closely associated with tumor progression, partly explaining the mechanism regulating CRC cell progression and providing further therapeutic ideas for studying CRC
Although our study has confirmed that CTPS1 plays an important role in the progression of CRC, the limitations of the experiment should be recognized. First, our data were validated in the TCGA and GEO databases, but a larger sample size is still needed, and we did not further confirm this result in a clinical sample. Furthermore, we verified that CTPS1 promotes the expression of cell cycle molecules such as GTSE1 and CDK2 through the p53 pathway. However, the specific mechanism of action between CTPS1 and p53 has not been further investigated. In summary, the sample size analyzed in our study was limited, so a larger sample should be collected to verify these conclusions. Furthermore, we lacked the basic experimental data and clinical trials required for further validation.
Overall, this study reports an important diagnostic biomarker for CRC, namely CTPS1. In this article, we also describe the underlying mechanism associated with CTPS1 using bioinformatic analysis, which we validated at the cellular level. These results suggest that CTPS1 may be a potential target for the treatment of CRC. Thus, our study may provide a new approach to the treatment of CRC.
Declarations
Ethics approval and consent to participate
Not applicable.
Consent for publication
Not applicable.
Availability of data and materials
The datasets generated during and/or analyzed during the current study are available in the [TCGA, GEO] repository.
Authors’ contributions
FH Wu and YD Mao analyzed and interpreted the data, and were major contributor in writing the manuscript. T Ma, XL Wang, HZ Wei, TW Wang and J Wang provided technical support. YC Zhang, who provided ideas and financial support, was our corresponding author. All authors read and approved the final manuscript.
Supplemental Material
Download Zip (77.1 KB)Disclosure statement
No potential conflict of interest was reported by the author(s).
Supplemental data
Supplemental data for this article can be accessed online at https://doi.org/10.1080/15384101.2022.2105084
Additional information
Funding
References
- Bray F, Ferlay J, Soerjomataram I, et al. Global cancer statistics 2018: GLOBOCAN estimates of incidence and mortality worldwide for 36 cancers in 185 countries. Cancer J Clin. 2018;68(6):394–424.
- Lin JS, Piper MA, Perdue LA, et al. Screening for Colorectal Cancer: updated Evidence Report and Systematic Review for the US Preventive Services Task Force. Jama. 2016;315(23):2576–2594.
- Miller KD, Nogueira L, Mariotto AB, et al. Cancer treatment and survivorship statistics, 2019. Cancer J Clin. 2019;69(5):363–385.
- Schreuders EH, Ruco A, Rabeneck L, et al. Colorectal cancer screening: a global overview of existing programmes. Gut. 2015;64(10):1637–1649.
- Fung KY, Nice E, Priebe I, et al. Colorectal cancer biomarkers: to be or not to be? Cautionary tales from a road well travelled. World J Gastroenterol. 2014;20(4):888–898.
- Liu L, He Q, Li Y, et al. Serum SYPL1 is a promising diagnostic biomarker for colorectal cancer. Clin Chim Acta. 2020;509:36–42.
- Werner S, Krause F, Rolny V, et al. Evaluation of a 5-Marker Blood Test for Colorectal Cancer Early Detection in a Colorectal Cancer Screening Setting. Clin Cancer Res. 2016;22(7):1725–1733.
- Moschetta M, Uccello M, Kasenda B, et al. Dynamics of Neutrophils-to-Lymphocyte Ratio Predict Outcomes of PD-1/PD-L1 Blockade. Biomed Res Int. 2017;2017:1506824.
- Traut TW. Physiological concentrations of purines and pyrimidines. Mol Cell Biochem. 1994;140(1):1–22.
- Williams JC, Kizaki H, Weber G, et al. Increased CTP synthetase activity in cancer cells. Nature. 1978;271(5640):71–73.
- Politi PM, Xie F, Dahut W, et al. Phase I clinical trial of continuous infusion cyclopentenyl cytosine. Cancer Chemother Pharmacol. 1995;36(6):513–523.
- Kassel KM, Higgins R, Hines MJ, et al. Regulation of human cytidine triphosphate synthetase 2 by phosphorylation. J Biol Chem. 2010;285(44):33727–33736.
- van Kuilenburg AB, Meinsma R, Vreken P, et al. Isoforms of human CTP synthetase. Adv Exp Med Biol. 2000;486:257–261.
- van Kuilenburg AB, Meinsma R, Vreken P, et al. Identification of a cDNA encoding an isoform of human CTP synthetase. Biochim Biophys Acta. 2000;1492(2–3):548–552.
- Kursula P, Flodin S, Ehn M, et al. Structure of the synthetase domain of human CTP synthetase, a target for anticancer therapy. Acta Crystallogr. 2006;62(Pt 7):613–617.
- Winter S, Martin E, Boutboul D, et al. Loss of RASGRP1 in humans impairs T-cell expansion leading to Epstein-Barr virus susceptibility. EMBO Mol Med. 2018;10(2):188–199.
- Qu H, Chen Y, Cao G, et al. Identification and validation of differentially expressed proteins in epithelial ovarian cancers using quantitative proteomics. Oncotarget. 2016;7(50):83187–83199.
- Kursunel MA, Esendagli G. The untold story of IFN-γ in cancer biology. Cytokine Growth Factor Rev. 2016;31:73–81.
- Cao W, Jiang Y, Ji X, et al. Identification of novel prognostic genes of triple-negative breast cancer using meta-analysis and weighted gene co-expressed network analysis. Ann Transl Med. 2021;9(3):205.
- Ohmine K, Kawaguchi K, Ohtsuki S, et al. Quantitative Targeted Proteomics of Pancreatic Cancer: deoxycytidine Kinase Protein Level Correlates to Progression-Free Survival of Patients Receiving Gemcitabine Treatment. Mol Pharm. 2015;12(9):3282–3291.
- Martin E, Palmic N, Sanquer S, et al. CTP synthase 1 deficiency in humans reveals its central role in lymphocyte proliferation. Nature. 2014;510(7504):288–292.
- Martin E, Minet N, Boschat AC, et al. Impaired lymphocyte function and differentiation in CTPS1-deficient patients result from a hypomorphic homozygous mutation. JCI Insight. 2020;5(5). DOI:10.1172/jci.insight.133880
- Boussios S, Ozturk MA, Moschetta M, et al. The Developing Story of Predictive Biomarkers in Colorectal Cancer. J Pers Med. 2019;9:1.
- Long CW, Levitzki A, Koshland DE Jr. The subunit structure and subunit interactions of cytidine triphosphate synthetase. J Biol Chem. 1970;245(1):80–87.
- Ostrander DB, O’Brien DJ, Gorman JA, et al. Effect of CTP synthetase regulation by CTP on phospholipid synthesis in Saccharomyces cerevisiae. J Biol Chem. 1998;273(30):18992–19001.
- Sun Z, Zhang Z, Wang QQ, et al. Combined Inactivation of CTPS1 and ATR Is Synthetically Lethal to MYC-Overexpressing Cancer Cells. Cancer Res. 2022;82(6):1013–1024.
- Lin Y, Zhang J, Li Y, et al. CTPS1 promotes malignant progression of triple-negative breast cancer with transcriptional activation by YBX1. J Transl Med. 2022;20(1):17.
- Bublik DR, Scolz M, Triolo G, et al. Human GTSE-1 regulates p21(CIP1/WAF1) stability conferring resistance to paclitaxel treatment. J Biol Chem. 2010;285(8):5274–5281.
- Utrera R, Collavin L, Lazarević D, et al. A novel p53-inducible gene coding for a microtubule-localized protein with G2-phase-specific expression. EMBO J. 1998;17(17):5015–5025.
- Lin F, Xie YJ, Zhang XK, et al. GTSE1 is involved in breast cancer progression in p53 mutation-dependent manner. J Exp Clin Cancer Res. 2019;38(1):152.
- Subhash VV, Tan SH, Tan WL, et al. GTSE1 expression represses apoptotic signaling and confers cisplatin resistance in gastric cancer cells. BMC Cancer. 2015;15:550.
- Wu X, Wang H, Lian Y, et al. GTSE1 promotes cell migration and invasion by regulating EMT in hepatocellular carcinoma and is associated with poor prognosis. Sci Rep. 2017;7(1):5129.
- Dulić V, Lees E, Reed SI. Association of human cyclin E with a periodic G1-S phase protein kinase. Science. 1992;257(5078):1958–1961.
- Ohtsubo M, Theodoras AM, Schumacher J, et al. Human cyclin E, a nuclear protein essential for the G1-to-S phase transition. Mol Cell Biol. 1995;15(5):2612–2624.
- Tadesse S, Anshabo AT, Portman N, et al. Targeting CDK2 in cancer: challenges and opportunities for therapy. Drug Discov Today. 2020;25(2):406–413.
- Joerger AC, Fersht AR. The p53 Pathway: origins, Inactivation in Cancer, and Emerging Therapeutic Approaches. Annu Rev Biochem. 2016;85(1):375–404.
- Blagih J, Buck MD, Vousden K. H., p53, cancer and the immune response. J Cell Sci. 2020;133(5). DOI:10.1242/jcs.237453