
ABSTRACT
Hepatocellular carcinoma (HCC) is one of the most common cancers and has continued to increase in incidence worldwide. Moreover, the involvement of microRNAs (miRs) has been reported in the development and progression of HCC. Here, we investigated the role of miR-206 in HCC growth and metastasis. HCC-related microarray datasets were harvested to screen differentially expressed miRNAs in HCC samples followed by prediction of downstream target genes. The dual-luciferase reporter assay verified the target-binding relationship between miR-206 and CREB5. The human HCC cell line MHCC97-H was cultured in vitro and transfected with miR-206 mimic/inhibitor or sh-/oe-CREB5 for analyzing MHCC97-H cell biological functions. The orthotopic xenograft model of HCC mice was constructed to observe the tumorigenic ability of HCC cells in vivo. Bioinformatics analysis found that miR-206 may be involved in HCC growth and metastasis by targeting CREB5 and regulating PI3K/AKT signaling pathway. In vivo animal experiments found that CREB5 was significantly overexpressed in mouse HCC tissues. In HCC cells, miR-206 can target down-regulate the expression of CREB5, thereby inhibiting the activation of PI3K/AKT signaling pathway. Furthermore, in vitro cell experiments confirmed that overexpression of miR-206 could inhibit the PI3K/AKT signaling pathway by down-regulating CREB5 expression, thereby inhibiting the proliferation, migration and invasion of HCC cells. In conclusion, our results revealed that miR-206 could down-regulate the expression of CREB5 and inhibit the activation of PI3K/AKT signaling pathway, thereby preventing HCC growth and metastasis.
Abbreviations: HCC: hepatocellular carcinoma; HBV or HCV: hepatitis B or C virus; miRNAs: microRNAs; CREB: cAMP response element-binding protein; CRE: cAMP response elements
1. Introduction
Hepatocellular carcinoma (HCC) is the sixth most common cancer and the fourth most common cause of cancer-related deaths worldwide [Citation1]. HCC is commonly associated with chronic liver disease, such as that associated with hepatitis B or C virus (HBV or HCV) infection, cirrhosis, or alcohol abuse [Citation2]. Liver transplantation or surgical resection can cure HCC patients at an early stage [Citation3]. Approximately 80% of HCC patients are diagnosed at later stages, and systemic treatment is the only option. Unfortunately, traditional chemotherapeutic drugs, such as 5-fluorouracil, oxaliplatin, and gemcitabine, result in a disappointing efficacy in advanced HCC patients [Citation4]. Sorafenib and envatinib in a first-line setting and regorafenib, cabozantinib, and ramucirumab in a second-line setting have become the only effective systemic therapies for advanced-stage HCC. However, the median survival after these treatments is only approximately one year [Citation5]. It is therefore urgent to provide reliable biomarker targets for the treatment of HCC.
microRNAs (miRNAs) are small noncoding RNAs that have emerged as key players in the control of various biological processes and tumor progression [Citation6]. Accumulating evidence shows deregulated expression of miRNAs, such as miR-1, miR-21, miR-25, miR- 92a, miR-133, miR-206, miR-222, miR-223, and miR-375, in HCC [Citation7–10]. Moreover, the downregulation of miR-206 has been documented in multiple cancers, including lung cancer and breast cancer [Citation11]. Importantly, a study conducted by Chang et al. revealed that miR-206 downregulation promoted HCC cell viability and metastasis [Citation12].
cAMP response element-binding protein (CREB) is a cellular transcription factor that binds to CRE, thereby regulating gene expression [Citation13]. CREB5 belongs to the CRE family and has been reported to be overexpressed in many types of cancer, such as ovarian cancer, lung cancer, and HCC, in which this protein orchestrates cell differentiation, proliferation and metastasis [Citation14]. Interestingly, one study showed that CREB5 played a crucial role in the poor prognosis of HCC and increased HCC cell proliferation [Citation14]. The PI3K/AKT signaling pathway is reported to play an important role in regulating the cell cycle and growth [Citation15]. The PI3K/AKT signaling pathway has been demonstrated to be involved in HCC growth and metastasis [Citation16] and resistance to drugs, such as sorafenib [Citation17]. However, studies on the correlation among miR-206, CREB5, and the PI3K/AKT signaling pathway are limited. Therefore, this study was conducted to explore the relationship among miR-206, CREB5, and the PI3K/AKT signaling pathway in HCC and the effects of their relationship on HCC cells.
2. Materials and methods
2.1 Ethics statement
This study was implemented under ratification from the Animal Ethics Committee of Shengjing Hospital of China Medical University. All animal experiments in this study were performed in accordance with the Guide for the Care and Use of Laboratory Animals published by the National Institutes of Health.
2.2 Bioinformatics analysis
The Gene Expression Omnibus (GEO) database was adopted to obtain the HCC expression dataset GSE49515, which was followed by a differential analysis using the R language “limma” package (|logFC| > 2 and p value < 0.05 as the differential gene screening criteria). Heatmaps of the top 30 differentially expressed genes (DEGs) were constructed using the “pheatmap” package. WebGestalt (WEB-based Gene SeT AnaLysis Toolkit) is a web tool for functional enrichment analysis that was applied for gene ontology (GO) functional enrichment analysis of DEGs. The STRING database was employed to analyze the protein interactions of the top 30 DEGs, which was followed by protein interaction network construction using Cytoscape software. The miRNAs that orchestrate CREB5 in mice were predicted by the TargetScan database.
2.3 Generation of a mouse orthotopic HCC model by intrahepatic injection of MHCC97-H cells
Forty specific pathogen-free healthy male BALB/C mice (aged 6–8 weeks and weighing 25 ± 3 g; Beijing Huafukang Biotechnology Co., Ltd., Beijing, China) were used for this experiment. During the experiment, the animals were housed in the Animal Research Center of Shengjing Hospital of China Medical University, with 3 to 4 mice per cage. The mice were fed standard chow with tap water available ad libitum. The temperature of the animal house was controlled at approximately 20°C. Subsequent to 1 week of acclimation, the mice were placed into either the control group or the HCC group by the random number table method (20 mice/group). Mice in the control group did not receive any treatment. After intraperitoneal anesthesia, mice in the HCC group were placed in a supine position and fixed on the experimental board. Fur was removed with 10% sodium sulfide. After iodine disinfection, the livers of the mice to be inoculated were scanned with high-frequency ultrasound to determine the location of the liver as well as the angle, direction and depth of the puncture. MHCC97-H cells were extracted, and the needle was inserted under real-time ultrasound monitoring. The predetermined liver position was penetrated by the needle to a depth of approximately 1 cm. The 0.05 mL cell suspension (approximately 1.0 × 10⁶ MHCC97-H cells) was slowly injected into the liver, followed by injection of 0.02 mL air. The needle was quickly withdrawn to prevent the cell suspension from flowing out along the needle path. Sterile cotton swabs were used for compression to achieve hemostasis, which was followed by routine disinfection of the puncture points. The growth, disposition, appetite, weight and death of the mice were observed. The mice lost weight and exhibited a poor mental state, and some even died. Subsequent to euthanasia of the mice, the liver texture of the mice became hardened, and multiple nodules and highly differentiated cells were observed by microscopy, which indicated that the HCC mouse model was successfully established.
2.4 Tumor growth detection
After injection of MHCC97-H cells under ultrasound guidance, we performed high-frequency ultrasound at 10 d and 20 d to observe whether there was an abnormal echo area at the site of liver inoculation; this was followed by recording the echo type, shape and size of the abnormal mass. All inspection materials were recorded and stored on video tape and magneto-optical discs. A laparotomy was performed immediately after ultrasound examination on the 20th day to determine liver tumor formation and to measure the tumor size.
2.5 Hematoxylin-eosin (HE) staining
Subsequent to successful modeling, the mice were euthanized. The HCC and surrounding liver tissues of the mice were fixed in a 10% formaldehyde solution (p1110-100, Beijing Taizeruida Technology Co., Ltd., Beijing, China) for more than 24 h and made into 5-μm paraffin-embedded sections (partial sections for immunohistochemistry experiments). The sections were subjected to 4 min of hematoxylin (H8070-5 g, Solarbio, Beijing, China) staining and 2 min of eosin (PT001, Bogu, Shanghai, China) staining. Pathological changes in the tissues were observed under a light microscope (Model DMM-300D, Shanghai Caikang Optical Instrument Co., Ltd., Shanghai, China).
2.6 Immunohistochemistry
After fixation in 4% neutral methanol, the liver tissues removed from control and HCC mice were cut into thin strips for dehydration and immersion in paraffin. Next, 4-μm paraffin-embedded sections were prepared and then subjected to antigen retrieval. The sections were incubated with 3% hydrogen peroxide at ambient temperature in the dark for 20 min to block endogenous peroxidase. Then, the sections were blocked with nonimmune serum in a humidified chamber for 30 min before probing with primary anti-rabbit CREB5 polyclonal antibody (1:500, ab168928, Abcam, Cambridge, UK) overnight at 4°C. The sections were incubated with Super Enhancer at ambient temperature for 20 min before reprobing with horseradish peroxidase (HRP)-labeled goat anti-rabbit universal secondary immunoglobulin G (IgG) antibody (1:1000, ab6721, Abcam) for 30 min at ambient temperature. Diaminobenzidine (P0203, Beyotime, Shanghai, China) was used to develop the sections, after which they were counterstained in hematoxylin for 20s. Finally, the sections were mounted with resin. The positive expression rate of CREB5 protein in liver cells of control and HCC mice was detected by the appearance of brown particles in the nucleus. Positive protein expression results were judged according to the following scoring criteria: 5 random high-power microscope fields (× 400) were chosen for each slice with 200 cells counted per field. The staining intensity was scored as follows: 1 point for light yellow, 2 points for tan, and 3 points for chocolate-brown staining. According to the percentage of positive cells (positive tumor cells/all tumor cells), 0% was 0 points, > 0% – 50% was 1 point, > 50% – 75% was 2 points, and > 75% was 3 points. The sum of the scores of the percentage of positive cells and staining intensity comprised the final expression score: tissues with < 4 points were negative, while tissues with ≥ 4 points were positive. Immunohistochemical results were scored independently by two individuals in a double-blinded manner.
2.7 Cell transfection
The human HCC cell line MHCC97-H (ZB001, Biozb, CN, Shanghai ZHIBEI Biotechnology Co., Ltd., Shanghai, China) was cultured in Roswell Park Memorial Institute (RPMI)-1640 (Gibco, Carlsbad, California, USA) medium containing 10% fetal bovine serum and 1% mycillin at 37°C with 5% CO2. Then, at 80% confluence, cells were trypsinized (HyClone, Logan, Utah, USA) for subculture. Logarithmically growing MHCC97-H cells were assigned to 6 groups and seeded into a six-well plate 24 h before transfection. When the cell confluence reached approximately 50%, cells were seeded into a 25-cm2 culture flask and grown to a density of 30–50% in complete medium. Transfection was performed according to the Lipofectamine 2000 manual (Invitrogen, Carlsbad, CA, USA). The cells that were not transfected with any sequence served as a blank control (blank group); other cells were treated with 3 μL miR-206 mimic (10 μmol/L), 3 μL miR-206 inhibitor (10 μmol/L), 3 μL sense sequence (10 μmol/L, negative control [NC]), 2.5 mL Wortmannin (25 ng/mL, PI3K/AKT signaling pathway inhibitor), miR-206 inhibitor + 3 μL of 10 μmol/L short hairpin RNA (sh)-CREB5, or miR-206 inhibitor + Wortmannin. The final concentration was 1 μmmol/L. The miR-206 mimic, miR-206 inhibitor, sh-CREB5, and sense sequence were purchased from GenePharma (Shanghai, China), and Wortmannin was purchased from Merck-Calbiochem (West Point, Philadelphia, PA, USA). After a 6-h transfection, the medium was exchanged. Following 48 h of culture, the cells were used in the experiments described below.
2.8 3-(4,5-Dimethylthiazol-2-yl)-2,5-diphenyltetrazolium bromide (MTT) assay
After transfection, the cell suspension (100 μL) was added to a 96-well plate at a density of 2,000 cells/well. Serum-free medium was added to the cells after 48 h of culture at 37°C with 5% CO2. Then, 20 μL of 5 mg/mL MTT (Sigma, St Louis, MO, USA) was added to each well after 0, 24, 48, and 72 h of culture at 37°C with 5% CO2. After a further 4-h culture, the supernatant was removed. Then, 100 μL dimethyl sulfoxide was added to each well. The absorbance at 490 nm was measured with an automated microplate reader (Multiskan FC, Thermo Fisher Scientific, Waltham, Massachusetts, USA). Ten parallel wells were established for each group to calculate the mean value. Experiments were performed in triplicate.
2.9 Scratch test
After transfection, the cells were seeded at a density of 200,000 cells/well into a six-well plate and incubated until they reached 80% to 90% confluence. Subsequently, a scratch was gently made with a 200 µL pipette tip. The plate was washed in phosphate-buffered saline to remove floating cells. Cells were further cultured in serum-free RPMI-1640 medium (Nanjing Ampere Chemical Technology Co., Ltd. Nanjing, China) for 0.5–1 h to allow the cells to recover. After the cells recovered, images were acquired using an inverted microscope at 0 h and 24 h, followed by measurement of cell migration distance using Image-Pro Plus Analysis software (Media Cybernetics, Bethesda, MD, USA).
2.10 Plate colony formation assay
Two mL medium containing 0.4% agar comprised the bottom gel. Then, 1000 cells were suspended in 4 mL medium containing 0.2% agar, which was poured onto the bottom gel. Subsequent to 2 weeks, the colonies were stained with MTT and were counted under a low-power microscope, followed by colony size analysis using colony counting software (Tanon) [Citation18].
2.11 Transwell assay
A 100 μL serum-free cell suspension containing 50,000 cells was added to the upper chamber of a Transwell plate (containing matrigel [354234, BD Biosciences, USA], 8 μm for a 24-well plate, Millipore, Burlington, MA, USA), and complete medium was added to the lower chamber. After 24 h, the cells were fixed in formalin and stained with 0.1% crystal violet [Citation18].
2.12 Flow cytometry
Cell apoptosis was determined according to the manual provided in the Annexin-V-fluorescein isothiocyanate/propidium iodide apoptosis detection kit (Huaya Stem Cell Technology Co., Ltd., Chongqing, China). The fluorescence intensities were detected with a flow cytometer.
2.13 Dual-luciferase reporter gene assay
The endonuclease sites Spe I and Hind III were introduced into the pMIR reporter. The complementary sequence mutation site of the seed sequence was designed using the pCREB5-wild type (wt) to prepare the pCREB5-mutant type (mut). After restriction enzyme digestion, the target fragment was inserted into the pMIR-reporter reporter plasmid using T4 DNA ligase. The luciferase reporter plasmids, wt and mut, that were sequenced correctly were co-transfected with miR-206 into 293 T cells (CRL-3216, ATCC, USA). The cells were lysed subsequent to 48 h of transfection and centrifuged for 3–5 min after which the supernatant was removed. A luciferase assay kit (RG005, Beyotime) was applied to detect luciferase activity.
2.14 Reverse transcription quantitative polymerase chain reaction (RT-qPCR)
Total RNA was isolated from liver tissue of control mice and HCC mice frozen at −80°C and from cells after 48 h of transfection using TRIzol (16096020, Thermo Fisher Scientific). For miRNA, the PolyA tailing detection kit (B532451, Sangon, China) was used to obtain the cDNA of miRNA containing PolyA tail. mRNA was reversely transcribed into cDNA according to the protocol of the PrimeScript RT Reagent Kit (TaKaRa Corporation, Tokyo, Japan). The primer sequences of miR-206, CREB5, PI3K, and AKT (BGI, Shanghai, China) are shown in Supplementary Table 1–2, and U6 and β-actin served as internal references for miRNA and mRNA, respectively. The relative gene expression was calculated using the 2− ΔΔ Ct method.
2.15 Western blot
Total protein was harvested following lysis in 1× sodium dodecyl sulfate (SDS) containing protease inhibitor (P0013G, Beyotime). Then, the protein concentration was estimated as per the manuals of the bicinchoninic acid protein quantification kit (BCA1-1KT, Sigma). Following 1.5-h SDS-polyacrylamide gel electrophoresis at 100 V, the protein was transferred onto a membrane at 15 V using the semidry transfer method for 10 min, after which the membrane was blocked with 5% skim milk-Tris-buffered saline with Tween 20 for 1 h. The membrane was incubated overnight with primary rabbit anti-human antibodies (1:1000; Abcam) against PI3K (ab182651), CREB5 (ABIN6942656, antibodies-online GmbH), p-AKT (ab38449), AKT (ab8805), GRIM-19 (ab110240), Ki67 (ab16667), and Bad (ab32445) and primary antibody (1:5000; Abbkine, California, USA) against β-actin (8226) at 4°C. After 45 min of re-probing with an HRP-tagged goat anti-rabbit secondary antibody (A0208, Beyotime) at 37°C, the membrane was exposed to enhanced chemiluminescence solution (ECL808-25, Biomiga, San Diego, California, USA) for 1 min at ambient temperature, followed by imaging, photographing and recording. The film was scanned before gray value analysis by analyzing images using the image analysis software Gel-Pro Analyzer 4.0 (Media Cybernetics, Bethesda, MD, USA). β-actin was used for normalization.
2.16 Statistical analysis
SPSS 22.0 (IBM Corp. Armonk, NY, USA) statistical software was used for the statistical analysis, with p < 0.05 indicating statistical significance. The measurement data are expressed as the mean ± standard deviation. Comparisons between two groups were performed by independent sample t test. One-way analysis of variance (ANOVA) and Tukey’s post hoc test were used for comparisons among multiple groups, whereas two-way ANOVA followed by Tukey’s post hoc test was adopted for comparisons of cell proliferation at different time points among multiple groups.
3. Results
3.1 miR-206 may affect the PI3K/AKT signaling pathway by inhibiting CREB5 expression
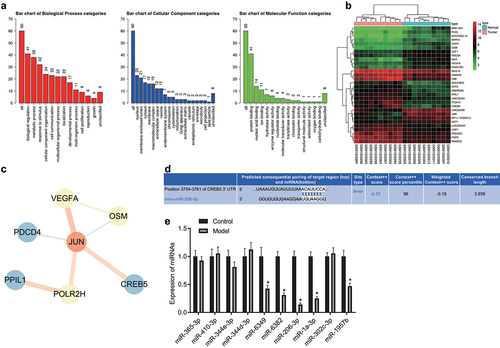
The GEO database was used to search HCC-related microarray datasets, including the expression dataset GSE49515, which contained 10 normal control samples and 10 HCC samples. Differential expression analysis was performed to obtain 72 DEGs. Among them, 39 genes were highly expressed and 33 genes were poorly expressed in HCC samples. GO enrichment analysis of these 72 genes () showed that these DEGs were mainly enriched in processes such as “biological regulation”, “nucleus” and “protein binding”, which indicated that functions related to these GO entries were closely associated with HCC growth and metastasis. Furthermore, the top 30 DEGs were selected to construct expression heatmaps (), and their gene interaction network was analyzed to construct a gene interaction network map (). The results depicted that in the gene interaction network, JUN was in the core position and exhibited very significant interactions with vascular endothelial growth factor A (VEGFA) and CREB5. JUN and VEGFA have been documented to be involved in HCC growth and metastasis [Citation19–22]. However, few studies have examined CREB5 in HCC. We analyzed the protein expression of CREB5 in TCGA HCC dataset, and CREB5 showed high expression in HCC patients (Supplementary Figure 1). Other studies have revealed that CREB5 is closely related to the PI3K/AKT signaling pathway [Citation23,Citation24], which has also been demonstrated to be involved in HCC growth and metastasis [Citation25,Citation26]. These previous reports suggest that the role of CREB5 in HCC is most likely realized through the PI3K/AKT signaling pathway. After further analysis of upstream miRNAs of CREB5, miRNAs targeting CREB5 were predicted in the TargetScan database, and the top 10 miRNAs with the highest context++ score percentile were selected for quantitative analysis (Supplementary Table 3, ), which found that mmu-miR-6349, mmu-miR-6382, mmu-miR-206-3p, mmu-miR-1a-3p, and mmu-miR-1957b were lowly expressed in HCC tissues and mmu-miR-206 expression in HCC samples was the most significant. mmu-miR-206 had a targeted binding site for CREB5. These results suggested the involvement of the miR-206/CREB5/PI3K/AKT axis in HCC.
Figure 1. The miR-206/CREB5/PI3K/AKT axis might be involved in HCC growth and metastasis. A, GO analysis of DEGs in GSE49515 dataset. The three histograms in the figure indicate the enrichment of BP, CC, and MF in the GO analysis. The abscissa indicates the enrichment items, and the ordinate indicates the number of genes. B, Heatmaps of the top 30 DEGs in HCC of the GSE49515 dataset (n = 10 for normal control sample; n = 10 for HCC sample). C, Network diagram of the interaction of the top 30 DEGs. D, Prediction of the interaction between mmu-miR-206 and the CREB5 gene through TargetScan. E, The expression of 10 miRNAs regulating CREB5 in HCC was screened out by RT-qPCR, n = 10. * p < 0.05 vs. the control.
3.2 High expression of CREB5 is observed in mouse HCC tissues
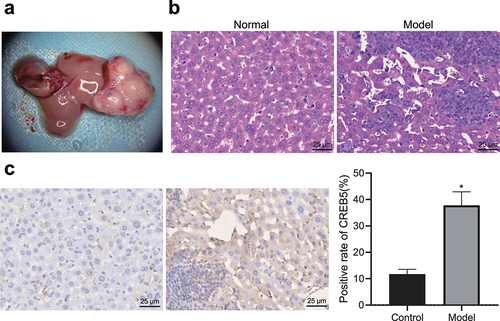
On the 20th day after successful establishment of the HCC mouse model, laparotomy revealed that no ascites formed. Ultrasound examination displayed no tumor formation in the livers of control mice. Single beige tumor nodules with a hard texture were visible in the livers of HCC mice. The maximum diameter of the tumor mass was 5.40–11.31 mm, with an average of 9.63 ± 1.43 mm (). The hepatocytes in the control mice were uniform in size, uniform and normal in morphology, and tightly arranged, whereas the cancer cells in the HCC mice were of different sizes with irregular morphology, and mitosis, large and deeply stained nuclei were observed; moreover, high nuclear grade and distinct heterogeneity including a disordered shape, thin cytoplasm, and no obvious interstitial blood vessels were seen (). As shown in , the results of immunohistochemical staining showed that compared with control mice, the positive expression of CREB5 protein in tissues of HCC mice was significantly increased. Therefore, CREB5 was upregulated in HCC mice.
Figure 2. CREB5 overexpressed in tissues from HCC mice. A, Livers of HCC mice obtained by dissection. B, HE staining results of liver tissues from control and HCC mice (× 400). C, Positive expression of CREB5 protein in liver tissues from control and HCC mice, as determined by immunohistochemical staining (× 400). * p < 0.05 vs. the control mice. n = 10 mice in each group.
3.3 miR-206 targets and down-regulates CREB5 to inhibit the PI3K/AKT signaling pathway
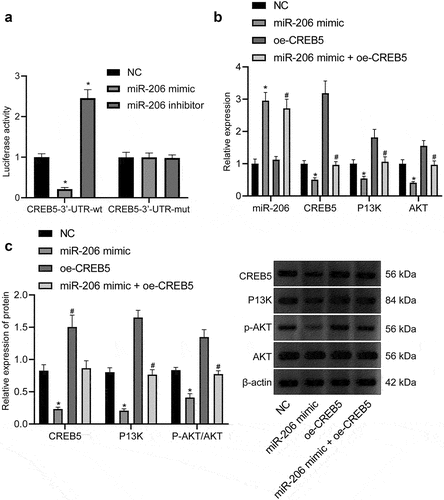
As confirmed by bioinformatics prediction, miR-206 may regulate PI3K/AKT signaling pathway by targeting CREB5. For validation, a dual-luciferase reporter gene assay exhibited that the miR-206 mimic resulted in unchanged luciferase activity in CREB5-3’-UTR-mut and diminished luciferase activity in CREB5-3’-UTR-wt (), highlighting the bind of CREB5-3’-UTR by miR-206. Then, we found that miR-206 mimic treatment led to increased miR-206 but reduced CREB5, PI3K, and AKT expression as well as p-AKT/AKT ratio; while oe-CREB5 treatment caused increased CREB5, PI3K, and AKT expression as well as p-AKT/AKT ratio. Relative to miR-206 mimic treatment, miR-206 mimic + oe-CREB5 treatment exerted no effect on miR-206 expression but increased CREB5, PI3K, and AKT expression as well as p-AKT/AKT ratio (). The aforementioned results suggested that miR-206 could specifically bind to the CREB5-3’-UTR to downregulate CREB5, thereby suppressing PI3K/AKT signaling pathway.
Figure 3. miR-206 targets CREB5 to suppress PI3K/AKT signaling pathway. A, Targeting relationship between miR-206 and CREB5, as assessed by dual-luciferase reporter gene assay. B, RT-qPCR detection of the expression of miR-206, CREB5, and PI3K/AKT signaling pathway-related factors in MHCC97-H cells transfected with miR-206 mimic or oe-CREB5. C, Western blot analysis of protein expression of CREB5 and PI3K/AKT signaling pathway-related factors in MHCC97-H cells transfected with miR-206 mimic or oe-CREB5. * p < 0.05 vs. the NC treatment. # p < 0.05 vs. MHCC97-H cells transfected with miR-206 mimic. Cell experiments were repeated for three times.
3.4 Downregulation of CREB5 by miR-206 inhibits the PI3K/AKT signaling pathway and inhibits HCC cell proliferation, migration, and invasion but accelerates HCC cell apoptosis
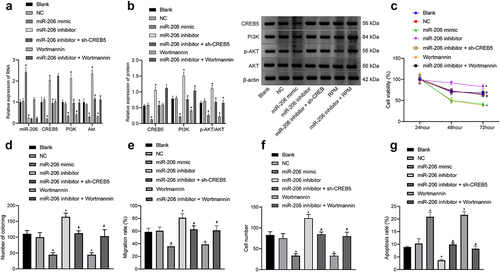
Then, we focused on the role of miR-206-mediated CREB5 in HCC cell functions in relation to PI3K/AKT signaling pathway. As reflected by the results of RT-qPCR and western blot analysis, miR-206 expression was elevated, whereas PI3K, AKT and CREB5 expression as well as p-AKT/AKT ratio was decreased in MHCC97-H cells after treatment of miR-206 mimic, whereas the opposite trends were observed in miR-206 inhibitor-treated MHCC97-H cells. Moreover, relative to miR-206 inhibitor treatment, further Wortmannin treatment did not affect miR-206 and CREB5 expression but caused a decline in PI3K and AKT expression as well as p-AKT/AKT ratio in MHCC97-H cells, while miR-206 inhibitor + sh-CREB5 treatment caused reductions in PI3K, AKT and CREB5 expression (). MTT assay noted that at 48 and 72 h, miR-206 inhibitor induced cell growth while Wortmannin or miR-206 mimic treatment led to opposite trend; relative to miR-206 inhibitor treatment, miR-206 inhibitor + sh-CREB5 or miR-206 inhibitor + Wortmannin treatment suppressed cell proliferation (). Additionally, miR-206 inhibitor induced colony formation, invasiveness, and migration of MHCC97-H cells while Wortmannin or miR-206 mimic treatment led to opposite trend; relative to miR-206 inhibitor treatment, miR-206 inhibitor + sh-CREB5 or miR-206 inhibitor + Wortmannin treatment suppressed colony formation, invasiveness, and migration of MHCC97-H cells (, Supplementary Figure 2A-C). Further, flow cytometry revealed that miR-206 inhibitor decreased cell apoptosis while Wortmannin or miR-206 mimic treatment led to opposite trend; relative to miR-206 inhibitor treatment, miR-206 inhibitor + sh-CREB5 or miR-206 inhibitor + Wortmannin treatment enhanced cell apoptosis (, Supplementary Figure 2D). In conclusion, miR-206 overexpression depressed HCC cell proliferation, migration and invasion and promoted cell apoptosis through suppression of the PI3K/AKT signaling pathway by decreasing CREB5.
Figure 4. miR-206 overexpression blocks the PI3K/AKT signaling pathway and depresses proliferation, migration, and invasion but accelerates apoptosis in HCC cells. MHCC97-H cells were treated with miR-206 mimic, miR-206 inhibitor, NC, Wortmannin, miR-206 inhibitor + sh-CREB5, or miR-206 inhibitor + Wortmannin. A, RT-qPCR detection of the expression of miR-206, CREB5, and PI3K/AKT signaling pathway-related factors in MHCC97-H cells. B, Western blot analysis of protein expression of CREB5 and PI3K/AKT signaling pathway-related factors in MHCC97-H cells. C, MHCC97-H cell viability was assessed by MTT assay. D, Colony formation of MHCC97-H cells was assessed by plate colony formation assay. E, MHCC97-H cell migration was detected by scratch test. F, MHCC97-H cell invasion was detected by Transwell assay. G, MHCC97-H cell apoptosis was evaluated by flow cytometry. * p < 0.05 vs. MHCC97-H cells treated with NC. # p < 0.05 vs. MHCC97-H cells treated with miR-206 inhibitor. The cell experiments were repeated 3 times.
3.5 miR-206, bad, GRIM-19 and PTEN are downregulated but PI3K, AKT, CREB5, and Ki67 are upregulated in HCC mice
mRNA expression in hepatocytes of control and HCC mice was evaluated by RT-qPCR. The results exhibited that compared with those of control mice, hepatocytes of HCC mice had lower miR-206 levels and lower expression of Bad, GRIM-19 and PTEN mRNA levels but higher expression of PI3K, AKT, CREB5, and Ki67 mRNA levels ().
Figure 5. Expression of miR-206, Bad, GRIM-19 and PTEN is reduced, but expression of PI3K, AKT, Ki67, and CREB5 is enhanced in HCC mice. A, miR-206 expression and Bad, GRIM-19, PTEN, PI3K, AKT, Ki67, and CREB5 mRNA expression in hepatocytes of control and HCC mice, as evaluated by RT-qPCR. B, western blot analysis of Bad, GRIM-19, PTEN, PI3K, AKT, Ki67, and CREB5 protein expression in the liver tissues of control and HCC mice. * p < 0.05 vs. the control mice. n = 20 mice in each group. For this measurement data, data are shown as the mean ± standard deviation, and an independent sample t test was used for comparisons between two groups.
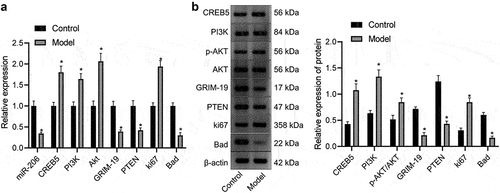
Western blot analysis was used to detect protein expression in the liver tissues of control and HCC mice. As described in , Bad, GRIM-19 and PTEN protein levels were high, while PI3K, p-AKT, AKT, Ki67, and CREB5 protein levels were low in liver tissues of control mice. Compared with those of control mice, liver tissues of HCC mice exhibited reduced Bad, GRIM-19, and PTEN protein levels but augmented PI3K, p-AKT, AKT, Ki67, and CREB5 protein levels.
4. Discussion
Over the last several decades, scientists have gained an understanding of HCC pathology and have developed therapeutic strategies for HCC [Citation27]. However, the clinical outcome is still poor. In this study, we aimed to investigate the potential anticancer role of miR-206, which targets CREB5, in HCC cells. Consequently, the main finding of this study was that miR-206 upregulation targeted CREB5 to inhibit activation of the PI3K/AKT signaling pathway, thereby inhibiting proliferation, migration, and invasion but promoting apoptosis of HCC cells.
Initially, our data illustrated that CREB5 was highly expressed in tissues from HCC mice and was targeted by miR-206. CREB5 has important roles in regulating cell growth, proliferation, differentiation, cell cycle, and angiogenesis [Citation23]. CREB5 overexpression has been identified in several types of human cancer such as epithelial ovarian cancer and triple-negative breast cancer and is associated with a poor prognosis [Citation16,Citation28]. Notably, it was reported that CREB5 upregulation was associated with a poor prognosis in HCC [Citation14]. Only a few studies have been published on CREB5 expression in HCC. However, similar findings have been reported in other tumors. For instance, Qi et al. analyzed gene expression profiles in colorectal cancer (CRC) and showed that CREB5 overexpression was correlated with tumor metastasis [Citation29]. Seo et al. reported that the levels of both CREB and phosphorylated CREB were significantly elevated in most non-small cell lung cancer cell lines and tumor specimens [Citation30]. Our bioinformatics methods and cell experiments were performed to confirm that CREB5 had great potential to activate the PI3K/AKT signaling pathway. Other group studies on the function of the CREB5 gene also found that it was likely related to the PI3K/AKT signaling pathway, which is consistent with our results [Citation24]. The PI3K/AKT signaling pathway is overactive and controls several important cellular processes, including cell growth, survival regulation, and drug resistance, in multiple solid tumors [Citation31]. The PI3K/AKT signaling pathway is the most critical and hyperactivated pathway in ~50% of HCC [Citation32]. Many studies have shown a strong association between the PI3K/AKT signaling pathway and HCC and that inhibition of this pathway could be a viable HCC treatment strategy [Citation16].
As important regulators, the role of miRNAs in the pathogenesis of liver cancer has been widely confirmed [Citation33,Citation34]. In subsequent experiments, we also found that miR-206 overexpression repressed cell proliferation, invasion, colony formation and migration but promoted cell apoptosis in HCC by inhibiting the PI3K/AKT signaling pathway via CREB5. A previous study revealed that miR-206 was downregulated in HCC tissues [Citation10]. Moreover, miR-206 overexpression can induce apoptosis and decrease cell proliferation, migration, invasion and metastasis in gastric cancer [Citation35]. Additionally, another study reported a decrease in cell viability and colony formation caused by ectopic expression of miR-206 in non-small lung cancer [Citation36]. Importantly, data obtained by Wu et al. elaborated that by inhibiting the expression of cMET, CCND1 and CDK6, miR-206 blocked cell cycle progression, impaired proliferation, and elevated apoptosis in human HCC cell lines [Citation37]. Additionally, another study illustrated that miR-206 up-regulation caused repression of HCC cell proliferation, invasion, and migration via PTP1B [Citation38]. In addition, CREB5 overexpression led to elevated cell malignant features in CRC [Citation39]. More importantly, a prior study revealed the decline in migration, invasion and proliferation and the elevation in apoptosis in HCC cells after PI3K/AKT signaling pathway disruption [Citation40]. Our data suggested that miR-206 targets CREB5 in HCC, and ours is the first study to report the targeting of CREB5 by miR-206. Our biological and cell-based data showed that miR-206 overexpression reduced the growth, proliferation, and metastasis and promoted apoptosis of HCC cells by targeting CREB5 and inactivating the PI3K/AKT signaling pathway.
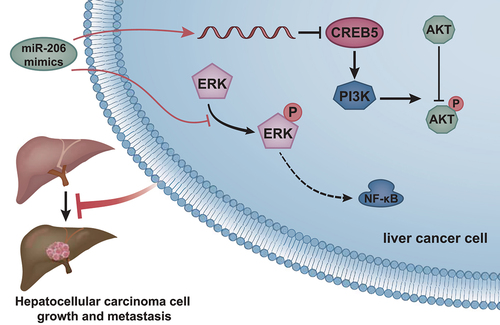
5. Conclusions
In conclusion, our data provided evidence demonstrating that miR-206 could target CREB5 directly and inactivate the PI3K/AKT signaling pathway to repress HCC growth and metastasis and to induce apoptosis. Therefore, miR-206 might be a potential candidate for HCC treatment (). However, this study had several limitations. First, a CREB5 knockdown experiment should be performed for miR-206 target validation. Then, downstream molecules of CREB5, such as cyclin A1, should be overexpressed to investigate whether they are essential for PI3K/AKT signaling pathway activation.
Figure 6. Molecular mechanism of miR-206 regulating CREB5-mediated PI3K/AKT signaling pathway to affect the growth and metastasis of HCC.
Availability of data and materials
The datasets used and/or analyzed during the present study are available from the corresponding author on reasonable request.
Supplemental Material
Download Zip (49.4 MB)Acknowledgments
We acknowledge and appreciate our colleagues for their valuable efforts and comments on this paper.
Disclosure statement
No potential conflict of interest was reported by the author(s).
Supplementary material
Supplemental data for this article can be accessed online at https://doi.org/10.1080/15384101.2022.2108275
Additional information
Funding
References
- Forner A, Reig M, Bruix J. Hepatocellular carcinoma. Lancet. 2018;391:1301–1314.
- Villanueva A. Hepatocellular Carcinoma. N Engl J Med. 2019;380:1450–1462.
- Yang JD, Hainaut P, Gores GJ, et al. A global view of hepatocellular carcinoma: trends, risk, prevention and management. Nat Rev Gastroenterol Hepatol. 2019;16:589–604.
- Llovet JM, Zucman-Rossi J, Pikarsky E, et al. Hepatocellular carcinoma. Nat Rev Dis Primers. 2016;2:16018.
- Llovet JM, Montal R, Sia D, et al. Molecular therapies and precision medicine for hepatocellular carcinoma. Nat Rev Clin Oncol. 2018;15:599–616.
- Berindan-Neagoe I, Monroig Pdel C, Pasculli B, et al. MicroRNAome genome: a treasure for cancer diagnosis and therapy. CA Cancer J Clin. 2014;64:311–336.
- Mitchelson KR, Qin WY. Roles of the canonical myomiRs miR-1, −133 and −206 in cell development and disease. World J Biol Chem. 2015;6:162–208.
- Lima CR, Gomes CC, Santos MF. Role of microRNAs in endocrine cancer metastasis. Mol Cell Endocrinol. 2017;456:62–75.
- Wei L, Wang X, Lv L, et al. The emerging role of microRNAs and long noncoding RNAs in drug resistance of hepatocellular carcinoma. Mol Cancer. 2019;18:147.
- Mirzaei HR, Sahebkar A, Mohammadi M, et al. Circulating microRNAs in hepatocellular carcinoma: potential diagnostic and prognostic biomarkers. Curr Pharm Des. 2016;22:5257–5269.
- Nohata N, Hanazawa T, Enokida H, et al. microRNA-1/133a and microRNA-206/133b clusters: dysregulation and functional roles in human cancers. Oncotarget. 2012;3:9–21.
- Chang Y, Zhang J, Zhou C, et al. Long non-coding RNA FOXD2-AS1 plays an oncogenic role in hepatocellular carcinoma by targeting miR206. Oncol Rep. 2018;40:3625–3634.
- Mayr B, Montminy M. Transcriptional regulation by the phosphorylation-dependent factor CREB. Nat Rev Mol Cell Biol. 2001;2:599–609.
- Wu J, Wang ST, Zhang ZJ, et al. CREB5 promotes cell proliferation and correlates with poor prognosis in hepatocellular carcinoma. Int J Clin Exp Pathol. 2018;11:4908–4916.
- Xu F, Na L, Li Y, et al. Roles of the PI3K/AKT/mTOR signalling pathways in neurodegenerative diseases and tumours. Cell Biosci. 2020;10:54.
- Dimri M, Satyanarayana A. Molecular signaling pathways and therapeutic targets in hepatocellular carcinoma. Cancers (Basel). 2020;12:491.
- Zhang H, Wang Q, Liu J, et al. Inhibition of the PI3K/Akt signaling pathway reverses sorafenib-derived chemo-resistance in hepatocellular carcinoma. Oncol Lett. 2018;15:9377–9384.
- Zhou C, Ji J, Cai Q, et al. MTA2 enhances colony formation and tumor growth of gastric cancer cells through IL-11. BMC Cancer. 2015;15:343.
- Chow RKK, Tsz-Kwan Sin S, Liu M, et al. AKR7A3 suppresses tumorigenicity and chemoresistance in hepatocellular carcinoma through attenuation of ERK, c-Jun and NF-kappaB signaling pathways. Oncotarget. 2017;8:83469–83479.
- Wang Y, Xu Y, Yan W, et al. CFIm25 inhibits hepatocellular carcinoma metastasis by suppressing the p38 and JNK/c-Jun signaling pathways. Oncotarget. 2018;9:11783–11793.
- Qin C, Zha W, Fan R, et al. MicroRNA302a inhibits cell proliferation and invasion, and induces cell apoptosis in hepatocellular carcinoma by directly targeting VEGFA. Mol Med Rep. 2017;16:6360–6367.
- Wu L, Zhang YS, Ye ML, et al. Overexpression and correlation of HIF-2alpha, VEGFA and EphA2 in residual hepatocellular carcinoma following high-intensity focused ultrasound treatment: implications for tumor recurrence and progression. Exp Ther Med. 2017;13:3529–3534.
- Bhardwaj A, Singh H, Rajapakshe K, et al. Regulation of miRNA-29c and its downstream pathways in preneoplastic progression of triple-negative breast cancer. Oncotarget. 2017;8:19645–19660.
- Jiang T, Wang XQ, Ding C, et al. Genistein attenuates isoflurane-induced neurotoxicity and improves impaired spatial learning and memory by regulating cAMP/CREB and BDNF-TrkB-PI3K/Akt signaling. Korean J Physiol Pharmacol. 2017;21:579–589.
- Wu JH, Tian XY, An QM, et al. LINC00963 promotes hepatocellular carcinoma progression by activating PI3K/AKT pathway. Eur Rev Med Pharmacol Sci. 2018;22:1645–1652.
- Jiang H, Zhou Z, Jin S, et al. PRMT9 promotes hepatocellular carcinoma invasion and metastasis via activating PI3K/Akt/GSK-3beta/Snail signaling. Cancer Sci. 2018;109:1414–1427.
- Crissien AM, Frenette C. Current management of hepatocellular carcinoma. Hepatol G (N Y). 2014;10:153–161.
- He S, Deng Y, Liao Y, et al. CREB5 promotes tumor cell invasion and correlates with poor prognosis in epithelial ovarian cancer. Oncol Lett. 2017;14:8156–8161.
- Qi L, Ding Y. Involvement of the CREB5 regulatory network in colorectal cancer metastasis. Yi Chuan. 2014;36:679–684.
- Seo HS, Liu DD, Bekele BN, et al. Cyclic AMP response element-binding protein overexpression: a feature associated with negative prognosis in never smokers with non-small cell lung cancer. Cancer Res. 2008;68:6065–6073.
- Chen C, Wang G. Mechanisms of hepatocellular carcinoma and challenges and opportunities for molecular targeted therapy. World J Hepatol. 2015;7:1964–1970.
- Zhou Q, Lui VW, Yeo W. Targeting the PI3K/Akt/mTOR pathway in hepatocellular carcinoma. Future Oncol. 2011;7:1149–1167.
- Wang X, He Y, Mackowiak B, et al. MicroRNAs as regulators, biomarkers and therapeutic targets in liver diseases. Gut. 2021;70(4):784–795.
- Qadir MI, Rizvi SZ. miRNA in hepatocellular carcinoma: pathogenesis and therapeutic approaches. Crit Rev Eukaryot Gene Expr. 2017;27(4):355–361.
- Deng M, Qin Y, Chen X, et al. MiR-206 inhibits proliferation, migration, and invasion of gastric cancer cells by targeting the MUC1 gene. Onco Targets Ther. 2019;12:849–859.
- Jia KG, Feng G, Tong YS, et al. miR-206 regulates non-small-cell lung cancer cell aerobic glycolysis by targeting hexokinase 2. J Biochem. 2020;167:365–370.
- Wu H, Tao J, Li X, et al. MicroRNA-206 prevents the pathogenesis of hepatocellular carcinoma by modulating expression of met proto-oncogene and cyclin-dependent kinase 6 in mice. Hepatology. 2017;66:1952–1967.
- Yang Q, Zhang L, Zhong Y, et al. miR-206 inhibits cell proliferation, invasion, and migration by down-regulating PTP1B in hepatocellular carcinoma. Biosci Rep. 2019;39. DOI:10.1042/BSR20181823.
- Zhang X, Xu Y, Yamaguchi K, et al. Circular RNA circVAPA knockdown suppresses colorectal cancer cell growth process by regulating miR-125a/CREB5 axis. Cancer Cell Int. 2020;20:103.
- Wang X, Dong K, Jin Q, et al. Upregulation of lncRNA FER1L4 suppresses the proliferation and migration of the hepatocellular carcinoma via regulating PI3K/AKT signal pathway. J Cell Biochem. 2019;120:6781–6788.