
ABSTRACT
High-grade serous ovarian cancer (HGSOC) is the most common and malignant type of ovarian cancer, accounting for 70%–80% of mortality. However, the treatment of HGSOC has improved little in the past few decades. Metformin is the first-line medication for the treatment of type 2 diabetes and has now gained more attention in cancer treatment. In this study, we sought to identify potential hub genes that metformin could target in the treatment of HGSOC. We downloaded GSE69428 and GSE69429 in the Gene Expression Omnibus database and performed the bioinformatics analysis. Subsequently, we analyzed the effect of Metformin in HGSOC through biological experiments. Molecular simulation docking was used to predict the interaction of Metformin and CCNE1. We chose CCNE1 for the study based on bioinformatics analysis, literature studies, and preliminary data. We evaluated that CCNE1 is overexpressed in HGSOC tissues and found that HGSOC cells with high CCNE1 expression increase sensitivity to Metformin treatment in the analysis of cell proliferation and anchorage-independent growth. Metformin could inhibit the expression of CCNE1, which is associated with the anti-proliferative effect of tumor cells. Moreover, Metformin could ameliorate the tumor growth in syngeneic orthotopic transplantation mouse models and xenograft tumorigenesis models. Furthermore, molecular simulation docking showed that Metformin may bind to CCNE1 protein, suggesting that CCNE1 could be a potential target for Metformin. Our data revealed that Metformin has antitumor effects on ovarian cancer and CCNE1 could be a potential target for Metformin.
Introduction
High-grade serous ovarian cancer (HGSOC) remains a deadly disease of women in the world [Citation1], the disease is often diagnosed in the advanced stage with a poor prognosis [Citation2] due to its obscure etiology [Citation3], high recurrence rate, and chemotherapy resistance [Citation4]. HGSOC accounts for 70–80% of all epithelial ovarian cancer deaths [Citation5] and its prognosis has not improved over the decades [Citation6–8]. The American Cancer Society estimated that there would be 21,750 new cases and 13,940 deaths in the United States in 2020 [Citation1]. The effective treatment of this disease is lacking, and there is an urgent need to identify potential therapeutic targets and drugs [Citation9].
Due to the limitations of effective chemotherapeutic drugs to HGSOC, the potential targets of cancer treatments have raised more attention to searching the candidate drugs. Metformin has been used for decades as a first-line and effective drug for diabetes [Citation10] with other benefits including good safety and low cost [Citation11]. Recently, Metformin has been tested in the treatment of certain cancers and some positive results [Citation12–14]. Preclinical studies have shown that Metformin inhibited the growth of cancer cells both in vitro and in vivo, through the mechanism mediated by the AMPK pathway [Citation15,Citation16]. Meanwhile, it can effectively inhibit the migration of glioblastoma cancer cells [Citation17]. Metformin can act as an electron transport chain (ETC) inhibitor to suppress triple-negative breast cancer (TNBC) growth [Citation18]. Liwei Ma et al. also found that Metformin induces mitochondrial damage and endoplasmic reticulum stress in ovarian cancer cells under low glucose conditions, which leads to cell apoptosis [Citation19]. These cancer inhibitory effects of Metformin prompted us to investigate the anti-tumor effect on HGSOC and the possible mechanism underlying this inhibition.
In the progression of ovarian cancer, Cyclin E1 (CCNE1) is considered to be an essential proto-oncogene. TCGA data showed that CCNE1 alterations are found in more than 60% of patients (319/489) [Citation20], consistent with previous reports [Citation21,Citation22]. Some studies found that amplification of CCNE1 is associated with cisplatin resistance and poor clinical prognosis in HGSOC [Citation23–25], and the overexpression of CCNE1 caused chromosomal instability in primary human cells and mice [Citation26,Citation27]. In addition, CCNE1 was proved to be associated with the transformation of fallopian tube secretory cells in the formation of HGSOC [Citation20]. In summary, the amplification of CCNE1 signaling is essential in the development of HGSOC and promotes drug resistance.
The development of high-throughput technologies has enabled us to gain a more comprehensive understanding of the changes in gene mapping during the progression of cancer, providing more viable research directions. In our study, we analyzed the gene expression profile matrix files (GSE69428 & GSE69429) [Citation28] to identify potential hub genes in the progression of HGSOC by bioinformatics tools. Through the protein–protein interaction (PPI) network construction and HUB gene screening, we identified seven genes, including CCNE1, which was increased in the top 10 hub genes, indicating the association with carcinogenesis. Through the in vitro and in vivo study, we also verified that Metformin had an anti-tumor effect in ovarian cancer cells and the efficiency was related to the CCNE1 level of cells.
Materials and methods
Data source and identification
The Gene Expression Omnibus (GEO) is a public repository for storing high-throughput gene expression data sets. GSE69428 contains 10 fallopian tube epithelial tissues and 10 high-grade serous ovarian cancer tissues. GSE69429 consists of six fallopian tube epithelial tissues and six Invasive serous carcinoma tissues. Their platforms are GPL570 [HG-U133_Plus_2] Affymetrix Human Genome U133 Plus 2.0 Array and GPL5175 [HuEx-1_0-st] Affymetrix Human Exon 1.0 ST Array [transcript (gene) version], respectively. RStudio, an interactive analysis tool, was used to normalize the raw data and identify differentially expressed genes (DEGs). In our study, p < 0.01 and |fold change (FC)| > 2 were used as the cutoff criteria to find DEGs.
GO and KEGG enrichment analyses of DEGs
The Database for Annotation, Visualization and Integrated Discovery (DAVID) v6.8 was used to perform Gene Ontology (GO), including cellular component (CC), biological process (BP) and molecular function (MF), and Kyoto Encyclopedia of Genes and Genomes (KEGG) pathway enrichment analysis. P values <0.05 were considered to be statistically significant.
Protein–protein interaction (PPI) network construction, module analysis and identification of hub Genes
The PPI network of DEGs was constructed by Search Tool for the Retrieval of Interacting Gene (STRING) database version 11.5. Interaction score of 0.9 was regarded as the cutoff criterion in our study. Core modules of PPI were analyzed by ClusterONE in Cytoscape software. The top 10 hub genes, considered as potential biomarkers for cancer therapy and research, were performed by CytoHubba in Cytoscape software. Gene Expression Profiling Interactive Analysis (GEPIA) verified whether the expression of hub genes was consistent with GEO database.
Gene set enrichment analysis
Gene set enrichment analysis (GSEA) software, an algorithm to analyze whether a gene set shows significant differences in consistency between the two biological states [Citation29], was used to explore the biological function of CCNE1 in HGSOC. We analyzed the KEGG function of CCNE1 in GSE69428 and GSE69429 using GSEA software to identify its positive and negative regulatory pathways. The results were screened by NOM p-value (p < 0.05) and sorted by NES.
FFs and clinical specimens
Follicular fluid (FF) aspirates were collected from women (aged 30–47 years) who underwent oocyte retrieval and in vitro fertilization. After centrifugation to removal cell debris (1200 g, 10 min), they were subjected to spectrophotometry to identify aspirates with minimal contamination with blood and flush medium. Only these yellow color FFs without contamination were used in the experiments. HGSOC tissues were collected from patients with the debulking surgery. Normal fallopian tube tissues were collected from women who underwent prophylactic salpingectomies during operations. The specimen collection program was approved by the Research Ethics Committee of the Buddhist Tzu Chi Medical Foundation (Approval IRB108-12-A).
Cell viability
The mouse ovarian cancer cell line ID8, obtained from Dr Chu (Department of Research, Tzu Chi General Hospital, Taiwan), was cultured in Dulbecco’s modified Eagle’s medium supplemented with 4% fetal bovine serum, 100 IU/ml penicillin, and 100 µg/ml streptomycin and ITS (5 µg/ml insulin, 5 µg/ml transferrin and 5 ng/ml sodium selenite) at 37℃ with 5% CO2. OVCAR3 cells were cultured in RPMI-1640 medium (GIBCO, Carlsbad, CA), supplemented with 10% fetal bovine serum, 100 IU/ml penicillin, and 100 µg/ml streptomycin at 37°C with 5% CO2. Cell proliferation analysis was performed by an MTS assay. Cells were plated onto 96 plates (6x10³ cells/well) and detected at 48 and 72 h, respectively, after treatments. Each experiment was repeated at least three times.
Anchorage-Independent cell growth (AIG) assay
In a 12-well plate, each well was covered with 0.8% basal agarose. After solidification, 2000 cells were suspended in 0.4% agarose and added onto the basal agarose. Pure FF (50 µl/ml), HGF (20 ng/ml), IGF2 (100 ng/ml), HGF+IGF2 and control medium were added to the surface of the top gel with or without Metformin (5 mM) every 24 h for 2 days, respectively. After that, fresh medium was added every 3 days until 14 days. The number of colonies larger than 25 or 50 μm was counted under magnification microscope. Each experiment was repeated at least three times.
SiRNA transfection
SiRNA (target sequence: CCNE1) and control siRNA were purchased from JTS Scientific. The cells were planted on a 6-well plate. After 24 h, the 5 μl siRNA (100 pmol) and 5 μl iMAX (Invitrogen, 2,232,172) was added to 150 μl Opti-MEM (Gibco, 2,192,861), respectively. Then, siRNA/opti and iMAX/opti were mixed for 15 min. The mixture was added to the culture medium. The cells were cultured for 24-72 h in siRNA mixture and collected to detect the expression of CCNE1.
Quantitative real-time PCR
Total RNA was extracted using RNAiso Plus (Takara, 9108) and then reverse-transcribed into complementary DNA (cDNA) using PrimeScript™ RT reagent Kit with gDNA Eraser (Takara, RR047A) according to the manufacturer’s instructions. The qRT-PCR was performed on Roch LightCycler® 480 using TB Green® Premix DimerEraser™ (Takara, RR091A). The fold change in gene expression for all the genes was calculated using the Ct method (2−ΔΔCt). The forward and reverse primer pairs are as follows: β-actin (5’-CATGTACGTTGCTATCCAGGC-3’, 5’-CTCCTTAATGTCACGCACGAT-3’); CCNE1 (5’-TCTCCACCAAAGACAGTTGCG-3’, 5’-CACTTTGCCCTGTTTGATGCC-3’).
Western blot analysis
The cells were collected and lysed using RIPA buffer containing protease inhibitors. 40 μg of protein samples were separated by SDS-PAGE and transferred to PVDF membranes. Membranes were blocked in 5% nonfat milk for 2 h at room temperature and probed with primary antibodies against GAPDH (Proteintech, 60,004-1-Ig, 1: 20,000 dilution) and CCNE1 (Santa Cruz, sc-247, 1:500 dilution) overnight at 4℃. Then, membranes were incubated with horseradish peroxidase (HRP)-conjugated secondary antibodies for 1.5 h at room temperature and immunolabeling detected using a Bio-Rad imaging system.
Establishment and drug administration of animal models
We used xenograft ectopic and syngeneic orthotopic transplantation mouse models to analyze the in vivo Metformin therapeutic effect. In the xenograft tumorigenesis model, 4- to 5-week-old nude mice (sex, females) were fed under SPF condition (sterile laminar flow chamber, room temperature 21–25 ℃, the humidity of 60% to 70%) at the Department of Laboratory Animals, Hunan Cancer Hospital. OVCAR3 cells in the logarithmic growth phase were harvested and resuspended in medium at a density of 4 × 10⁷/ml. 100 μl of cell suspension (4 × 10⁶ cells per mouse) was slowly injected intraperitoneally into nude mice. At the same time, Metformin solution was prepared with normal saline. The mice of control group and drug treatment group were given 100 μl of normal saline and Metformin (400 mg/kg) by gastric irrigation, respectively. Normal saline and Metformin were administrated every day for 31 days, and the body weight and tumor volume of mice was measured every 3 days. Mice were killed by the method of cervical dislocation after the last treatment of normal saline and Metformin, and the tumor tissue was collected for further research. Xenograft mouse model experiments were conducted under the approved guidelines of the Animal Care Committee of Hunan Cancer Hospital (SBQLL-2020-007). For the orthotopic syngeneic transplantation model, female C57BL/6 mice with age 6- to 8-week-old and fed in the SPF grade animal center of Tzu Chi University were used. 2 × 10⁶ ID8 cells, in 10 ul volume, were injected into the ovarian bursa of mice under a dissecting microscope, and mice were anesthetized with isoflurane. For drug delivery, a micro-osmotic pump (Alzet MODEL 1004) containing 35 mg Metformin in a volume of 100 μl was implanted to the dorsal subcutaneous of mice. Mice were sacrificed after four months, and tumors and ovarian tissue were collected, weighed and prepared for further analysis. All experimental procedures were conducted under the approved guidelines of the Animal Care and Use Committee of Tzu-Chi University (Approval ID: 107–49).
Immunohistochemical staining
The tissue sections of tumor specimens were embedded in paraffin and cut into 5-μm-thick slices. The slices were deparaffinized in xylene and dehydration in a graded alcohol series. After antigen retrieval by microwaving in pH 6.0 citrate buffer for 10 min, inhibition of endogenous peroxidase activity was performed. After blocking nonspecific binding, the sliced specimens were incubated with primary antibody against CCNE1 (Servicebio, GB11305, 1:1000 dilution), PAX8 (Proteintech, 10,336-1-AP, 1:2000 dilution), and WT1 (Servicebio, GB11382, 1:200 dilution) overnight at 4℃ in a humidified container. Next, the sections were incubated with appropriate secondary antibodies and stained with IHC agents.
Molecular docking
RCSB Protein Data Bank (PDB) is a database that allows researchers to obtain the 3D shapes of proteins, nucleic acids, and complex assemblies. We downloaded the X-ray structure of CCNE1 from RCSB PDB (PDB ID: 5L2W). The FDA-approved drug library was obtained from DrugBank. ChemBioDraw 2014 was used to construct the 2D structures of the FDA-approved drug molecules, and Molecular Operating Environment (MOE) was used for converting 2D to 3D structures through energy minimization. MOE dock was used for homology modeling and molecular docking simulations of the binding affinity between Metformin and the target protein. We selected the force field of AMBER10:EHT and the implicit solvation model of Reaction Field (R-field) before docking. The protonation state of the protein and the orientation of the hydrogens were optimized by LigX, at the pH of 7 and temperature of 300 K. The docking workflow followed the “induced fit” protocol, in which the side chains of the receptor pocket were allowed to move according to ligand conformations, with a constraint on their positions. The weight used for tethering side chain atoms to their original positions was 10. All docked poses were ranked by London dG scoring first, and then a force field refinement was carried out on the top 10 poses followed by a rescoring of GBVI/WSA dG. The conformation with the lowest free energy of binding was selected as the best (probable) binding mode. We visualized the docking results using PyMOL.
Statistical analysis
All data were processed using GraphPad Prism 8.0 statistical software. Data are presented as the mean ± SEM. Statistical significance among groups was compared using a Student’s t-test or one-way analysis of variance (ANOVA) test. P < 0.05 was considered to indicate a statistically significant difference.
Results
Identification of differentially expressed genes in HGSOC
GSE69428 and GSE69429 were analyzed using RStudio, obtaining 1347 and 1045 DEGs, respectively. There were 354 overlapping DEGs, containing 53 upregulated genes and 301 downregulated genes, as shown in Supplementary Table S1.
Over-Represented biological pathways in HGSOC
The GO enrichment analysis of 354 overlapping genes is shown in . Genes were enriched in biological processes (BP) of cilium movement, sperm axoneme assembly, microtubule-based movement, cilium assembly, epithelial cilium movement and so on. As for cellular component (CC), these genes showed enrichment in axoneme, motile cilium, 9 + 2 motile cilium, cilium and microtubule. The molecular function (MF) results showed that overlapping genes were most enriched in microtubule binding, microtubule motor activity, ATP-dependent microtubule motor activity, minus-end-directed, protein binding and dynein intermediate chain binding. KEGG pathway enrichment analysis showed that 354 overlapping genes were mainly enriched in Cell cycle, Human T-cell leukemia virus 1 infection, p53 signaling pathway, Complement and coagulation and Hepatitis B, as shown in .
Table 1. GO functional enrichment and KEGG pathway analysis of DEGs.
CCNE1 as a key HUB gene in HGSOC
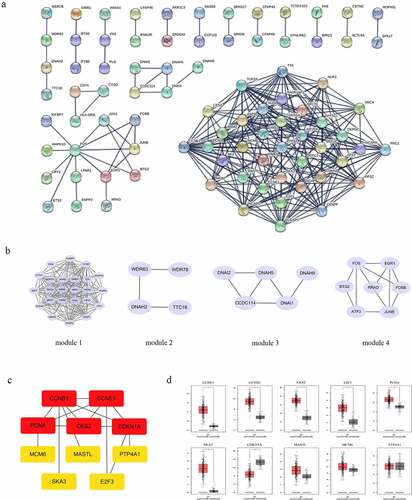
STRING online software constructed the PPI network of 354 overlapping DEGs, composed of 86 nodes and 226 edges after excluding the isolated nodes, as shown in . The top 4 core modules in the PPI were identified using ClusterONE in Cytoscape software (). Module 1, consisting of 24 nodes and 162 edges, was mainly enriched in the KEGG pathway including the cell cycle, and the p53 signaling pathway. Module 2 consisted of 5 nodes and 6 edges. Module 3 contained 4 nodes and 3 edges. Module 4 contained 7 nodes and 11 edges. The top 10 hub genes were identified in the PPI network: CCNE1, CCNB1, CKS2, E2F3, PCNA, SKA3, CDKN1A, MASTL, MCM6 and PTP4A1. As shown in , the PPI network of hub genes consisted of 10 nodes and 15 edges. Among them, 2 genes (CDKN1A and PTP4A1) were downregulated and 8 genes (CCNE1, CCNB1, CKS2, E2F3, PCNA, SKA3, MASTL, and MCM6) were upregulated in HGSOC tissue. Finally, we verified these 10 hub genes by GEPIA and found that 7 gene (CCNE1, CCNB1, CKS2, E2F3, PCNA, SKA3, and CDKN1A) expressions were consistent with the ovarian cancer samples in the TCGA database ().
Figure 1. PPI construction and core modules analysis of overlapping DEGs. (a) PPI network are constructed by STRING. (b) Top 4 modules are by STRING and Cytoscape software, containing module 1, module 2, module 3 and module 4. (c) the PPI network of hub genes. (d) the verified results of hub genes in GEPIA database.
Among these screened hub genes, CCNE1 has gradually attracted attention, which was considered to be the key driver gene involved in the tumor transformation of HGSOC [Citation30]. The study by Corine M. Beaufort showed that p53 was considered the key gene in the transformation of ovarian cancer, and the mutations of myc, CCNE1 and TPX2 were also considered conditions for the transformation of ovarian cancer [Citation31].
CCNE1-Regulated signaling pathways in HGSOC
To explore the potential molecular functions of CCNE1, we performed GSEA analysis on the two data sets, obtaining the positively and negatively regulated pathways by CCNE1. The gene sets with the nominal p value <0.05 were considered significantly enriched. The results are shown in Supplementary Figure S1. In GSE69428, the top 4 positive regulatory pathways of CCNE1 were oxidative phosphorylation, cell cycle, DNA replication and base excision repair. The top 4 negative regulatory pathways were graft versus host disease, type 1 diabetes mellitus, allograft rejection and autoimmune thyroid disease. In GSE69429, GSAE showed that CCNE1 positively regulated the pathways of the cell cycle, DNA replication, spliceosome, and RNA degradation. CCNE1 negatively regulated the pathways of histidine metabolism, tyrosine metabolism, ABC transporters and GNRH signaling pathway.
Validation of CCNE1 overexpressed in HGSOC tissues
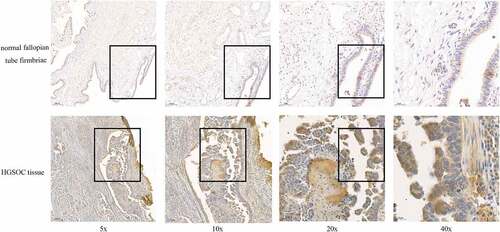
Bioinformatics analysis showed the high expression of CCNE1 in HGSOC tissue, and we further validated it in clinical specimens. Normal fallopian tube tissue samples from prophylactic salpingectomy patients and HGSOC patients were collected for immunohistochemical analysis. The results showed that CCNE1 had higher expression in the HGSOC tissues (), which was consistent with the results of the database analysis, demonstrating that CCNE1 is associated with tumorigenesis in clinic and could be chosen as a potential target to ameliorate the tumor progression. The statistical analysis of the IHC staining data was shown in Supplementary Fig 2.
Figure 2. The CCNE1 expression on normal fallopian tube fimbriae (n = 10) and HGSOC tissue (n = 4). The IHC staining of CCNE1 (brown) in fallopian tube fimbriae and HGSOC tissue. Scale bar: 20 μm (40x).
Metformin exerts cytotoxicity of HGSOC cells mediated by CCNE1
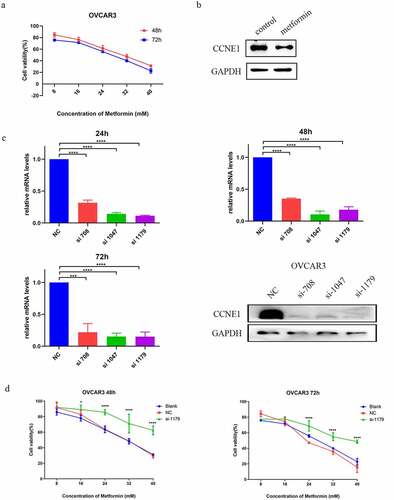
As a cyclin, CCNE1 plays an important role in cell proliferation. Existing studies have shown that Metformin inhibited tumor cell proliferation by inducing cell cycle arrest [Citation32]. Wu et al. have found that Metformin inhibited cell proliferation by downregulating the expression of YAP1 and CCNE1/2 [Citation33]. Therefore, we tested the cytotoxic activity of Metformin on a HGSOC cell line, OVCAR3, with CCNE1 overexpression. We observed a dose-dependent lethality by Metformin at 48 or 72 hours after treatment (). Accordingly, western blot analysis showed that Metformin inhibited the expression of CCNE1 (). To investigate whether expression of CCNE1 is associated with the drug toxicity of Metformin, we knocked down CCNE1 by siRNA and conducted cell viability assay under the same Metformin treatment. shows that all three siRNA (708, 1047, 1179) transfections effectively reduced mRNA and protein of CCNE1. Among them, the most apparent one si-1179-OVCAR3 was chosen for further viability assay. We found a resistance to Metformin in si-1179-OVCAR3 cells 48 and 72 hours after drug administration (). The result suggested that CCNE1 over-expression is responsible for the cytotoxic effect of Metformin in OVCAR3 cells.
Figure 3. CCNE1 associates the cytotoxic effect of Metformin. (a) Viability assay of OVCAR3 cells at 48 and 72h with 8, 16, 24, 32, 40 mM Metformin treatments. (b) Western blot analysis of the CCNE1 expression of OVCAR3 cells after treatment with 0 and 5 mM Metformin at 24 h. (c) qPCR (at 24, 48, and 72 h) and western blot (at 24 h) analysis of CCNE1 expression of OVCAR3 cells treated with three CCNE1 gene-specific si-RNA (708, 1047, 1179) and scramble control (NC). (d) Viability assay of OVCAR3 cells in CCNE1 knockdown group (si-1179), NC group and blank group at 48 and 72h with 8, 16, 24, 32, and 40 mM Metformin treatments.
Metformin abolished the transformation effect of ovulatory follicular fluid (FF) in vitro and in vivo
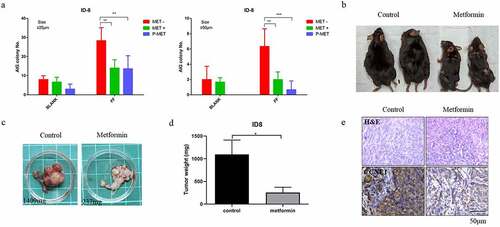
Several large-scale epidemiological studies have indicated that ovulation is the most important risk factor for ovarian cancer [Citation34,Citation35]. Previously, in different in-vitro and in-vivo models, ovulatory follicular fluid (FF) was found to facilitate the transformation and progression of HGSOC derived from the oviduct epithelium [Citation36,Citation37]. Here, we analyzed whether Metformin treatment could abolish this FF-induced malignant transformation. In vitro transformation phenotype of anchor-independent colony growth (AIG) in a mouse ovarian cancer cell line, ID8, was first tested. The results showed that FF enhanced the AIG of ID8 cells in either the small (>25 μm) or large (>50 μm) colonies. Metformin treatments abolished this increase of AIG by FF. In the pretreatment experiment, Metformin further decreased AIG to a level lower than the non-FF treated baseline, suggesting a therapeutic effect (). We confirmed this therapeutic effect in an orthotopic syngeneic mouse tumorigenesis model [Citation38]. We injected 2 × 10⁶ ID8 cells into the ovarian bursa to grow ovarian cancer. Metformin was given through a subcutaneous implantation of a sustained-releasing capsule (ALZET), at a concentration of 35 mg/100 μl. The results showed that mice without Metformin treatment grew overt tumors in the ovary and peritoneal cavity with severe ascites, whereas Metformin-treated group had much milder signs of tumor growth (). The tumor weight of the control vehicle-treated and the Metformin-treated group was 1,096 ± 182.8 mg vs. 254.0 ± 68.37 mg, respectively (p < 0.05, ). IHC stain showed that the tumor tissues of the Metformin-treated mice had lower CCNE1 expression as compared with the control group ().
Figure 4. Metformin inhibition of orthotopic allograft ovarian cancer model. (a) Anchor-independent colony growth (AIG) assay of ID8 cell treated with vehicle or 5 mM Metformin together (green) or before (blue) 5% ovulatory follicular fluid treatment. (b,c) C57BL6/J mice, with or without Metformin drug-delivery pump given, were intra-bursa injected with 2×10⁶ ID8 cells. Mice were then compared the different of the tumor growth at 4 months. The picture shows the gross appearance of the mice (b) and the grown tumor (c). (d) Comparison of tumor weight between control group and Metformin administration group. * P<0.05. (e) H&E staining and IHC staining of CCNE1 expression (brown) on the tumor tissue in the control group and Metformin administration group. Representative images from three independent visions of staining tissue are presented. n=2 of each group. Scale bar 50 μm (20x).
Validation of the therapeutic effect of Metformin on the growth of CCNE1-overexpressing human ovarian cancer cells
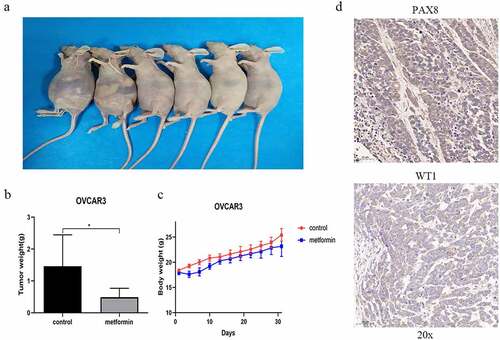
To further validate the efficacy of Metformin in treatment of human ovarian cancer, we conducted xenograft tumorigenicity analysis by intraperitoneally injecting 4 × 10⁶ OVCAR3 cells to 4- 5-week-old nude mice. Metformin (400 mg/kg) or saline was orally administered by gavage every day for 31 days. The results showed that OVCAR3 cells readily form tumors in the peritoneal cavity with apparent ascites (). In contrast, the Metformin-treated mice grew smaller tumors. The tumor weight in the control group and the Metformin-treated group were 1.46 ± 0.4 g vs. 0.49 ± 0.11 g, respectively (p < 0.05, ). Intriguingly, the bodyweight of the Metformin-treated group was slightly lower than that of the control mice (). This may be due to the hypoglycemic effect of Metformin or due to the severity of ascites, which may all vary the bodyweight of the mice. IHC stains confirmed the histology of HGSOC in the xenograft tumors, with positive PAX8 and WT1 expression ().
Figure 5. Metformin ameliorates the tumor growth in the mouse HGSOC xenograft tumor model. (a) Female nude mice were intraperitoneally injected with OVCAR3 cells (4×10⁶ cells per mouse) with Metformin or control vehicle (saline) treatment, and the tumor growth and ascites at 31 days were observed in mice. (b) Comparison of tumor weight between control group and Metformin administration group. * p<0.05 (c) the body weight of mice in the control group and Metformin administration group. (d) the IHC staining of HGSOC biomarkers PAX8 and WT1 on tumor tissue. All images are representative of three independent mice. Scale bar 50 μm (20x).
Molecular modeling showed docking of Metformin with CCNE1
The in vivo and in vitro experiments shown above indicate that CCNE1/Rb dysfunction is essential for the induction of FF in the malignant transformation of fallopian tube epithelial cells, and Metformin has a powerful inhibitory effect. However, it is still unknown how Metformin exerts an anti-tumor effect, and whether it is via inhibition of CCNE1.
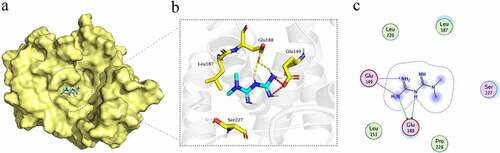
Therefore, we downloaded the X-ray crystal diffraction structure of CCNE1 from RCSB PDB (PDB ID: 5L2W, http://www.rcsb.org/) and obtained the molecular structure of Metformin from Drug Bank (https://www.drugbank.ca/). MOE dock was used to conduct homology modeling and molecular docking simulation on the binding affinity of Metformin and CCNE1 protein. Finally, the visualized docking results were shown through PyMOL. The results showed that Metformin was embedded in the CCNE1 protein and had an interaction with CCNE1 (). There were an electrostatic interaction between Metformin and residue Glu149 of CCNE1 and a hydrogen bond interaction with residue Glu188 (). This suggested that Metformin may not only regulate CCNE1 through the GSK3β/YAP pathway to inhibit tumor [Citation33] but may also be able to directly target CCNE1 to regulate its expression.
Figure 6. The molecular mock docking of Metformin and CCNE1. (a) Overall structural view of CCNE1 with Metformin, wherein Metformin was embedded in CCNE1 protein. (b) Detailed interaction view between CCNE1 and Metformin, wherein electrostatic interaction and hydrogen bonding are shown as red and yellow dashed line, respectively. (c) 2D interaction view between CCNE1 and Metformin, wherein electrostatic interaction and hydrogen bonding interaction are shown as red and green rows, respectively.
Discussion
In the last decades, women’s cancer risk ranking has undergone some changes. With the progress on cancer pathology and the development of HPV vaccines, the incidence of cervical cancer in those gynecological cancers has been decreased [Citation39]. In contrast, the risk of ovarian cancer increases along with the development of civilized society. Non-epithelial ovarian cancer (EOC) is a relatively uncommon malignancy, accounting for only 10–15% of ovarian cancers, and with cure rates approaching 100% for those with early-stage disease, the 1-year survival for those with ovarian small-cell carcinoma is just 50%. Sex cord-stromal cell tumors are generally more indolent with an excellent short-term prognosis, but carry a significant risk of late relapse [Citation40]. Epithelial ovarian cancer (EOC) is one of the most common malignant tumors in women, with high morbidity and mortality rate in recent years. Among these, high-grade serous carcinoma (HGSC) is the most common and deadly type, accounting for more than half of the overall mortality [Citation41]. The etiology of HGSOC is still unclear and the anatomic site of the ovary is deeply in the pelvic cavity, making it challenging to diagnose and prevent [Citation3]. Besides, early symptoms of HGSOC are obscure or often accompanied by misdiagnosed symptoms similar to the gastrointestinal problem, such as abdominal distension, nausea, and urgency [Citation42]. All these unfavorable factors cause HGSOC often diagnosed at an advanced stage with high mortality and recurrence rate and chemotherapy resistance [Citation4]. Therefore, it is urgent to prevent the disease progression with more accurate therapy targeting the carcinogenic factors in ovarian HGSOC.
The origin of HGSOC has been debated for many years. The leading research shows that the fallopian tube epithelium (FTE) rather than the ovarian epithelium is the primary origin of HGSOC [Citation43,Citation44]. Almost all HGSOCs carry the TP53 mutation, and up to 60% of ovarian cancer patients consist of serous tubal intraepithelial carcinomas (STIC) [Citation45]. STICs present 92% with TP53 mutation, which shares a similar missense mutated phenotype with HGSOCs [Citation46–48], providing evidence that links it to the cancer initiation site [Citation49,Citation50]. STIC is characterized as PAX8+ secretory cell lesion that is morphologically atypical and includes cellular depolarization, increased nuclear to cytoplasmic ratios, and increased proliferation activity [Citation45]. These cancerous lesions may eventually spread to the peritoneal cavity without the presence of invasion through intraluminal shedding of malignant surface epithelial cells in the tube and develop into HGSOC [Citation51]. Analysis of The Cancer Genome Atlas (TCGA) shows the genetic profile of HGSOC and reveals essential driver mutations, including TP53, PI3K, RB, and CCNE1. Amplification of CCNE1 and inactivation of RB are thought to be driver mutations essentially associated with cancer development. They have been indicating a distinct alternative cause of genomic instability, which is mutually exclusive with BRCA mutation in serous ovarian cancer [Citation52–54]. Patients with CCNE1-amplified HGSOC are unlikely to benefit from PARP inhibitors compared to patients with BRCA1/2 mutation. In addition, they are less likely to respond to the platinum agent [Citation55], demonstrating further clinical need in the CCNE1 amplification group.
Our study focuses on Metformin in the therapeutic effect of HGSOC. Metformin is the first-line diabetes mellitus drug that has been used for decades [Citation10] and has broad functions and multi-advantages in the clinic. In recent years, more attention was raised in Metformin to cancer prevention and therapy. Yet, many studies have shown that Metformin has anti-tumor activity [Citation12–14]. Much valuable evidence from the epidemiological statistics indicates that Metformin had potential tumor prevention and treatment effects [Citation12,Citation56] and suggests that Metformin could be a helpful adjuvant with benefits seen in many cancers [Citation56]. In addition, basic researches provide evidence that Metformin combined with carboplatin or paclitaxel could increase apoptotic activity in both primary ovarian cancer cells and SKOV-3 cells, implicating a chemo-adjuvant potential [Citation14] . In particular, the epidemiological retrospective analysis by Chin-Hsiao Tseng et al. showed that the use of Metformin was associated with a reduction in the risk of ovarian cancer,and that there was a time and dose dependence [Citation57]. It was observed that Metformin treatment decreased angiogenesis in metastatic tissues, attenuated ovarian cancer-cell adhesion and dampened macrophage infiltration in vivo in murine experiments, suggesting that Metformin is an effective negative regulator of angiogenesis, which may be attributed to the blockade of mTOR signaling pathway [Citation58]. All these indicated the potential application value of Metformin in HGSOC.
Diabetes is thought to be associated with an increased risk of cancer. The association between diabetes and cancers may be linked by the possible mechanism of hyperglycemia and inflammation [Citation59]. Inhibition of gluconeogenesis by Metformin through some glucoregulatory mechanisms has been proposed as the center in cancer prevention [Citation60]. However, observational studies provide dividing evidence that the medication treatments to hyperglycemia are associated with either increased or reduced risk of cancer [Citation60]. This suggests that the action mechanism of Metformin to cancer suppression is complex and diverse. Epidemiological retrospective analysis has shown that the use of Metformin reduces the risk of ovarian cancer and that there was a time-and-dose dependence [Citation57]. Our data also indicated that Metformin could inhibit the development of HGSOC that is mediated by CCNE1. The underlying mechanism of action requires more research studies to clarify.
Conclusions
In conclusion, we analyzed two data sets in GEO (GSE69428 and GSE69429), which contained HGSOC tissue samples and fallopian tube epithelial tissue samples. Through the bioinformatics tools, we obtained 10 hub genes that may be essential in the progression of HGSOC [Citation61,Citation62]. CCNE1 was chosen for further studies among these hub genes based on literature studies and preliminary data from our cell system. We evaluated the CCNE1 high expression in the clinical HGSOC tissue. We found that malignant HGSOC cells with higher CCNE1 expression would be more sensitive to Metformin treatment. Accordingly, molecular modeling suggested that CCNE1 could be a target for Metformin. In summary, we established the system to mine the hub genes with bioinformatic tools, performed the molecular docking of the drug and hub genes, and validated by biological experiments. We identify that CCNE1 is a potential target of Metformin for tumor suppression of HGSOC, whereas more experiments are needed to confirm the mechanism.
Author contributions
JM conceived the structure of the manuscript and revised the manuscript. JM and HT made the figures and table. HT and HH helped revise the article. HH and NW completed a large number of preliminary studies. CT, WZ and JW revised the manuscript. All the authors approved the final manuscript.
Supplemental Material
Download Zip (3.5 MB)Disclosure statement
No potential conflict of interest was reported by the author(s).
Data availability statement
The authors confirm that the data supporting the findings of this study are available within the article.
Supplementary material
Supplemental data for this article can be accessed online at https://doi.org/10.1080/15384101.2022.2109362.
Additional information
Funding
Related Research Data
References
- Siegel RL, Miller KD, Jemal A. Cancer statistics, 2020. CA Cancer J Clin. 2020;70:7–30.
- Webb PM, Jordan SJ. Epidemiology of epithelial ovarian cancer. Best Pract Res Clin Obstet Gynaecol. 2017;41:3–14.
- Franier B, Thompson M. Early stage detection and screening of ovarian cancer: a research opportunity and significant challenge for biosensor technology. Biosens Bioelectron. 2019;135:71–81.
- Norouzi-Barough L, Sarookhani MR, Sharifi M, et al. Molecular mechanisms of drug resistance in ovarian cancer. J Cell Physiol. 2018;233:4546–4562.
- Lisio MA, Fu L, Goyeneche A, et al. High-Grade serous ovarian cancer: basic sciences, clinical and therapeutic standpoints. Int J Mol Sci. 2019;20. DOI:10.3390/ijms20040952
- Baldwin LA, Huang B, Miller RW, et al. Ten-Year relative survival for epithelial ovarian cancer. Obstet Gynecol. 2012;120:612–618.
- Lheureux S, Gourley C, Vergote I, et al. Epithelial ovarian cancer. Lancet. 2019;393:1240–1253.
- Hennessy BT, Coleman RL, Markman M. Ovarian cancer. Lancet. 2009;374:1371–1382.
- Boussios S, Karihtala P, Moschetta M, et al. Veliparib in ovarian cancer: A new synthetically lethal therapeutic approach. Invest New Drugs. 2020;38:181–193.
- Nathan DM, Buse JB, Davidson MB, et al. Medical management of hyperglycemia in type 2 diabetes: a consensus algorithm for the initiation and adjustment of therapy: A consensus statement of the American Diabetes Association and the European Association for the study of diabetes. Diabetes Care. 2009;32:193–203.
- Rodbard HW, Jellinger PS, Comment on: Inzucchi. et al. Management of hyperglycemia in type 2 diabetes: A patient-centered approach. Position statement of the American Diabetes Association (ADA) and the European Association for the Study of Diabetes (EASD). Diabetes Care. 2012;35:1364–1379. Diabetes Care. 2012;35:e70, e72-3. DOI:10.2337/dc12-0413
- Morales DR, Morris AD. Metformin in cancer treatment and prevention. Annu Rev Med. 2015;66:17–29.
- Wu D, Hu D, Chen H, et al. Glucose-Regulated phosphorylation of TET2 by AMPK reveals a pathway linking diabetes to cancer. Nature. 2018;559:637–641.
- Patel S, Kumar L, Singh N. Metformin and epithelial ovarian cancer therapeutics. Cell Oncol (Dordr). 2015;38:365–375.
- Zakikhani M, Dowling R, Fantus IG, et al. Metformin is an AMP kinase-dependent growth inhibitor for breast cancer cells. Cancer Res. 2006;66:10269–10273.
- Zhou G, Myers R, Li Y, et al. Role of AMP-activated protein kinase in mechanism of metformin action. J Clin Invest. 2001;108:1167–1174.
- Lee J, Yesilkanal AE, Wynne JP, et al. Effective breast cancer combination therapy targeting BACH1 and mitochondrial metabolism. Nature. 2019;568:254–258.
- Al HM, Fakhoury I, El MZ, et al. Metformin treatment inhibits motility and invasion of glioblastoma cancer cells. Anal Cell Pathol (Amst). 2018;2018:5917470.
- Ma L, Wei J, Wan J, et al. Low glucose and metformin-induced apoptosis of human ovarian cancer cells is connected to ASK1 via mitochondrial and endoplasmic reticulum stress-associated pathways. J Exp Clin Cancer Res. 2019;38:77.
- Karst AM, Jones PM, Vena N, et al. Cyclin E1 deregulation occurs early in secretory cell transformation to promote formation of fallopian tube-derived high-grade serous ovarian cancers. Cancer Res. 2014;74:1141–1152.
- Nakayama N, Nakayama K, Shamima Y, et al. Gene amplification CCNE1 is related to poor survival and potential therapeutic target in ovarian cancer. Cancer-Am Cancer Soc. 2010;116:2621–2634.
- Etemadmoghadam D, George J, Cowin PA, et al. Amplicon-Dependent CCNE1 expression is critical for clonogenic survival after cisplatin treatment and is correlated with 20q11 gain in ovarian cancer. PLoS One. 2010;5:e15498.
- Davidson B, Skrede M, Silins I, et al. Low-Molecular weight forms of cyclin E differentiate ovarian carcinoma from cells of mesothelial origin and are associated with poor survival in ovarian carcinoma. Cancer-Am Cancer Soc. 2007;110:1264–1271.
- Farley J, Smith LM, Darcy KM, et al. Cyclin E expression is a significant predictor of survival in advanced, suboptimally debulked ovarian epithelial cancers: a gynecologic oncology group study. Cancer Res. 2003;63:1235–1241.
- Etemadmoghadam D, DeFazio A, Beroukhim R, et al. Integrated genome-wide DNA copy number and expression analysis identifies distinct mechanisms of primary chemoresistance in ovarian carcinomas. Clin Cancer Res. 2009;15:1417–1427.
- Spruck CH, Won KA, Reed SI. Deregulated cyclin E induces chromosome instability. Nature. 1999;401:297–300.
- Minella AC, Swanger J, Bryant E, et al. P53 and p21 form an inducible barrier that protects cells against cyclin E-cdk2 deregulation. Curr Biol. 2002;12:1817–1827.
- Yamamoto Y, Ning G, Howitt BE, et al. In vitro and in vivo correlates of physiological and neoplastic human Fallopian tube stem cells. J Pathol. 2016;238:519–530.
- Powers RK, Goodspeed A, Pielke-Lombardo H, et al. GSEA-InContext: identifying novel and common patterns in expression experiments. Bioinformatics. 2018;34:i555–64.
- Cancer Genome Atlas Research Network. Integrated genomic analyses of ovarian carcinoma. Nature. 2011;474:609–615. DOI:10.1038/nature10166
- Beaufort CM, Helmijr JC, Piskorz AM, et al. Ovarian cancer cell line panel (OCCP): clinical importance of in vitro morphological subtypes. PLoS One. 2014;9:e103988.
- Li B, Zhou P, Xu K, et al. Metformin induces cell cycle arrest, apoptosis and autophagy through ROS/JNK signaling pathway in human osteosarcoma. Int J Biol Sci. 2020;16:74–84.
- Wu Y, Zheng Q, Li Y, et al. Metformin targets a YAP1-TEAD4 complex via AMPKα to regulate CCNE1/2 in bladder cancer cells. J Exp Clin Cancer Res. 2019;38:376.
- Wu NY, Fang C, Huang HS, et al. Natural history of ovarian high-grade serous carcinoma from time effects of ovulation inhibition and progesterone clearance of p53-defective lesions. Mod Pathol. 2020;33:29–37.
- Hsu CF, Huang HS, Chen PC, et al. IGF-Axis confers transformation and regeneration of fallopian tube fimbria epithelium upon ovulation. EBioMedicine. 2019;41:597–609.
- Huang HS, Chu SC, Hsu CF, et al. Mutagenic, surviving and tumorigenic effects of follicular fluid in the context of p53 loss: Initiation of fimbria carcinogenesis. Carcinogenesis. 2015;36:1419–1428.
- Hsu CF, Chen PC, Seenan V, et al. Ovulatory follicular fluid facilitates the full transformation process for the development of high-grade serous carcinoma. Cancers (Basel). 2021;13. DOI:10.3390/cancers13030468
- Roby KF, Taylor CC, Sweetwood JP, et al. Development of a syngeneic mouse model for events related to ovarian cancer. Carcinogenesis. 2000;21:585–591.
- Cohen PA, Jhingran A, Oaknin A, et al. Cervical cancer. Lancet. 2019;393:169–182.
- Boussios S, Zarkavelis G, Seraj E, et al. Non-Epithelial ovarian cancer: elucidating uncommon gynaecological malignancies. Anticancer Res. 2016;36:5031–5042.
- Coburn SB, Bray F, Sherman ME, et al. International patterns and trends in ovarian cancer incidence, overall and by histologic subtype. Int J Cancer. 2017;140:2451–2460.
- Smith LH, Morris CR, Yasmeen S, et al. Ovarian cancer: Can we make the clinical diagnosis earlier? Cancer-Am Cancer Soc. 2005;104:1398–1407.
- Zhang S, Dolgalev I, Zhang T, et al. Both fallopian tube and ovarian surface epithelium are cells-of-origin for high-grade serous ovarian carcinoma. Nat Commun. 2019;10:5367.
- Karnezis AN, Cho KR, Gilks CB, et al. The disparate origins of ovarian cancers: pathogenesis and prevention strategies. Nat Rev Cancer. 2017;17:65–74.
- Bachert SE, McDowell AJ, Piecoro D, et al. Serous tubal intraepithelial carcinoma: a concise review for the practicing pathologist and clinician. Diagnostics (Basel). 2020;10. DOI:10.3390/diagnostics10020102
- Kindelberger DW, Lee Y, Miron A, et al. Intraepithelial carcinoma of the fimbria and pelvic serous carcinoma: evidence for a causal relationship. Am J Surg Pathol. 2007;31:161–169.
- McDaniel AS, Stall JN, Hovelson DH, et al. Next-Generation sequencing of tubal intraepithelial carcinomas. JAMA Oncol. 2015;1:1128–1132.
- Ahmed AA, Etemadmoghadam D, Temple J, et al. Driver mutations in TP53 are ubiquitous in high grade serous carcinoma of the ovary. J Pathol. 2010;221:49–56.
- Lee Y, Miron A, Drapkin R, et al. A candidate precursor to serous carcinoma that originates in the distal fallopian tube. J Pathol. 2007;211:26–35.
- Carcangiu ML, Radice P, Manoukian S, et al. Atypical epithelial proliferation in fallopian tubes in prophylactic salpingo-oophorectomy specimens from BRCA1 and BRCA2 germline mutation carriers. Int J Gynecol Pathol. 2004;23:35–40.
- Bijron JG, Seldenrijk CA, Zweemer RP, et al. Fallopian tube intraluminal tumor spread from noninvasive precursor lesions: a novel metastatic route in early pelvic carcinogenesis. Am J Surg Pathol. 2013;37:1123–1130.
- Hossain M, Stillman B. Opposing roles for DNA replication initiator proteins ORC1 and CDC6 in control of Cyclin E gene transcription. Elife. 2016;5. DOI:10.7554/eLife.12785
- Ciriello G, Cerami E, Sander C, et al. Mutual exclusivity analysis identifies oncogenic network modules. Genome Res. 2012;22:398–406.
- Eckert MA, Pan S, Hernandez KM, et al. Genomics of ovarian cancer progression reveals diverse metastatic trajectories including intraepithelial metastasis to the fallopian tube. Cancer Discov. 2016;6:1342–1351.
- Au-Yeung G, Lang F, Azar WJ, et al. Selective targeting of cyclin e1-amplified high-grade serous ovarian cancer by Cyclin-Dependent Kinase 2 and AKT Inhibition. Clin Cancer Res. 2017;23:1862–1874.
- Coyle C, Cafferty FH, Vale C, et al. Metformin as an adjuvant treatment for cancer: a systematic review and meta-analysis. Ann Oncol. 2016;27:2184–2195.
- Tseng CH. Metformin reduces ovarian cancer risk in Taiwanese women with type 2 diabetes mellitus. Diabetes Metab Res Rev. 2015;31:619–626.
- Urpilainen E, Puistola U, Boussios S, et al. Metformin and ovarian cancer: the evidence. Ann Transl Med. 2020;8:1711.
- Giovannucci E, Harlan DM, Archer MC, et al. Diabetes and cancer: a consensus report. Diabetes Care. 2010;33:1674–1685.
- Foretz M, Guigas B, Viollet B. Understanding the glucoregulatory mechanisms of metformin in type 2 diabetes mellitus. Nat Rev Endocrinol. 2019;15:569–589.
- Sherr CJ, McCormick F. The RB and p53 pathways in cancer. Cancer Cell. 2002;2:103–112.
- Cordon-Cardo C. P53 and RB: simple interesting correlates or tumor markers of critical predictive nature? J Clin Oncol. 2004;22:975–977.