
ABSTRACT
Acute myeloid leukemia (AML) is the second most common hematological malignancy after lymphoma in the world. Long non-coding RNAs (LncRNAs) have been suggested as key regulators of cancer development and progression in AML. As a member of lncRNA family, the biological role and mechanisms of tyrosine kinase non receptor 2 antisense RNA 1 (TNK2-AS1) in AML is still unclear. The expression of TNK2-AS1 was measured with RT-qPCR in AML cell lines. The changes of the proliferation, apoptosis, and differentiation in TNK2-AS1 shRNA-transfected HL-60 and THP-1 cells were detected with CCK-8, EdU, flow cytometry, Western blot, and NBT assays. Molecular control of TNK2-AS1 on CUGBP Elav-like family member 2 (CELF2) and ETS domain-containing protein-1 (ELK1) on TNK2-AS1 was assessed by chromatin immunoprecipitation (ChIP), RT-qPCR, Western blot, and RNA immunoprecipitation (RIP) assays. TNK2-AS1 expression was upregulated in AML cell lines and negatively correlated with survival patients. Knockdown of TNK2-AS1 markedly reduced AML cell proliferation and promoted apoptosis and differentiation. Likewise, TNK2-AS1 knockdown significantly suppressed tumor growth in vivo. Mechanistically, the upregulation of TNK2-AS1 was activated by transcription factor ELK1. We also uncovered that TNK2-AS1 exerted tumor-promoting effect through silencing CELF2 via binding with EZH2, thus activating PI3K/Akt pathway in AML cells. Elevated expression of TNK2-AS1 was induced by ELK1 and facilitated AML progression by suppressing CELF2 expression via EZH2-mediated epigenetic silencing, suggesting TNK2-AS1 may be a promising therapeutic target and prognostic marker for AML patients.
Introduction
Acute myeloid leukemia (AML), the most common and severe form of acute leukemia in adults, is responsible for the highest mortality from leukemia in general [Citation1]. AML is characterized by impaired interference and apoptosis, uncontrolled malignant proliferation, and blocked differentiation in leukemic cells [Citation2]. Among all kinds of hematological malignancies, AML is the most difficult to treat, and the 5-year survival rate is only 25% [Citation3,Citation4]. Though chemotherapeutic agents, molecular targeted drugs, and hematopoietic stem cell transplantation have shown therapeutic efficacy in AML, but the prognosis of many patients is still very poor [Citation1,Citation5]. Therefore, an in-depth knowledge of the molecular mechanism of the malignant biological behaviors of AML may provide novel and effective therapy of AML.
Long non-coding RNAs (LncRNAs) are defined as a class of RNA molecules with length over 200 nucleotides. LncRNAs participate in diverse cancers, such as non-small cell lung cancer, cervical cancer, and AML [Citation6]. Growing evidence has demonstrated that lncRNAs can function as oncogenes or tumor suppressors to affect various biological processes including epigenetic regulation, transcriptional regulation and post-transcriptional regulation. Moreover, dysregulation of lncRNAs have been identified to involve in multiple cellular processes such as metastasis, differentiation, and apoptosis [Citation7,Citation8]. For example, lncRNA HOXA-AS2 acts as an oncogene in AML by interacting with EZH2 to inhibiting LATS2 expression [Citation9]. LINC00963 acts as a ceRNA for miR-608 to regulate the expression of MMP-15, thus facilitating AML development [Citation10]. LncRNA CCAT1 is highly expressed in AML and could suppress cell differentiation and promote cell growth by regulating miR-155 [Citation11]. These findings suggest that lncRNAs play an important role in the pathogenesis of AML and potential novel biomarkers for AML diagnosis and therapy.
LncRNA TNK2-AS1 (TNK2-AS1) was initially found to be upregulated in non-small cell lung cancer (NSCLC) tissues [Citation12]. Cai et al. uncovered that TNK2-AS1 promoted proliferation and migration of human aortic smooth muscle cells (HASMCs) through regulating VEGFA and FGF1 by sponging miR-150-5p [Citation13]. In osteosarcoma (OS), TNK2-AS1 knockdown suppressed WDR1 expression through competitively binding miR-4319, inhibiting OS cell proliferation, invasion, and inducing apoptosis [Citation14]. However, the expression and role of TNK2-AS1 in AML have not been characterized. In the current study, the expression of TNK2-AS1 was first verified and we revealed that TNK2-AS1 was powerfully expressed in AML cells. Unsurprisingly, TNK2-AS1 knockdown suppressed AML cell proliferation, induced apoptosis, and differentiation. More importantly, we found that ELK1 directly activated TNK2-AS1 transcription, and TNK2-AS1 could bind to EZH2 to downregulate CELF2 expression and activate the PI3K/Akt signaling pathway in AML.
Materials and methods
Human samples
Bone marrow samples were obtained from AML patients (n = 20; median age 47 years; range 18–59 years; 13 females, 7 males) and normal volunteers (n = 10; median age 49 years; range 43–64 years; 4 females, 6 males) were obtained from Zhumadian Central Hospital. Subjects with chronic diseases or any other type of malignancy were excluded from the experimental and control groups. Prior to participation, the patients had received no chemotherapy or radiotherapy. All subjects provided written informed consent for the use of their samples in this study. This study protocol was approved by the Ethics Committees of the participating hospitals and the Institutional review Board of Zhumadian Central Hospital.
CD34+cell isolation
Bone marrow mononuclear cells (BMNCs) were separated from bone marrow samples of AML patients and healthy volunteers. The bone marrow samples were diluted with PBS in the same volume, and the diluted bone marrow was spread to the upper part of the separation liquid. After centrifugation, the buffy coat containing the mononuclear cells was collected. For CD34+ cell sorting, the mononuclear cells were then diluted with PBS and stained with trypan blue to count and the cell density was adjusted to 1 × 10⁶ cells/mL. After centrifugation, the cells were collected and incubated with Anti-Human CD34 PE staining buffer (5 μL) at 4 in the dark for 10 min. The cells were collected after centrifugation and resuspended with a staining buffer (500 μL), followed by flow cytometry for CD34+ cell sorting. As previously described, recombinant human TPO (hTPO) (10 ng/ml, Sino Biological Inc., Beijing, China) was used to induce CD34+ cell proliferation.
Cell culture
AML cell lines ((HEL, NB4, HL-60, and THP-1) were purchased from the Cell Bank of the Chinese Academy of Sciences (Shanghai, China). All cells were cultured in RPMI-1640 medium (Invitrogen) containing 10% fetal bovine serum (FBS). Besides, CD34+ cells sorted from bone marrow aspirates of three healthy volunteers were applied as controls to these AML cell lines. All cells were incubated in a humidified atmosphere containing 5% CO2 at 37°C.
Cell transfection
To overexpress the expression of TNK2-AS1, the full sequence of TNK2-AS1 was introduced into the pcDNA3.1 vector (Invitrogen, Carlsbad, CA, USA) to generate pcDNA-TNK2-AS1 constructs. Likewise, to silence the expression of TNK2-AS1, ELK1, EZH2 and CELF2, shRNAs specifically targeting them were synthesized and obtained from Genepharma (Shanghai, China). The above negative controls (vector and sh-NC) were also synthesized by Genepharma (Shanghai, China). Lipofectamine 2000 from Invitrogen was utilized to transfect above in cells.
Quantitative real-time PCR (RT-qPCR)
Total RNAs were extracted by using Trizol (Invirtogen, Carlsbad, CA, USA). The cDNA was synthesized from total RNA by using Prime Script RT reagent (TaKaRa, Tokyo, Japan). Quantitative real time-PCR (RT-qPCR) was performed with SYBR Taq by using an Agilent Bioanalyzer 2100 (Agilent Technologies, Santa Clara, CA, US). Briefly, reactions were incubated at 95°C for 10 s for an initial denaturation, followed by 40 cycles at 95°C for 15 s and then 60°C for 1 min. All reactions were run in triplicate, and the relative expression of mRNA or miRNA was calculated using the 2−ΔΔCT method. Human U6 as an endogenous control. The relative gene expression was normalized to glyceraldehyde 3-phosphate dehydrogenase (GAPDH).
Cell counting Kit-8 (CCK-8)
HL-60 and THP-1 cells were seeded onto 6-well plates with six replicate wells and then transfected with TNK2-AS1 shRNA, CELF2 shRNA or sh-NC. After 48 h transfection, HL-60 and THP-1 cells were plated into 96-well plates and incubated for 12 h in a humidified incubator containing 5% CO2 at 37°C for 24, 48, 72, and 96 h. Then, HL-60 and THP-1 cells were treated with CCK-8 solution (Invitrogen) for 4 h. The absorbance was determined at the wavelength of 450 nm by using microplate reader (Molecular devices, Shanghai, China).
EdU assays
After transfection for 24 h, cell media was replaced with fresh media supplemented with 50 μm EdU reagent for 2 h followed by fixation with 4% phosphate-buffered paraformaldehyde. Then the cells were stained with 100 μL of AdoLo and Hoechst 33,342, respectively. The number of EdU-positive cells was analyzed by fluorescence microscopy (Olympus B×51). The EdU-positive ratio was calculated as the ratio of the number of EdU-positive cells to the total Hoechst 33,342-labeled cells (blue cells).
Flow cytometry analysis
HL-60 and THP-1 cells after transfected were cultured for 48 h, and then digested with trypsin. After centrifugation, cells were harvested and re-suspended with binding buffer. Then, cells were stained with Annexin V-fluorescein isothiocyanate (V-FITC) and Propidium iodide (PI) for 15 min in dark. Fluorescence signals were analyzed directly by flow cytometry using the Cell Quest program (Becton Dickinson, Franklin, NJ).
Nitroblue tetrazolium (NBT) assay
The transfected cells were inoculated in a six-well plate and were collected. A 10 μl aliquot of NBT solution composed of 10 mg/ml NBT (Sigma-Aldrich) and 2 μg/ml PMA (Sigma-Aldrich), was added to each well, and then cells were incubated for 30 min at 37°C. Then, light microscopy was used for analysis. The positive cells ratio was analyzed by light microscopy.
Western blot analysis
Cells were collected and lysed with RIPA lysis buffer (Beyotime, Shanghai, China) for the Western blot analysis. Proteins in the lysates (20 μg per lane) were separated by 10% sodium dodecyl sulfate – polyacrylamide gel electrophoresis (SDS-PAGE) and transferred onto polyvinylidene fluoride (PVDF) membranes. After blocking with 5% nonfat milk, the membranes were incubated with primary antibodies against EZH2 (1:1000, ab191250, Abcam), CELF2 (1:1000, ab186430, Abcam), ELK1 (1:1000, ab32106, Abcam), CD11b (1:1000, ab13357, Abcam) and CD14 (1:1000, ab182032, Abcam) overnight at room temperature, and then incubated with horseradish peroxidase (HRP)-labeled goat anti-mouse secondary antibody at room temperature for 2 h. The protein bands were visualized using the enhanced chemiluminescence reagents (Millipore, MA, USA). The expression of relative protein was obtained by the gray value ratio of the target protein to the internal reference GAPDH.
Immunofluorescence
HL-60 cells were grown on glass coverslips to a confluence of 30–50%. Then, they were transfected with sh-TNK2-AS1 for 48 h, washed twice with PBS, and fixed for 10 min in 4% paraformaldehyde. Cells were permeabilized in 0.5% Triton X-100, washed, and blocked for 2 h in 5% normal serum. After blocking, the cells were incubated with anti-ELK1 (1:500), anti-EZH2 (1:500), anti-CELF2 (1:500) and anti-GAPDH (1:500) for 24 h at 4 °C, washed with PBS and incubated with fluorescently labeled secondary antibody (1:500) and DAPI (5 μg/mL) for 2 h at room temperature. Finally, coverslips were washed and mounted with Vectashield (Solarbio). Immunofluorescence staining was imaged using a fluorescence microscope (Olympus). Five representative fields were captured at × 200 magnification, and the numbers of cells expressing target proteins in the cytoplasm and the nucleus (overlapping with DAPI) cells were counted.
Chromatin immunoprecipitation (ChIP)
ChIP assay was performed with the EZ-ChIP Kit (Millipore). Formaldehyde was used to incubate with cells to produce DNA-protein crosslinks. Cross-linked chromatin was sonicated into 200 to 500-base pairs fragments and then the cell lysates were separately incubated with antibodies against ELK1, EZH2 and H3K27me3 (Millipore). The precipitated chromatin DNA were determined by RT-qPCR.
RNA immunoprecipitation (RIP)
RIP assay was performed in HL-60 cells by using a Magna RIP RNA-Binding Protein Immunoprecipitation kit (Millipore, Billerica, MA, USA). The negative control, normal IgG and antibodies against EZH2 were bond with magnetic beads and cultured with the cell lysates in RIP buffer. The co-precipitated RNAs were detected and quantified by RT-qPCR assay.
Luciferase reporter assay
Lipofectamine 2000 was employed to co-transfect HEK-293T cells with the luciferase report vectors, containing promoter serial truncations of TNK2-AS1 wild-type and mutant, and pcDNA3.1 empty vector or ELK1 overexpression vector (pcDNA-ELK1). After HEK-293T cells transfection of 24 h, the luciferase activity was detected based on the manufacturer’s instructions with the Luciferase Assay Reporter System (Promega, Madison, WI, USA).
Fluorescence in situ hybridization analysis (FISH)
RNA FISH probes were synthesized by Rochen Pharma (Shanghai, China). Briefly, HL-60 and THP-1 cells were fixed in 4% formaldehyde for 15 min, washed with PBS, treated with pepsin, and dehydrated through graded ethanol. After the cells were air-dried, they were incubated with 40 nM FISH probe in hybridization buffer for 2 min at 80°C, followed by hybridization at 55°C for 2 h. Subsequently, the slides were washed with 0.1×SSC and dehydrated with graded ethanol. Then, the slides were mounted with Prolong Gold Antifade Reagent with DAPI, and a fluorescence microscope (DMI4000B, Leica) was used to observe the images.
Tumor xenografts
All animal care and experiments were carried out in accordance with the guidance of the National Institutes of Health and approved by the Ethics Committee of Zhumadian Central Hospital. We selected 4-week-old NCG mice with severe immunodeficiency for tumor xenotransplantation experiments to study the effect of TNK2-AS1 on tumor proliferation and differentiation. In tumor growth assay in vivo, THP-1 cells stably transfected with TNK2-AS1 sh-RNA (LV-sh-TNK2-AS1) and respective negative control (LV-sh-NC) were subcutaneously injected into the upper back of the nude mice (1 × 10⁷, 200 μL). Tumor length and width were recorded weekly to calculate the tumor volume according to the formula: volume=length × width2/2. After 5 weeks, the tumor was removed for weight measurement, RT-qPCR and WB analysis.
For systemic in vivo leukemia model, NCG mice were randomly divided in three groups and xenograft leukemia in mice was established by injecting 5 × 10⁶ LV-sh-NC or LV-sh-TNK2-AS1 transduced THP-1 cells in 150 μL of phosphate-buffered saline (PBS) or PBS alone into the tail vein. Three weeks after inoculation, xenografted mice were euthanized for analysis.
CD45+cell staining and analysis by flow cytometry
Bone marrow cells from two femurs were collected and lysed in 2 mL 1× red-blood-cell lysis buffer (BD Biosciences) at room temperature for 2 min, followed by centrifugation at 1000 rpm for 5 min. Supernatants were decanted and discarded. Pellets were washed twice with PBS, followed by dark incubation with live/dead antibody (eBioscience, San Diego, CA, USA) for 15 min. Cells were then washed with PBS and incubated with CD45-APC antibody diluted in Magnetic-Activated Cell Sorting (MACS®) buffer (Miltenyi Biotec, Auburn, CA, USA) at 1:5 for 30 min on ice. The buffer consisted of PBS (pH 7.2), 0.5% bovine serum albumin, and 2 mM EDTA diluted in MACS® bovine serum albumin stock solution with autoMACS® rinsing solution. After incubation, cells were washed with PBS and processed for flow cytometry analysis on the Attune NxT Flow Cytometer. Data were analyzed using FlowJo software and reported as percentages of CD45+ cells within live cells.
Statistical analysis
All statistical computations were performed by using statistical product and service solutions (SPSS) 23 software (SPSS Inc., Chicago, IL, USA). Data were expressed as mean ± standard deviation. Student’s t-test was used to analyze the differential expression. P < 0.05 suggested that the difference was statistically significant.
Results
TNK2-AS1 levels were increased in AML
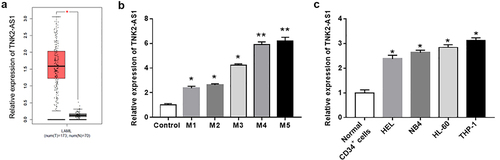
In order to investigate the biological role of TNK2-AS1 in AML development, we first performed GEPIA database to assess the expression of TNK2-AS1 in AML patients. The results showed that the expression of TNK2-AS1 was remarkably upregulated in AML patients (n = 173) compared with healthy human individuals (n = 70) (). Next, we detected the expression of TNK2-AS1 in AML patients with different subtypes, and found that TNK2-AS1 expression was significantly upregulated in the blood of AML patients, especially in AML patients with M4 and M5 subtypes (). To further confirmed the results of above analysis, we examined the expression of TNK2-AS1 in AML cell lines by RT-qPCR. As expected, the results showed that TNK2-AS1 was highly expressed in leukemia cell lines (HEL, NB4, HL-60 and THP-1) compared with normal CD34+ monocytes (). Taken together, these results revealed that TNK2-AS1 may play an oncogene role in AML.
Figure 1. Relative expression of TNK2-AS1 in AML tissues and cell lines. (a) Box plots for TNK2-AS1 gene expression in AML and normal tissues from GEPIA. (b) Correlation between TNK2-AS1 expression and overall survival were detected in GEPIA. (c) the expression of TNK22-AS1 were determined in AML cell lines (HEL, NB4, HL-60 and THP-1) and normal HS-5 cells. *P < 0.05 vs HS-5 cells or control group.
Knockdown of TNK2-AS1 inhibited proliferation, induced differentiation, and apoptosis of AML cells
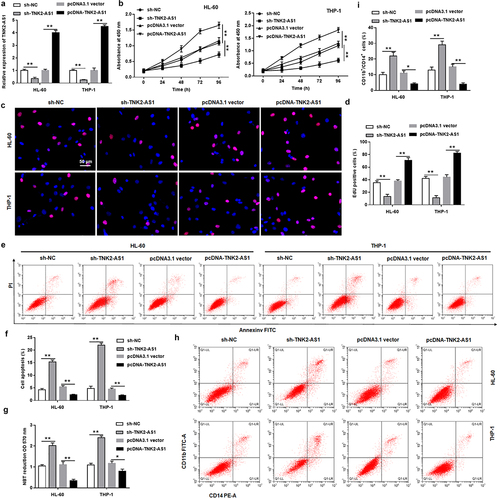
To further explore whether TNK2-AS1 exerted oncogenic function in AML, we transfected TNK2-AS1 shRNA and overexpression vector (pcDNA-TNK2-AS1) or its negative control (sh-NC, pcDNA3.1 vector) into normal CD34+ monocytes, AML CD34+ monocytes, and HL-60 and THP-1 cells. The results showed that TNK2-AS1 expression was significantly inhibited by TNK2-AS1 shRNA, and TNK2-AS1 overexpression vector promoted TNK2-AS1 expression (Supplementary Figure S1a, Supplementary Figure S2a and ). Moreover, we observed that overexpression of TNK2-AS1 promoted the proliferation of AML CD34+ monocytes, but had no effect on the viability of normal CD34+ monocytes (Supplementary Figure S1b and Supplementary Figure S2b). Furthermore, we also found that silencing TNK2-AS1 induced cell apoptosis and increased the number of CD11b and CD14 positive cells, and promoted cell differentiation in AML CD34+ monocytes, overexpression of TNK2-AS1 inhibited cell apoptosis, decreased the positive cells of CD11b and CD14 and reduced cell differentiation (Supplementary Figure S2c–S2e). Subsequently, we analyzed the effect of overexpressing TNK2-AS1 or silencing TNK2-AS1 on HL-60 and THP-1 cells. The results revealed that silencing of TNK2-AS1 suppressed proliferation of both HL-60 and THP-1 cells (). EdU assay showed that cell proliferation was notably decreased in TNK2-AS1-depleted HL-60 and THP-1 cells than that in control (. Moreover, flow cytometry assay indicated that knockdown of TNK2-AS1 induced an increase in the percentage of apoptotic of HL-60 and THP-1 cells (. We then detected the expression of classic differentiation markers of leukemia in HL-60 and THP-1 cells after TNK2-AS1 knockdown. The results showed that the positive cells of CD11b and CD14 were increased in sh-TNK2-AS1 transfected group compared to sh-NC group (. However, overexpressing of TNK2-AS1 played an opposite role. Subsequently, nitroblue tetrazolium (NBT) reduction showed that TNK2-AS1 knockdown remarkably induced AML cell differentiation compared with the sh-NC group ().
Figure 2. Knockdown of TNK2-AS1 inhibited AML cell growth and promoted differentiation. HL-60 and THP-1 cells were transfected with sh-NC and sh-TNK2-AS1. (a) the transfection efficiency was detected by RT-qPCR. (b-d) Cell proliferation of HL-60 and THP-1 cells was measured by CCK-8 and EdU assays. (e and f) Cell apoptosis of HL-60 and THP-1 cells was evaluated with flow cytometry. (g) the differentiation ability of HL-60 and THP-1 cells was detected by evaluating NBT reduction ability. (h and i) the number of CD11b and CD14 positive cells in HL-60 and THP-1 cells were assessed by flow cytometry assays. *P < 0.05 vs control group.
TNK2-AS1 was upregulated by the transcription factor ELK1 in AML cells
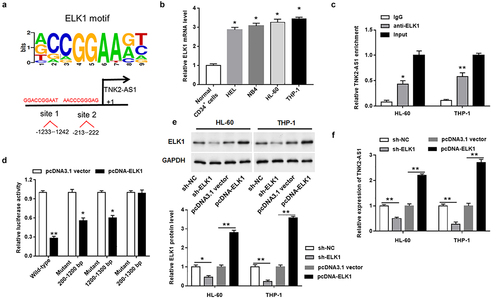
It was spot from online database JASPAR that the potential binding sites for ELK1 in the promoter region of TNK2-AS1 were found, suggesting that ELK1 may be a transcription factor for TNK2-AS1 (). Then, we found that ELK1 was upregulated in AML cell lines (). To confirm the relationship between them, RIP assay was conducted and revealed that ELK1 could directly bind to the promoter region of TNK2-AS1 in HL-60 and THP-1 cells (). Afterward, luciferase reporter vectors containing the wild-type and mutant of TNK2-AS1 promoter were constructed and transfected into HEK-293T cells. The results showed that overexpression of ELK1 decreased the luciferase activity of luciferase reporter vectors containing single mutation sites, and markedly decreased that of a luciferase reporter vector containing the wild-type sequence of TNK2-AS1 promoter, whereas had no effect on the luciferase vector containing the double mutant sites (). In addition, to further identify the interaction between TNK2-AS1 and ELK1, we transfected ELK1 overexpression plasmid and shRNA into HL-60 and THP-1 cells. The results showed that the expression of ELK1 protein was elevated in ELK1 overexpressed group and declined in ELK1 knockdown group (). In contrast, the expression of TNK2-AS1 was significantly reduced by ELK1 overexpression and remarkably elevated by ELK1 knockdown in HL-60 and THP-1 cells ().
Figure 3. TNK2-AS1 expression was increased by the transcription factor ELK1 in AML cells. (a) the binding sites of ELK1 to TNK2-AS1 promoter was obtained from JASPAR. (b) the expression of ELK1 was determined in AML cell lines (HEL, NB4, HL-60 and THP-1) and normal HS-5 cells. (c) ChIP assay was performed in HL-60 and THP-1 cells to confirmed the binding of ELK1 to the promoter region of TNK2-AS1. (d) Luciferase reporter assay was utilized to measure the luciferase activity of three serial truncations in HEK-293 T cell. (e and f) the regulation of ELK1 on the expression of ELK1 protein and TNK2-AS1 was demonstrated. *P < 0.05 vs HS-5 cells or lgG group or control group.
TNK2-AS1 interacted with EZH2 to suppress CELF2 expression
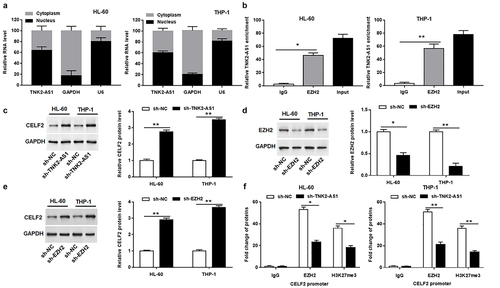
To investigate the potential mechanism for TNK2-AS1 in AML, we first assessed the distribution of TNK2-AS1 in HL-60 and THP-1 cells and uncovered that TNK2-AS1 expression was mainly located in the nucleus ( and Supplementary Figure S3), implying that TNK2-AS1 may be involved in transcriptional regulation. To investigate whether TNK2-AS1 was physically associated with EZH2 that regulated target genes at transcriptional level in the nucleus, we carried out a RIP assay. The results revealed that there is a strong physical interaction between TNK2-AS1 and EZH2 (). EZH2 is a histone methylation regulator mainly distributed in the nucleus, which can target a variety of tumor suppressor genes to promote tumor development, including CELF2. Both EZH2 and CELF2 were found to be localized in the nucleus by protein localization analysis (Supplementary Figure S3). We further uncovered that silencing of TNK2-AS1 significantly elevated the protein level of CELF2 in HL-60 and THP-1 cells (). Likewise, knockdown of EZH2 remarkably repressed the protein level of EZH2 (), whereas markedly increased the protein level of CELF2 in HL-60 and THP-1 cells (). Moreover, ChIP assay was used to explore whether TNK2-AS1 knockdown inhibited the expression of CELF2 by EZH2-meidated epigenetic silencing. The results manifested that TNK2-AS1 knockdown restrained EZH2 binding to the promoter region of CELF2 gene and EZH2-mediated histone H3 lysine 27 trimethylation (H3K27me3) modification in HL-60 and THP-1 cells ().
Figure 4. TNK2-AS1 regulated CELF2 expression by interacting with EZH2 in AML cells. (a) the nuclear location of TNK2-AS1 was determined in HL-60 and THP-1 cells. (b) RIP assay identified the interaction between TNK2-AS1 and EZH2 in HL-60 cells. (c) Western blotting analysis of CELF2 protein expression in HL-60 and THP-1 cells transfected with sh-NC and sh-TNK2-AS1. (d-e) Western blotting analysis of EZH2 and CELF2 protein expression in HL-60 and THP-1 cells transfected with sh-NC and sh-EZH2. (f) ChIP analysis of EZH2 occupancy and H3K27me3 binding in the CELF2 promoter in HL-60 and THP-1 cells transfected with sh-NC and sh-TNK2-AS1. *P < 0.05 vs lgG group or control group.
Knockdown of CELF2 involved in TNK2-AS1-mediated oncogenic function in AML
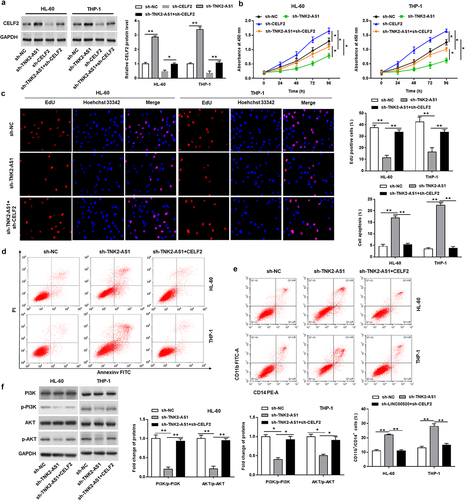
To explore whether CELF2 was implicated in the TNK2-AS1-mediated AML progression, the TNK2-AS1 shRNA was transfected alone or together with CELF2 shRNA into HL-60 and THP-1 cells. Western blotting analysis affirmed that the upregulation of CELF2 by TNK2-AS1 knockdown was reversed by CELF2 shRNA (). CCK-8 and EdU assays proofed that the suppressed cell proliferative ability in sh-TNK2-AS1-transfected was reversed by CELF2 knockdown (. Fow cytometry assay demonstrated that the decrease CELF2 expression could rescue TNK2-AS1 deficiency-induced cell apoptosis (). In addition, silencing of CELF2 could attenuate the increasing effect of TNK2-AS1 knockdown on the number of CD11b and CD14 positive cells and the inhibitory effect of TNK2-AS1 knockdown on the phosphorylation levels of PI3K and Akt (.
Figure 5. TNK2-AS1 exerted oncogenic effect by inhibiting the expression of CELF2. HL-60 and THP-1 cells were transfected with sh-TNK2-AS1 along or together with sh-CELF2. (a) the transfection efficiency was detected by Western blotting analysis. (b-c) Cell proliferation of HL-60 and THP-1 cells was measured by CCK-8 and EdU assays. (d) Cell apoptosis of HL-60 and THP-1 cells was evaluated with flow cytometry. (e) the number of CD11b and CD14 positive cells in HL-60 and THP-1 cells were assessed by flow cytometry assays. (f) the levels of p-PI3K and p-Akt expression in HL-60 and THP-1 cells were assessed by western blotting. *P < 0.05 vs control group or sh-TNK2-AS1.
To further explore the effect of TNK2-AS1 on cell differentiation, we used PMA and ATRA to induce HL-60 and THP-1 cells. The results showed that the expression of TNK2-AS1 and ELK1 was decreased, and CELF2 protein expression was increased in PMA or ATRA-induced HL-60 and THP-1 cells (Supplementary Figure S4a, S4b, and S4c). Furthermore, we also used PMA and ATRA to induce HL-60 and THP-1 cells with overexpressing TNK2-AS1, and found that PMA and ATRA reversed the upregulation of TNK2-AS1 expression induced by TNK2-AS1 overexpression vector (Supplementary Figure S4d and S4 g). Overexpression of TNK2-AS1 reduced the number of CD11b and CD14 positive cells, however PMA markedly increased the number of CD11b and CD14 positive cells (Supplementary Figure S4e and S4f). In addition, we also observed that ATRA played the same role as PMA in HL-60 and THP-1 cells with overexpressing TNK2-AS1 (Supplementary Figure S4e and S4 h).
Knockdown of TNK2-AS1 suppressed AML tumorigenesis in vivo
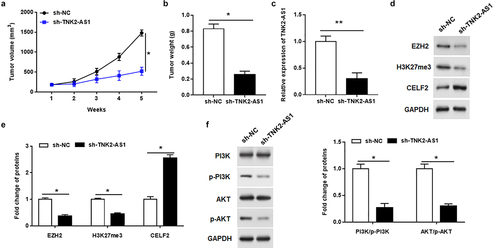
To further determine the carcinogenic effect of TNK2-AS1 in AML in vivo, we next injected nude mice with THP-1 cells that were transfected with lentiviruses carrying sh-TNK2-AS1 or sh-NC. From tumor growth curve, we found that the tumor volume of TNK2-AS1 knockdown group was significantly inhibited compared with the sh-NC group (). Simultaneously, tumor weight of TNK2-AS1 knockdown group was remarkably lower than that of the sh-NC group (). Furthermore, RT-qPCR analysis showed that TNK2-AS1 expression in tumors was downregulated in TNK2-AS1 knockdown group compared with sh-NC group (). In addition, western blot showed that TNK2-AS1 knockdown upregulated CELF2 protein and suppressed the protein expression of EZH2 and H3K27me3 (. Furthermore, silencing TNK2-AS1 markedly decreased the phosphorylation levels of PI3K and Akt (). Collectively, the above results suggested that TNK2-AS1 may function as an oncogenic role in AML.
Figure 6. Silencing TNK2-AS1 suppressed AML tumorigenesis in vivo. AML cells stably transfected with sh-NC or sh-TNK2-AS1 were injected into nude mice (a) Tumor volume was calculated every week after inoculation. (b) Tumor weight was weighted in mice. (c) the expression of TNK2-AS1 was measured by RT-qPCR. (d and e) the protein expression of EZH2, H3K27me3 and CELF2 was measured with Western blotting. (f) the levels of p-PI3K and p-Akt expression in mice was detected by Western blot assay. *P < 0.05 vs control group.
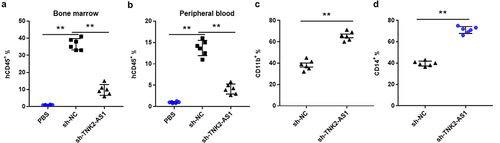
In addition to the subcutaneous in vivo leukemia model, we also characterized the effect of TNK2-AS1 knockdown by using systemic in vivo leukemia model. The NCG mice were injected via the tail vein with 5 × 10⁶ THP-1 cells with sh-TNK2-AS1 or sh-NC. We verified leukemia engraftment in the bone marrow by flow cytometry assay 3 weeks after injection, and further demonstrated that sh-TNK2-AS1–treated mice exhibited lower percentages of hCD45+ cells in bone marrow and peripheral blood than sh-NC – treated mice (. Interestingly, the levels of both CD11b and CD14 were dramatically increased in sh-TNK2-AS1–treated mice compared with sh-NC – treated mice, indicating that TNK2-AS1 downregulation is necessary for AML myeloid differentiation.
Figure 7. TNK2-AS1 knockdown impairs the tumorigenesis of AML cells in vivo. (a-b) Flow cytometry assay was used to measure the levels of blasts in blood and bone marrow samples from mice treated with TNK2-AS1-knockdown THP-1 cells. (c-d) the expression of CD11b and CD14 in bone marrow samples from mice treated with TNK2-AS1-knockdown THP-1 cells was detected with the flow cytometry assay. *P < 0.05 vs control group.
Discussion
LncRNAs have been reported to be potential diagnostic and prognostic markers for multiple cancers including AML [Citation6]. Increasing evidence has been demonstrated that lncRNAs are key players in AML progression [Citation15]. LncRNA TNK2-AS1 (TNK2-AS1) was found to be involved in the progression of various cancers, including NSCLC [Citation12], OS [Citation14]. However, the expression and role of TNK2-AS1 in AML have not been characterized. In the current study, we first elucidated the biological role of TNK2-AS1 in AML. The predicted results from the database website (GEPIA) showed that the expression of TNK2-AS1 was highly expressed in AML patients. We further found that TNK2-AS1 was noticeably upregulated in AML cell lines, as well as in the peripheral blood of AML patients, which was consistent with previous studies showing that TNK2-AS1 expression was increased in NSCLC [Citation12], gastric cancer [Citation16] and osteosarcoma [Citation14]. We continue to detect the upstream transcription factor of TNK2-AS1 by bioinformatic analysis and experiments, and uncovered ELK1 could directly bind to TNK2-AS1 promoter region to transcriptionally activate it. Accumulated evidence indicated that ELK1 was an important transcription activator of lncRNA [Citation17–19]. Most importantly, overexpression of ELK1 promoted TNK2-AS1 expression, and the results of rescue assays indicated that knockdown of TNK2-AS1 significantly suppressed proliferation and induced apoptosis and differentiation of AML cells in vitro, and inhibited tumor growth in vivo.
Extensive research has proven that lncRNAs regulated cancer-related biological processed through a variety of different molecular mechanisms including binding to RNA-binding proteins (RBPs). For instance, TNK2-AS1 facilitated angiogenesis by interacting with STAT3 to elevating VEGFA expression [Citation12]. Gao et al. found that HOTAIR facilitated leukemogenesis by EZH2-mediated epigenetic silencing of p15 [Citation20]. HOXA-AS2 exerted carcinogenic effect through binding with EZH2 and reducing LATS2 expression in AML [Citation9]. It has been identified that EZH2 is a highly conserved histone methyltransferase, which can restrain the expression of downstream tumor suppressor genes by triggering H3K27me3 trimethylation, thus affecting cellular fate [Citation21,Citation22]. A large number of lncRNAs bind with EZH2 to regulating the expression of target genes such as PTEN [Citation23],p15 [Citation24] and KLF2 [Citation25]. Our study revealed that TNK2-AS1 inhibited CELF2 expression via the recruitment of EZH2 to facilitate AML cell proliferation and reduce apoptosis and differentiation.
CELF2 is recognized as an RBPs and has been reported as a tumor inhibitor in various cancers [Citation26–28]. Dysregulation of CELF2 could regulate cell cycle, proliferation, migration, invasion, and apoptosis [Citation26,Citation29]. In hepatocellular carcinoma, lncRNA CRNDE promoted epigenetic suppression of CELF2 by binding to EZH2 to facilitate proliferation, migration, and chemoresistance [Citation30]. In our study, we found that silencing EZH2 upregulated CELF2 protein expression, and silencing TNK2-AS1 reduced the enrichment of EZH2 and H3K27me3 in the promoter region of CELF2. CELF2 knockdown promoted AML cell proliferation and inhibited cell apoptosis and differentiation, and reversed the negative effects of TNK2-AS1 silencing in AML cells.
Wu et al. showed that STYXL1 accelerated the development of hepatocellular carcinoma via inhibiting CELF2 expression through the PI3K/Akt pathway [Citation31]. Yeung et al. illustrated that CELF2 play an important role in the PI3K/Akt pathway [Citation29]. Activation of PI3K/Akt pathway could promote the occurrence of AML [Citation32]. Herein, we uncovered that silencing of TNK2-AS1 could increase CELF2 expression level in AML cells and EZH2 could bind to CELF2 promoter region. Afterward, rescue assays identified that CELF2 and PI3K/Akt pathway were implicated in the TNK2-AS1-mediated AML progression.
Conclusions
In conclusion, our results revealed that TNK2-AS1 was remarkably upregulated in AML patients and partly activated by ELK1. Knockdown of TNK2-AS1 noticeably restrained AML cell proliferation while induced apoptosis and differentiation. In addition, TNK2-AS1 exerted oncogenic role in AML through regulation of the EZH2/CELF2/PI3K/Akt pathway. These findings provided novel potential diagnostic or therapeutic target for AML.
Author contributions
Dongfang Guo and Airong Zhang contributed to the experiment design, manuscript draft, and data analysis. Meifang Suo contributed to the experiment implementation, manuscript draft, and data analysis. Ping Wang performed the experiment. Yile Liang analyzed the data. All authors read and approved the final manuscript.
Availability of data and materials
The datasets used during the present study are available from the corresponding author upon reasonable request.
Ethics approval and consent to participate
The animal use and care were approved by the Committee for Ethical Review of Research of the Zhumadian Central Hospital and all animal studies were performed according to the guidelines for the ethical review of laboratory animal welfare National Standard GB/T 35,892–2018 issued by the People’s Republic of China. The in vivo animal study was also carried out in compliance with the ARRIVE guidelines 2.0.
Supplemental Material
Download MS Word (1 MB)Acknowledgements
The authors thank Zhumadian Central Hospital for its support.
Disclosure statement
No potential conflict of interest was reported by the author(s).
Supplementary material
Supplemental data for this article can be accessed online at https://doi.org/10.1080/15384101.2022.2109898
Additional information
Funding
References
- Newell LF, Cook RJ. Advances in acute myeloid leukemia. BMJ (Clin Res Ed). 2021;375:n2026.
- Cai SF, Levine RL. Genetic and epigenetic determinants of AML pathogenesis. Semin Hematol. 2019;56:84–89.
- Bewersdorf JP, Tallman MS, Stahl M. Maintenance therapies in acute myeloid leukemia: the renaissance of an old therapeutic concept. Curr Opin Oncol. 2021;33:658–669.
- Kayser S, Levis MJ. Updates on targeted therapies for acute myeloid leukaemia. Br J Haematol. 2022;196:316–328.
- Estey EH. Acute myeloid leukemia: 2019 update on risk-stratification and management. Am J Hematol. 2018;93:1267–1291.
- Chi Y, Wang D, Wang J, et al. Long non-coding RNA in the pathogenesis of cancers. Cells. 2019;8(9):1015.
- Peng WX, Koirala P, Mo YY. LncRNA-Mediated regulation of cell signaling in cancer. Oncogene. 2017;36(41):5661–5667.
- Tan YT, Lin JF, Li T, et al. LncRNA-Mediated posttranslational modifications and reprogramming of energy metabolism in cancer. Cancer Commun (Lond). 2021;41(2):109–120.
- Feng Y, Hu S, Li L, et al. Long noncoding RNA HOXA-AS2 functions as an oncogene by binding to EZH2 and suppressing LATS2 in acute myeloid leukemia (AML). Cell Death Amp Dis. 2020;11:1025.
- Zuo W, Zhou K, Deng M, et al. LINC00963 facilitates acute myeloid leukemia development by modulating miR-608/MMP-15. Aging (Albany NY). 2020;12:18970–18981.
- Chen L, Wang W, Cao L, et al. Long non-coding RNA CCAT1 acts as a competing endogenous RNA to regulate cell growth and differentiation in acute myeloid leukemia. Mol Cells. 2016;39:330–336.
- Cai T, Cui X, Zhang K, et al. LncRNA TNK2-AS1 regulated ox-LDL-stimulated HASMC proliferation and migration via modulating VEGFA and FGF1 expression by sponging miR-150-5p. J Cell Mol Med. 2019;23(11):7289–7298.
- Yao W, Yan Q, Du X, et al. TNK2-AS1 upregulated by YY1 boosts the course of osteosarcoma through targeting miR-4319/WDR1. Cancer Sci. 2020;112(2):893–905.
- Gourvest M, Brousset P, Bousquet M. Long noncoding RNAs in acute myeloid leukemia: functional characterization and clinical relevance. Cancers (Basel). 2019;11(11):11.
- Guo L, Ma H, Kong Y, et al. Long non-coding RNA TNK2 AS1/microRNA-125a-5p axis promotes tumor growth and modulated phosphatidylinositol 3 kinase/akt pathway. J Gastroenterol Hepatol. 2022;37:124–133.
- Wang W, Chen S, Song X, et al. Elk1/lncrna-Snhg7/mir-2682-5p feedback loop enhances bladder cancer cell growth. Life Sci. 2020;262:118386.
- Ma SP, Xi HR, Gao XX, et al. Long noncoding RNA HBBP1 enhances γ-globin expression through the ETS transcription factor ELK1. Biochem Biophys Res Commun. 2021;552:157–163.
- Ma G, Dai W, Zhang J, et al. Elk1‑mediated upregulation of lncRNA LBX2‑AS1 facilitates cell proliferation and invasion via regulating miR‑491‑5p/s100a11 axis in colorectal cancer. Int J Mol Med. 2021;48. DOI:10.3892/ijmm.2021.4971
- Gao S, Zhou B, Li H, et al. Long noncoding RNA HOTAIR promotes the self-renewal of leukemia stem cells through epigenetic silencing of p15. Exp Hematol. 2018;67:32–40.e3.
- Duan R, Du W, Guo W. EZH2: a novel target for cancer treatment. J Hematol Oncol. 2020;13:104.
- Qi W, Zhao K, Gu J, et al. An allosteric PRC2 inhibitor targeting the H3K27me3 binding pocket of EED. Nat Chem Biol. 2017;13:381–388.
- Zang X, Gu J, Zhang J, et al. Exosome-Transmitted lncRNA UFC1 promotes non-small-cell lung cancer progression by EZH2-mediated epigenetic silencing of PTEN expression. Cell Death Amp Dis. 2020;11:215.
- Xu DF, Tao XH, Yu Y, et al. LncRNA FOXC2-AS1 stimulates proliferation of melanoma via silencing p15 by recruiting EZH2. Eur Rev Med Pharmacol Sci. 2020;24(17):8940–8946.
- Liu J, Li Z, Yu G, et al. LINC01232 promotes gastric cancer proliferation through interacting with EZH2 to inhibit the transcription of KLF2. J Microbiol Biotechnol. 2021;31:1358–1365.
- Guo Q, Wu Y, Guo X, et al. The RNA-binding protein CELF2 inhibits ovarian cancer progression by stabilizing FAM198B. Mol Ther Nucl Acids. 2021;23:169–184.
- Wang L, Liu Z, Liu L, et al. CELF2 is a candidate prognostic and immunotherapy biomarker in triple-negative breast cancer and lung squamous cell carcinoma: a pan-cancer analysis. J Cell Mol Med. 2021;25(15):7559–7574.
- New J, Subramaniam D, Ramalingam S, et al. Pleotropic role of RNA binding protein CELF2 in autophagy induction. Mol Carcinog. 2019;58(8):1400–1409. DOI:10.1002/mc.23023
- Shi M, Yang R, Lin J, et al. LncRNA-SNHG16 promotes proliferation and migration of acute myeloid leukemia cells via PTEN/PI3K/AKT axis through suppressing CELF2 protein. J Biosci. 2021;46. DOI:10.1007/s12038-020-00127-1
- Xie SC, Zhang JQ, Jiang XL, et al. LncRNA CRNDE facilitates epigenetic suppression of CELF2 and LATS2 to promote proliferation, migration and chemoresistance in hepatocellular carcinoma. Cell Death Amp Dis. 2020;11(8):676.
- Wu JZ, Jiang N, Lin JM, et al. STYXL1 promotes malignant progression of hepatocellular carcinoma via downregulating CELF2 through the PI3K/Akt pathway. Eur Rev Med Pharmacol Sci. 2020;24(6):2977–2985.
- Nepstad I, Hatfield KJ, Grønningsæter IS, et al. The PI3K-Akt-mTOR signaling pathway in human Acute Myeloid Leukemia (AML) cells. Int J Mol Sci. 2020;21(8):21.
- Nepstad I, Hatfield KJ, Grønningsæter IS, et al. The PI3K-Akt-mTOR signaling pathway in human Acute Myeloid Leukemia (AML) cells. Int J Mol Sci. 2020;21(8):21.