
ABSTRACT
Periosteum is expected for bone repairing due to excellent regenerative potential. PDCs are the main source of cells for promoting bone repair. However, PDCs from different sites have been confirmed to be site specific due to their distinct embryonic origin and the methods of bone formation. Hippo-YAP pathway is proved to play a critical role in fate decision of mesenchymal stem cells. The effect of Hippo-YAP on PDCs has not been reported so far. Hence, we aim to explore the differences of PDCs from mandible and femur along with their possible responses to YAP signaling. mPDCs and fPDCs were obtained and tested through flow cytometry for identification. Follow-up results illustrated mPDCs was cubic shape and with better proliferation while fPDCs preferred slender cell shape with worse cell viability compared with mPDCs. mPDCs was superior to fPDCs in ALP activity, related mRNA expression and calcium deposits in late stage. Interestingly, downregulation of YAP promoted the ALP activity, related mRNA expression and calcium deposits of fPDCs while hindered that of mPDCs in vitro. Moreover, implant animal model in mandible and femur were constructed for evaluation in vivo. Histological results were similar to the results in vitro. We speculate this may result from their different embryonic origin and the way of bone formation. Taken together, results available suggested that mPDCs may serve as more optimal seed cells for tissue engineering compared with fPDCs; however, considering their different response to YAP signaling, to ensure sufficient YAP expression in mPDCs and appropriate declining YAP expression in fPDCs may establish better osteogenesis.
Introduction
Over recent years, the periosteum has attracted much attention due to its superior osteogenic ability [Citation1–4]. It, covering the surface of bone tissues, is well known for its double-layer and vascularized membrane structure [Citation5]. As an important structure of the implantation area, the periosteum can be used for bone repair in situ when there are peri-implant defects [Citation6]. What’s more, the periosteum becomes a hot topic, because it is a critical source of osteogenic cells and an important nutrient supply during the process of bone repair [Citation7–9]. The periosteum derived cells (PDCs) from the inner layer containing osteoblastic cells, stem cells, and periosteal progenitor cells were regarded as the fate decider of bone repair [Citation1,Citation5,Citation10]. Furthermore, the periosteum provides a unique microenvironment for the osteogenesis of PDCs [Citation11]. Previous research reported a type of cathepsin K (CTSK)-positive periosteal stem cells [Citation1]. After being transplanted into the kidney capsule, these CTSK-positive cells preferred intramembranous bone formation under physiological conditions. However, these cells might undergo endochondral ossification when suffering pathological conditions. It revealed the osteogenic mode of PDCs might vary with the change in the microenvironment. In other words, those factors related to the changing of the microenvironment are worth being paid attention to in research about periosteum and PDCs.
Given the differences in the developmental origins and ossification modes between jaw and long bone, cells from the jaw and femur also exhibit distinctions in the osteogenic properties. Specifically, the jaw is mainly from the neural crest in the neuroectoderm, while the long bone is derived from mesenchymal cells of the mesoderm [Citation12–14]. Besides, the jaw formation is dominated by intramembranous ossification, but the long bone is formed mainly by endochondral bone formation. Lots of previous in-vitro studies revealed that stem cells derived from mandible had better proliferative activity and larger cell-formed colonies, with more and larger calcium deposits [Citation15–18]. Another research reported the site-specific of osteoblast derived from the mandible and femur;osteoblast derived from the mandible demonstrated a better ability to promote the angiogenesis of related cells [Citation19]. Orofacial bone-derived mesenchymal stem cells have been reported to be more sensitive to casein kinase-2 interaction protein-1 (CKIP-1) than the femoral bone marrow-derived mesenchymal stem cells (BMSCs) in proliferation and osteogenic differentiation [Citation18]. Apart from this, the site-specificity of osteoblast has also been manifested in vitro studies [Citation20,Citation21]. When the mandible periosteum derived cells (mPDCs) were transplanted into the bone defect in long bone, intramembranous ossification was observed; on the contrary, the PDCs from long bone showed endochondral bone formation after being transplanted into the defect of mandibular [Citation22]. All the above results suggested that the PDCs from different origins were probably site-specific and even had a discrepant response to some key effector molecule of the critical signaling pathway.
The Hippo pathway is originally discovered in Drosophila melanogaster, and yes-associated protein (YAP) is the key effector-molecule downstream of the pathway [Citation23]. The effector protein YAP plays a critical role in the fate decision of mesenchymal stem cells [Citation24]. When changing the extracellular environment, YAP is transferred from the cytoplasm to the nucleus, and then regulates the runt-related transcription factor 2 (RUNX2), affecting the osteogenesis of those osteogenic related cells [Citation24,Citation25]. It is suggested that the Hippo-YAP signaling is a potential signal to promote tissue repairing. Furthermore, the Hippo-YAP signaling pathway is highly correlated with microenvironmental changes, especially in stem cells [Citation26,Citation27]. However, to our knowledge, there were few studies focused on the osteogenic effects of PDCs regulated by the Hippo-YAP pathway. Accordingly, we speculated that PDCs, as a heterogeneous cell population that contains a certain number of stem cells, promote peri-implant bone repair through the Hippo-YAP signaling.
In this study, the mandible was representative of the jaw, and the femur was representative of the long bone. We isolated mPDCs and femur periosteum derived cells (fPDCs) to explore the differences between them. Furthermore, the response of mPDCs and fPDCs to the Hippo-YAP signal was investigated. In addition, the implant animal model was constructed for in vivo exploration. We aimed to figure out the potential mechanism of YAP signaling on periosteal osteogenesis, around implants in different sites. Based on the in-vitro and in-vivo experiments above, the site-specificity of PDCs could be further clarified, which could provide a reference for their future applications.
Materials and methods
Isolation and culture of periosteum derived cells from mandible and femur
The primary periosteum derived cells were isolated from Sprague-Dawley rats. For the mPDCs, the skin was separated from the corner of the mouth to obtain the integral mandible. After peeling off all the soft tissues, the obtained mandible was put into the enzyme solution (1 mg/mL; Sigma, c0130, St. Louis, MO, USA) for 30 min at 37°C. Then, some small fibrous tissues on the bone surface were peeled off again. The bone tissues were put into a new enzyme solution at 37°C for 2 h. The solution was collected. Then, the above operation was repeated to obtain the cell suspension again. The obtained suspension was treated with a centrifuge at 1000 rpm for 5 min. The mPDCs were obtained after resuspension with medium.
For the fPDCs, the skin was first separated from the lateral surface of thigh in order to get the integral femur with muscles. Then, the attached muscles were stripped as much as possible. Same as the methods to obtain mPDCs, the femur went through repeated enzymatic digestion. The digested solution was collected and centrifuged. Finally, fPDCs were obtained after resuspension with medium.
Both mPDCs and fPDCs were cultured with Dulbecco’s modification of Eagle’s medium (DMEM) with 20% fetal bovine serum (FBS; Gibco, Grand Island, NY, USA), 2% (v/v) penicillin/streptomycin (Gibco, Grand Island, NY, USA). The acquired PDCs were cultured at 37°C under 5% humidified CO2, and the medium was changed every two days. Subsequent experiments were all done with PDCs of passage three.
Flow cytometry for cell identification, cell cycle, and apoptosis analysis
According to the reported methods, the surface markers of PDCs were detected via flow cytometry [Citation28]. Cultured PDCs from Sprague-Dawley rats were digested by 0.25% trypsin and then suspended in 2% FBS/phosphate buffered solution (PBS) to obtain single-cell suspensions. Each sample was incubated with anti-rat antibodies (CD29-Fluorescein Isothiocyanate (FITC), 102205; CD44 H-FITC, 203906; CD45-FITC, 202205; and CD90-PE, 205903; BioLegend, San Diego, CA, USA), respectively, at 4°C for 30 min in the dark. Rat IgG1-FITC and IgG1-PE were used as the isotype controls for cell identification. First, prepare single-cell suspensions through the same method mentioned above. Afterward, the Cell Cycle and Apoptosis Analysis Kit (Beyotime, Shanghai, China) was added to the suspensions. Then, all the cell samples were required to incubate at 37°C for 30 min. All the cell samples were detected by Attune® NxT Flow Cytometer (Thermo Fisher Scientific, Waltham, ME, USA). Flow Jo software version 10 (TreeStar, Ashland, OR, USA) was utilized for the follow-up analysis. The quantitative evaluation of cell cycle and apoptosis were mainly to calculate the S-phage fraction (SPF) and proliferation index (PI) for comparison. The flow cytometry tests for cell identification, cell cycle, and apoptosis analysis were repeated at least three times with similar results.
Cytoskeleton staining
PDCs of passage three were seeded with a density of 5 × 10⁴ cells per well in a 12-well plate for cytoskeleton staining. All the cell samples were collected after 24 h and cleaned with PBS and treated with 4% paraformaldehyde at room temperature for 20 min. Then, the samples were treated with 0.25% Triton for 8 min, FITC Phalloidin (100 nM; Solarbio, Beijing, China) for 30 min, and 4,6-diamino-2-phenylindole (DAPI) (1 ug/mL; Solarbio, Beijing, China) for 3 min in turns. All the staining process was taken under dark conditions. Finally, all samples were cleaned with PBS again and then observed under DAPI and FITC channels, respectively, with a fluorescence microscope (DMi8, Leica, Germany). Three regions were randomly selected. The length and width of single cells in these regions was measured. The length/width ratio was calculated, respectively, for quantitative analysis. Each experiment was performed at least three times.
Cell counting kit-8 (CCK-8) assay
Periosteum derived cells were added to the 96-well plate with the density of 1 × 10⁴ cells per well and cultured in DMEM, which contained 20% FBS and 2% (v/v) penicillin/streptomycin. CCK-8 analysis was done on days 1, 3, and 5. 100 μL new DMEM without FBS and with 10 μL CCK-8 solution was added to each well. The 96-well plate was incubated at 37°C in the dark for 1 h and then detected absorbance at 450 nm. The wells without cells were regarded as blank groups. The CCK-8 test was repeated three times with similar outcomes.
Alkaline phosphatase (ALP) staining
Different groups of PDCs (1 × 10⁵ cells/well) were seeded in the 6-well plate and cultured in an osteogenic induction medium. The osteogenic-inducing medium was DMEM containing 20% FBS, 2% (v/v) penicillin/streptomycin, 50 μg/mL ascorbic acid (Sigma, St. Louis, MO, USA), 10 mM β-glycerol phosphate (Sigma, St. Louis, MO, USA) and 100 nM dexamethasone (Sigma, St. Louis, MO, USA). After osteogenic induction for 7 days, the cells were harvest and then fixed in 4% paraformaldehyde for 30 min. Then, the Alkaline Phosphatase Staining Kit (Beyotime, Shanghai, China) was used according to the manufacture’s instruction. Four groups were set up here. M group: mPDCs; MVP group: mPDCs +10−7 mol/L Verteporfin; F group: fPDCs; FVP group: fPDCs +10−7 mol/L Verteporfin. The staining above was taken in triplicate with similar results.
Alizarin red staining
Different groups of PDCs were seeded with 1 × 10⁵ cells/well in the 6-well plate. The samples were treated with an osteogenic induction medium for 14 days. The samples were fixed with 4% paraformaldehyde for 30 min. Then, 0.2% Alizarin Red S solution (Solarbio, Beijing, China) was used for staining for 30 min at 37°C. For quantitative assessment, 10% cetylpyridinium chloride was added to each well to dissolve the mineralized nodules. The absorbance at the excitation wavelength of 562 nm was detected. The four groups were the same as mentioned above. All experiments were performed three times.
Alkaline phosphatase activity assay
For ALP activity assay, cells of different groups were added to the 12-well plate with a density of 1 × 10⁵ cells/well. Cells were cultured with an osteogenic induction medium and harvested at 1, 4, and 7 days, respectively. The medium was changed every day. The Bicinchoninic Acid (BCA) Assay Kit (Beyotime, Shanghai, China) was used for the assessment of total protein for further quantitative analysis. Then, ALP assay was performed according to the instruction of the ALP Assay Kit (Beyotime, Shanghai, China). The ALP activity was calculated after standardization by the total protein amount measured by the BCA method. The four groups were the same as mentioned above. The evaluation was performed in triplicate.
Real-Time quantitative polymerase chain reaction (PCR)
PDCs cells (4 × 10⁵ cells/well) were seeded in 6-well plates. For the verification of mechanism of verteporfin, cells were harvest 24 h after treated with 10−7 mol/L verteporfin in DMEM medium. The group without verteporfin was regarded as control group. For osteogenic differentiation assessment, cells were cultured in an osteogenic induction medium for 1, 4, and 7 days. The tissue samples in vivo were collected 14 days after surgery. For both in vitro and in vivo experiments, total RNA was isolated with FastPure® Cell/Tissue Total RNA Isolation Kit V2 (RC112–01; Vazyme, Nanjing, China). The complementary DNA was synthesized using HiScript® III RT SuperMix for qPCR (+gDNA wiper) (R323–01, Vazyme, Nanjing, China) as the reverse transcript process. Taq Pro Universal SYBR qPCR Master Mix (R323–01, Vazyme, Nanjing, China) was applied for the RT-PCR procedure. The RT-PCR procedure was finally performed in the ABI PCR System (7300, Applied Biosystems, USA) according to the manufacturer’s instructions. The 2–ΔΔCt method was used to assess the expression levels of the relative target gene; glyceraldehyde 3-phosphate dehydrogenase (GAPDH) was regarded as the endogenous housekeeping gene. The primer sequences were as followed (). All quantitative analysis stood for three repeated tests.
Table 1. Primer sequences for RT-qPCR of rat PDCs in vitro.
Table 2. Primer sequences for RT-qPCR of the mouse in vivo.
Immunofluorescence staining
The mPDCs and fPDCs were added in the 48-well plate with a density of 1 × 10⁴ cells/mL, respectively, and 0.25 mL cell suspension was added to each well. After osteogenic induction for 7 days, the cell samples were harvested and washed with PBS for three times. Then, 4% paraformaldehyde was added to treat the cells for 20 min. Then, the cells were treated in turns with 0.25% Triton for 8 min, 3% H2O2 for 15 min and 1% bovine serum albumin (BSA) solution in PBS for 30 min in a humidified chamber at room temperature. Later, primary antibodies to ALP (rabbit monoclonal, Huabio, ET1601–21, 1/100) in 1% BSA were added to each well and cell samples were put in a humidified chamber at 4°C overnight in dark. After washed for three times, the cells were incubated with Alexa Fluor® Plus 488 Goat anti-Rabbit IgG (Invitrogen, A32731, 1/1000) in 1% BSA at 37°C for 1 h in a humidified chamber in dark as the secondary antibody. Finally, we washed the cell samples and treated them with DAPI (1 ug/mL, Solarbio, China) for three minutes. The observation was with a fluorescence microscope (DMi8, Leica, Germany) under DAPI and Fluor 488 channels. All experiments were performed three times.
Animal surgery procedure and YAP interference
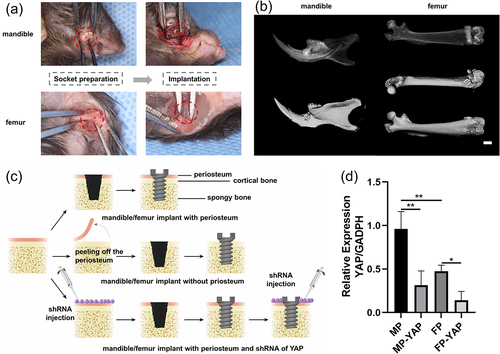
The study in vivo conforms to the ARRIVE guidelines. All animal experiments were approved by West China Hospital of Stomatology, Sichuan University Ethical Committee under register WCHSIRB-D-2021-540. Ninety C57BL/6 wild-type mice were divided into six groups. The HBLV-m-YAP1 shRNA1-ZsGreen-PURO (Hanbio Co. Ltd., Shanghai, China) was designed for the knockdown of YAP, which was also termed as YAP lentiviral vector or YAP interference lentiviral vector. These six groups were constructed according to different implantation sites and processing methods. YAP interference lentiviral vector system was established as reported [Citation29]. M group: implant in mandible without periosteum; MP group: implant in the mandible with periosteum; MP-YAP group: implant in the mandible with periosteum and injection of YAP lentiviral vector; F group: implant in femur without periosteum; FP group: implant in the femur with periosteum; FP-YAP group: implant in the femur with the injection of YAP lentiviral vector. The periosteum was peeled off along with skin and muscles before the implantation procedure in M and F groups. To preserve the integrity of the periosteum, the drill was utilized for socket preparation when there was less muscle tissue remaining in FP and MP groups. In MP-YAP and FP-YAP groups, there was YAP interference lentiviral vector injection when there was less muscle tissue remaining and then came the socket preparation. After implantation, there were another YAP interference lentiviral vector injection in the two groups. Such procedure was designed to ensure the YAP interference lentiviral vector was localized at the periosteum as much as possible. Simultaneously, it could help reduce the influences that the YAP interference lentiviral vector brought to bone and muscles around.
C57BL/6 wild-type mice (5 weeks-age) were used for animal surgery. Generally, ketamine (80 mg/kg; Virbac, Carros, France) along with xylazine (12 mg/kg; Bayer, Lyon, France) were used as an anesthetic for mice in this study as described previously [Citation30]. 75% alcohol by volume was for local disinfection. The φ 0.5 mm drill was used for socket preparation. The sand-blasted with large grit and acid-etched (SLA) titanium implant (φ 0.6 mm × 1.25 mm for mandible and φ 0.6 mm × 2.25 mm for femur; Wego, Shandong, China) was placed into the socket. The skin and muscles were stitched with sutures, respectively. All the mice were fed with a standard diet and antibiotics were for intramuscular injection after surgery. Finally, the mandibles and femurs with implants were harvested with all soft tissue removed 14 days after surgery.
Micro-CT evaluation
The undecalcified samples of each group were fixed with 4% paraformaldehyde and then scanned by micro-CT (μCT-50, Scanco Medical AG, Switzerland). The scanner was set at a resolution of 10 μm and exposure parameters of 90 kV and 200 μA. The region within 100 μm from the implant surface was defined to be the volume of interest (VOI), where bone-implant contact (BIC) and bone volume/tissue volume (BV/TV) were calculated for the osseointegration around the whole implants. To better assess the role of the periosteum in the osseointegration of implants, the BIC for the top part of the implant closest to the cortical bone was analyzed simultaneously. The top part of the implant approximately 200 μm high from the neck was defined as the upper segment of the implants for scientific analysis. According to Ohlsson et al., and our measurement, the cortical bone thickness in adult mice was about 200 μm [Citation31]. Sample size: at least three mice for each group in every analysis.
Histological analysis
The mandibles and femurs with implants of different groups were fixed with 4% paraformaldehyde and decalcified. Then, the implants were unscrewed gently. Later, all the samples were treated with a graded series of alcohol (75, 85, 95, and 100%) for dehydration and xylene in turns. Samples were embedded in molten paraffin to get paraffin-embedded tissue. At least three sections were obtained from each sample. Each section was 5-μm thick. Hematoxylin and eosin staining solution was used for the hematoxylin–eosin (HE) staining of the sections. The microscope (DM2000, Leica, Germany) was used to examine the stained sections. There were at least three mice for each group in this analysis.
Statistical analysis
Each experiment was performed at least three times and data were presented as means ± standard errors of the mean (SD). Statistical analysis was performed with SPSS 22.0. Software through Student t test along with ANOVA using a multiple-comparison Dunnett post hoc test. P < 0.05 was defined to be statistically significant.
Results
The mPDCs and fPDCs of Sprague-Dawley rats could be obtained and were proved to be with stem cell-like phenotype
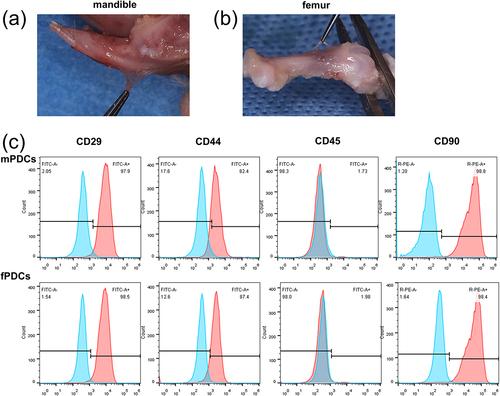
The periosteum was a thin and almost transparent membrane-like structure that was attached to the surface of bone tissue both in the mandible () and the femur (). The obtained mandible periosteum derived cells (mPDCs) and femur periosteum derived cells (fPDCs) by enzyme digestion were a heterogeneous population of cells, instead of a single type of cells. To further characterize the obtained cells, fluorescein-labeled antibodies were examined by flow cytometry to access the expression of CD29, CD44 H, CD45, and CD90. Over 80% of PDCs were CD29+, CD44+, or CD90+, respectively, while no more than 2% of them had an expression of CD45 (). Flow cytometry results suggested that most of the cells we obtained were periosteal stem cells.
Figure 1. The isolation, culture, and identification of mandible and femur periosteum derived cells, and most PDCs expressed cell surface markers of stem cells. (a, b) After removing soft tissue such as skin and muscle, the periosteum of the mandible (top row) and femur (bottom row) from Sprague-Dawley rats could be observed on the surface of bone tissue. (c) CD29, CD44, CD45, and CD90 expression of mPDCs (top row) and fPDCs (bottom row) were evaluated by flow cytometry which was repeated at least three times with similar results.
mPDCs and fPDCs differed from each other in morphological extension, proliferative viability, and osteogenic differentiation
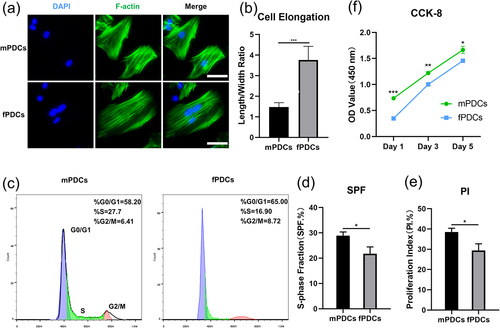
To compare visually and straightforwardly, mPDCs and fPDCs were first stained with phalloidin. Fluorescent pictures of the cytoskeleton revealed that single mPDC preferred a more cubic cellular shape while fPDC stretched longer and showed a thinner cellular body as a single cell (). Quantitative analysis of length/width ratio indicated fPDCs had better cell elongation than mPDCs as well (). For further clarification of the differences between the two types of cells, flow cytometry was performed for detecting the cell cycle of different types of PDCs (). Relevant parameters, s-phase fraction (SPF), and proliferation index (PI) were calculated according to the formula. A significant difference was confirmed between the mPDCs group and the fPDCs group in the SPF value () as well as the PI value (). To further clarify the difference in cell viability between the two groups, we performed CCK-8 assay on days 1, 3, and 5. Obviously, mPDCs had better cell viability than fPDCs in the very beginning and always maintained such growth advantages until day 5 (). The difference between mPDCs and fPDCs on days 1, 3, and 5 was statistically significant, respectively. Taken together, mPDCs indeed showed better growth vigor than fPDCs, which may affect their respective subsequent biological behaviors.
Figure 2. Periosteum derived cells from different sources had various morphological and growth characteristics. (a) Respectively, mPDCs and fPDCs (5 × 10⁶) from Sprague-Dawley rats were seeded in 12-well plates and were harvested for cytoskeleton staining the next day. Blue: nuclear; green: cytoskeleton (F-actin); scale bar = 50 μm. (b) Five single cells were selected at random from each of the two groups, mPDCs, and fPDCs. The length/width ratio was calculated as cell elongation for quantitative analysis. (c) After stable cell subculture, the cell cycle of mPDCs and fPDCs was tested with flow cytometry. (d, e) The proportion of S phase and proliferation index of PDCs from mandible and femur was reflected by cell cycle analysis. (f) CCK-8 was performed on days 1, 3, and 5 for long-term cell proliferation assessment. All vitro tests were repeated three times with similar outcomes. *p < 0.05; **p < 0.01; ***p < 0.001.
The periosteum derived cells (PDCs) attracted lots of attention as an important cellular source of osteogenesis. We first conducted alkaline phosphatase (ALP) staining and alizarin red staining to provide a rough assessment of the osteogenic capacity between PDCs of different sources. Qualitative image results showed that mPDCs had better ALP activity than fPDCs after osteogenic induction for 7 days (). However, it was hard to distinguish the difference in alizarin red‐positive nodules between mPDCs and fPDCs in the general view (). Quantitative assessment of alizarin red staining proved mPDCs were with more calcium deposits, in comparison with fPDCs (). Micrographs of stained calcium deposits exhibited that fPDCs were with bigger but fewer calcium deposits, however, the calcium deposits of the mPDCs group seemed to be more but smaller (). To get more detailed information, ALP activity assay was conducted on days 1, 4, and 7 to access the early osteogenic differentiation and ALP activity increased with time in general (). Detailed data showed that mPDCs were with higher ALP activity on days 1 and 7 while the ALP activity of mPDCs and fPDCs was nearly the same on day 4. The expression level of osteogenesis-related genes, ALP, osteocalcin (OCN), and runt-related transcription factor 2 (RUNX2) was further detected at the mRNA level. Generally, the mRNA level of all these genes was proportional to time, yet they didn’t show the same trend as the results of ALP activity (). The mPDCs only showed higher mRNA expression of ALP than fPDCs on day 1. The higher OCN mRNA expression was observed on day 7 and that of RUNX2 was observed on days 4. What’s more, at protein level, mPDCs showed stronger ALP expression after osteogenic induction for 7 days, according to the immunofluorescence pictures (). In all, mPDCs seemed to have the superior osteogenic ability at some specific time points instead of all the time.
Figure 3. The downregulation of Hippo-YAP cascade signaling inhibited the osteogenic differentiation of mPDCs while promoting that of fPDCs in contrast. (a) Verteporfin decreased the mRNA expression of Hippo-YAP cascade signaling target Cyclin D1 in both mPDCs and fPDCs. (b) ALP staining was performed to evaluate the ALP activity of each group after osteogenic induction for 7 days. (c) Alizarin red staining was performed to evaluate the mineralization of each group after osteogenic induction for 14 days. Alizarin red‐positive nodules were observed directly. (d) Quantitative results of alizarin red staining of each group. (e) The calcium deposits nodules in detail in every group were reflected by the bright field images. Scale bar = 200 μm. (f) Each group of cells was cultured in an osteogenic induction medium for 1, 4, and 7 days and then ALP activity was assessed respectively. All experiments above were taken in triplicate. *p < 0.05; **p < 0.01; ***p < 0.001; ns, no significance.
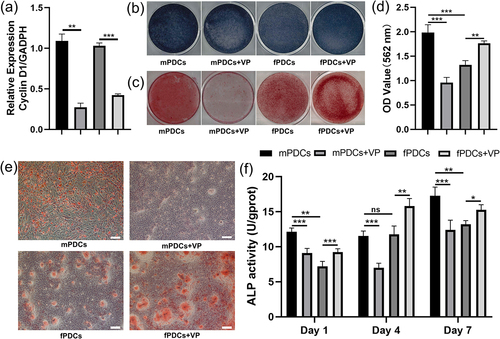
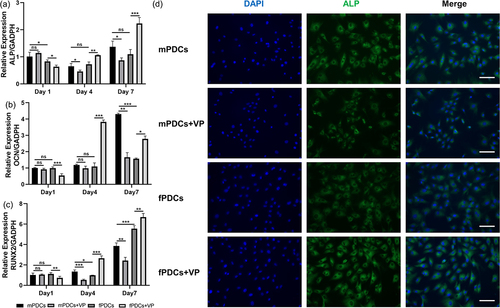
Figure 4. YAP inhibiter verteporfin decreased the osteogenic phenotype of mPDCss but enhanced the osteogenic differentiation of fPDCs at the mRNA level. Four groups of cells were treated with an osteogenic induction medium for 1, 4, and 7 days. (a, b and c) the mRNA expression of osteogenesis related genes, ALP, OCN, and RUNX2 was detected through a real‐time polymerase chain reaction. (d) The ALP immunofluorescent staining images of different groups cultured with osteogenic medium for 7 days. Scale bars = 100 μm. All quantitative analysis stood for three repeated tests. *p < 0.05; **p < 0.01; ***p < 0.001; ns, no significance.
The PDCs from the mandible and femur showed distinct response to YAP inhibitor verteporfin in osteogenic phenotype
To elucidate the effect of YAP on PDCs in osteogenic phenotype, we used verteporfin to achieve the downregulation of YAP cascade signaling. First, we verified the role of verteporfin. mPDCs and fPDCs showed decrease Cyclin D1 mRNA expression after treated with verteporfin (). According to the ALP staining images, mPDCs exhibited decreasing ALP activity while fPDCs showed increasing ALP activity with the downregulation of YAP cascade signaling (). After being treated with verteporfin, the alizarin red‐positive nodules of mPDCs sharply decreased, however, fPDCs showed obviously increasing mineralization when YAP signaling was inhibited in the general view, micrograph, and quantitative assay (). It was a similar result for protein-level assessment to test ALP activity. Verteporfin promoted the ALP activity of fPDCs but inhibited that of mPDCs on days 1, 4, and 7 (). Real-time PCR was designed to evaluate the mRNA expression of ALP, OCN, and RUNX2. As mPDCs were concerned, the expression of ALP had an obvious decrease on days 4, and 7 () after being treated with verteporfin. The expression of OCN in the MVP group (mPDCs +10−7 mol/L Verteporfin) obviously decreased only on day 7 () and RUNX2 had a lower expression on days 4 and 7 in the MVP group compared with (). Surprisingly, the mRNA expression of ALP, OCN, and RUNX2 in the FVP group (fPDCs +10−7 mol/L Verteporfin) declined compared with the F group (fPDCs) on the first day, which is opposite to the results of alizarin red staining and ALP activity. As time goes on, the mRNA level of ALP (), OCN () and RUNX2 () in the FVP group increased and was higher than that in the F group both on day 4 and day 7. Similar effects of verteporfin on mPDCs and fPDCs were exhibited in immunofluorescence staining. Verteporfin inhibited the ALP expression of mPDCs; however, fPDCs showed increasing ALP expression after treated with verteporfin ().
Different animal groups were constructed and clarified for follow-up exploration
The easy dissection of the periosteum facilitated the construction of M and F groups (M group: implant in mandible without periosteum; F group: implant in mandible without periosteum) in subsequent animal models (). The customized implants were successfully installed following proper socket preparation (). Micro-CT test was performed 14 days later. The three-dimensional reconstruction graphs of micro-CT indicated implants in both mandible and femur were in a good condition (). For further exploration, six groups in total were established in vivo (). For the mandible/femur implant periosteum group (MP/FP group), the periosteum didn’t need to be peeled off before socket preparation. In contrast, the periosteum around should be cleaned before socket preparation in mandible/femur implant without periosteum group (M/F group) to avoid the influence of periosteum on osteogenesis. YAP interference lentiviral vector system was designed to decrease the YAP expression in mandible/femur implant with periosteum and shRNA of YAP group (MP-YAP/FP-YAP group). Obviously, the periosteum was required to be preserved in MP-YAP and FP-YAP groups. The shRNA was injected twice, before socket preparation and after the implant installation. Detection of tissue quantitative RT-PCR suggested that the MP group were with higher-level mRNA expression of YAP compared with the FP group (). Meanwhile, the downregulation of YAP was successfully achieved through the interference lentiviral vector. The samples of each group were obtained 14 days after implantation surgery for follow-up exploration.
Figure 5. The animal models in vivo were constructed and verified by Micro-CT and tissue quantitative RT-PCR. (a) Simultaneously, the mandibular implant model and the femur implant model were constructed. 14 days after surgery, the bone tissue with implants was harvested for Micro-CT. (b) The reconstructed images of the mandible and femur were obtained after analysis. Scale bar = 1.0 mm. (c) In order to better explore the role of YAP signaling in mediating periosteum derived cells in osseointegration around implants, three groups were set up in the mandible and femur, respectively. (d) The effect of interference lentiviral vector on YAP expression was verified by tissue quantitative RT-PCR. Sample size: at least three mice for each group in every test. *p < 0.05; **p < 0.01.
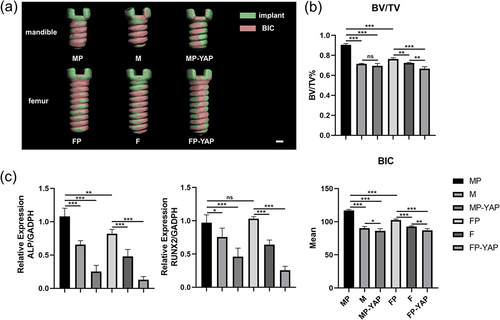
The periosteum promoted the osteointegration around implants both in the mandible and femur while the deficiency of YAP signaling decreased the osseointegration around the whole implants
From the three-dimension reconstruction of micro-CT, implants in both mandible and femur exhibited better bone-implant-contact when periosteum existed (). The lateral comparison suggested that deficiency of periosteum was in a decrease of bone-implant contact (BIC), especially in the area around the neck of implants. Besides, MP-YAP and FP-YAP groups showed the worst BIC in general. Surprisingly, the area with decreased BIC in the MP-YAP group was distributed in the whole implant while in the FP-YAP group such area was focused on the area far from the neck part of the implant. The results of quantitative analysis in micro-CT illuminated that the bone volume/tissue volume (BV/TV) and BIC in the MP group were superior to that in the FP group (). Apart from this, the periosteum enhanced the BV/TV and BIC in MP and FP group compared to M and F group. Transfection with YAP interference lentiviral vector system made the BV/TV and BIC in MP-YAP and FP-YAP groups the worst among the three groups with the same implant site. There was no significant difference between the M and MP-YAP groups (p>0.05). Tissue quantitative RT-PCR analyzed the expression level of osteogenesis-related genes ALP and RUNX2 and revealed similar results to micro-CT assessment (). In comparison, MP and FP groups showed the highest expression level of ALP and RUNX2, then M and F groups came next. The inhabitation of YAP caused lower expression of these related genes in the MP-YAP and FP-YAP groups. The expression level of ALP showed significant differences between MP and FP groups (p< 0.01). However, MP and FP groups exhibited nearly the same level of RUNX2 expression (p>0.05).
Figure 6. The impact of YAP expression levels and periosteum on osseointegration around the whole implants according to micro-CT analysis and tissue quantitative RT-PCR 14 days after surgery. Tissues of each group were first tested by micro-CT. (a) The three-dimensional reconstruction of the implants was used for the analysis of bone-contact-implant. Scale bar = 200 μm. (b) The quantitative analysis of micro-CT focused BV/TV and BIC parameters of every group. (c) After RNA extraction, relative mRNA expression levels of ALP and RUNX2 were detected by tissue quantitative RT-PCR at the genetic level. Sample size: at least three mice for each group in every analysis. *p < 0.05; **p < 0.01; ***p < 0.001; ns, no significance.
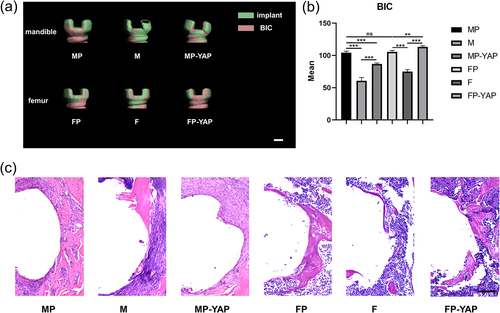
The periosteum mainly affected the osseointegration of the upper segment of the implants and the periosteum in the mandible and femur showed different osteogenic effects in response to the YAP inhibition
Considering that the periosteum might have a limited role in the osseointegration of implants, we further analyzed the osteogenesis of the upper part of the implant, which was close to the cortical bone and periosteum. According to Ohlsson et al., and our measurement, the cortical bone thickness in adult mice was about 200 μm [Citation31]. The top part of the implant approximately 200 μm high from the neck was defined as the upper segment of the implants for scientific analysis. The three-dimension reconstruction images of micro-CT revealed an obvious decrease in BIC of the implant neck after peeling off the periosteum both in the mandible and femur (). With the inhibition of YAP, the MP-YAP group showed worse BIC than the MP group, but still better than that of the M group. However, in the femur, the FP-YAP group even showed the best BIC among the three groups. The quantitative analysis of BIC showed similar results (). MP group and FP group had better BIC than M and F groups, respectively (p<0.001). After injection of YAP interference lentiviral vector, the BIC decreased in the mandible, while increased in the femur. On the other hand, the osseointegration of the upper segment of the implants in the mandible and femur showed no significant difference (p>0.05). While in the histological section analysis, more new bones were observed in the MP group than in the FP group (). There was less new bone in M and F groups due to the loss of periosteum. Likewise, downregulation of Hippo-YAP signaling decreased the new bone formation in the mandible and promoted osteogenesis in the femur. However, the difference between the FP group and the FP-YAP group in new bone formation was not as obvious as that in micro-CT analysis. Intriguingly, MP-YAP showed less new bone than the M group, which deserves our follow-up analysis and discussion.
Figure 7. The impact of YAP expression levels and periosteum on osseointegration around the top of implants according to micro-CT analysis and HE staining 14 days after surgery. Tissues of each group were first tested by micro-CT. (a) The three-dimensional reconstruction of the implants near the neck was used for the analysis of BIC. Scale bar = 200 μm. (b) The corresponding quantitative analysis of micro-CT focused BIC parameters of every group. (c) The osteointegration around implants close to the neck part was observed through HE staining. Scale bar = 100 μm. Sample size: at least three mice for each group in every analysis. *p < 0.05; **p < 0.01; ***p < 0.001; ns, no significance.
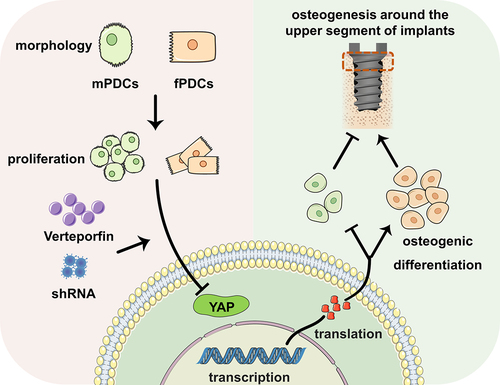
In conclusion, the results of this study suggested that mPDCs and fPDCs varied with each other both in proliferation and morphology, which subsequently might contribute to their different responses about osteogenic differentiation to the down regulation of YAP, and eventually showed discrepant impact on the osteogenesis around implants ().
Figure 8. Graphic summary of this study. Mandible periosteum derived cells and femur periosteum derived cells differed from each other in both morphology and proliferation. They showed different osteogenic responses to the downregulation of YAP cascade signaling in vitro. In vivo, the periosteum was proved to contribute to the osteointegration around implants, especially the upper segment. The downregulation of YAP in the periosteum similarly promoted the osteointegration of the upper segment implant in mandible. However, it degraded the upper segment implant osteointegration in femur.
Discussion
In previous attempts, we found that it was difficult to distinguish other soft tissues from the periosteum by mechanical dissection alone. At the same time, it was challenging to ensure the integrity of the periosteum during the operation. Eventually, the mPDCs and fPDCs have been successfully isolated with our protocol. Mechanical dissection with gentle force combined with enzymatic digestion might be a more convenient approach with better repeatability [Citation32]. Although the obtained PDCs were a heterogeneous cell population, our study showed that the majority of PDCs expressed stem cell surface markers. It was reported that PDCs were with higher cell viability and better osteogenic phenotype than BMSCs [Citation33]. Additionally, it was hard to harvest and expand enough BMSCs for experiments even in rats, according to He et al. [Citation34]. Moreover, PDCs have been proved to produce vascular endothelial growth factors, which are essential for the survival and proliferation of endothelial cells [Citation19,Citation32]. In all, PDCs have great potential for bone repairing in terms of proliferation, osteogenic differentiation, and angiogenesis promotion, especially in the mandible.
Similar to BMSCs and other stems cells that originated from different sites, PDCs of the mandible exhibited faster growth characteristics than that of the femur. Cell morphology is another important factor affecting the differentiation of stem cells [Citation35,Citation36]. In our work, the cell shape of most mPDCs was cubic, while fPDCs showed a slender shape and stretched longer. Usually, the elongated cell shape facilitates cell extension and the establishment of cell-to-cell connections. Although the morphology was not conducive to the early establishment of intercellular communication, mPDCs still exhibited superior ALP activity and high mRNA expression of ALP compared with fPDCs in the early stage. The advantages of fPDCs in terms of cell morphology might bring compensation to their osteogenic capacity at day 3, which had no significant difference from that of mPDCs. Our study found that on day 7 the osteogenic predominance of mPDCs showed again, which may result from the faster growth activity of mPDCs [Citation37]. RUNX2, as an early expressed osteogenic gene, exhibited slight differences with ALP. This may result from the initial low-level expression of RUNX2. However, the RUNX2 expression level of mPDCs was inferior to that of fPDCs and still puzzled us on day 7. The OCN expression only showed a significant difference in a later time between the two groups as an osteogenic gene expressed in the middle and late stages. What attracted our attention was the more elongated cell shape of fPDCs was contrary to their unremarkable osteogenic differentiation and calcium deposition. The optimal osteogenic differentiation, reported by a previous study, occurred when the aspect ratio was equal to two [Citation35]. Although it was easier to establish cell junctions, excessive aspect ratios are unfavorable for later osteogenesis. Given the spreading area, larger areas promoted the cell survival and expressions of osteogenic markers [Citation38,Citation39] .
Previous research illustrated the superior CKIP-1 sensitivity of orofacial bone-derived mesenchymal stem cells than long bone-derived mesenchymal stem cells [Citation18]. Our work focused on Hippo-YAP signaling, whose expression was reported a positive correlation with the osteogenesis of related cells like BMSCs [Citation40,Citation41]. It has been proved that the osteogenic ability of PDCs is superior to that of BMSCs [Citation33]. To avoid the comparison between two excellent results, the downregulation of YAP was designed for the study. This study demonstrated the distinct osteogenic effect of mPDCs and fPDCs via Hippo-YAP cascade signaling. To be specific, deficiency of YAP signaling prevented the osteogenesis of mPDCs and enhanced the osteogenic phenotype of fPDCs. This may be due to the discrepant embryonic origin of these two types of cells [Citation18,Citation42]. The mPDCs originate from the neural crest of the ectoderm, however, fPDCs are from mesenchymal cells of the mesoderm [Citation14]. Accordingly, it is speculated that stem cells from different germ layers may respond inconsistently to YAP signaling. Another possible explanation is the ways of bone formation are different between stem cells from the mandible and femur [Citation18], and downregulation of YAP signaling may affect their different osteogenesis patterns. An in vitro study confirmed the differential genes of human PDCs between different harvest sites [Citation43]. Differential regulation of PDCs from different harvest sites via the Hippo-YAP pathway may be involved, but it still needs to be supported by high-quality evidence.
The pro-reparative effect of periosteum in vivo is beyond doubt. Extensive experiments have investigated its performance in bone defect repair [Citation4,Citation44–46]. Consistent with previously reported results [Citation6], our study confirmed the role of the periosteum in osseointegration around implants. After peeling the periosteum off, there was a markable reduction in BV/TV and BIC both in the mandible and femur. The BIC reduction area was concentrated in the neck of the implant, which was close to the cortical bone because this area was indirectly contacted with the periosteum. After being transfected with the interference lentiviral vector, there was obvious declining osseointegration around the implant in both sites. And they were the worst in the micro-CT analysis and tissue quantitative RT-PCR tests. This appears to contradict in vitro results. A possible reason may be that all analyses above were based on the overall peri-implant osteogenesis. In fact, as shown in our study, the periosteum mainly contributed to the peri-implant osseointegration near the implant neck. Additionally, upregulation of the Hippo-YAP pathway has been verified, in vitro and in vivo, to promote the BMSCs’ osteogenesis and vice versa [Citation41,Citation47–49]. The deficiency of YAP in BMSCs via interference lentiviral vector may contribute to a decrease in BIC and BV/TV. Hence, another possible reason is that YAP lentiviral vector not only inhibited the YAP expression of the periosteum, but also the BMSCs. Another interesting result was that in the results of HE staining, less new bone formation was observed in the MP-YAP group than in the M group. It might also result from the downregulation of YAP signaling in both the periosteum and BMSCs. It means the implant animal model is not the optimal option to evaluate the osteogenic effect of the periosteum. When the implant models had to be designed for periosteum-related research, we tried our best to avoid the influence of BMSCs in vivo experiments to be as objective as possible. As far as the construction of the animal model in vivo, the methods were in accordance with the previous report [Citation29]. The injection of interference lentiviral vector was performed when the periosteum was not destroyed and after the implant filled the socket to avoid minimizing its impact on BMSCs. What’s more, to better evaluate the role of the periosteum on the osteointegration around implants, a further analysis focused on the neck of implants has been performed with three-dimensional images and results of HE sections. This speculation is consistent with the results in vitro. Simultaneously, more efforts should be made to figure out a more suitable research model in small animals for the follow-up exploration of peri-implant periosteal osteogenesis.
In conclusion, PDCs originated from different sites express the surface marker of stem cells and have distinct characteristics in terms of proliferation and cellular shape. Hippo-YAP signaling, as an important pathway for the cell fate decision of stem cells, has been confirmed to regulate the osteogenic differentiation of PDCs. However, inhabitation of YAP decreased the osteogenesis of mPDCs on the other hand, it increased the osteogenic expression of fPDCs. Such differences may be related to the proliferative and morphological characteristics of PDCs between different harvest sites. More studies believed that it was related to their embryonic origin and the way of bone formation. Although the periosteum contributes to osseointegration around implants, our study indicated that this contribution was mainly concentrated near the cortical bone portion. Hence, when there is a bone defect in the upper segment of the implant, the periosteum can be used to regulate the osseointegration of the implant via its site-specificity. Based on the explorations above, the understanding of the site-specificity of the periosteum has been deepened, although mainly focused on peri-implant bone repair in this study. It is conducive to the better application of PDCs in other fields, such as tissue engineering. The site-specificity of PDCs suggested considering the harvest sites when applying PDCs as seed cells in tissue engineering. Taken together, results available suggested that mPDCs may serve as more optimal seed cells for tissue engineering compared with fPDCs; however, considering their different response to YAP signaling, to ensure sufficient YAP expression in mPDCs and appropriate declining YAP expression in fPDCs may establish better osteogenesis.
Disclosure statement
No potential conflict of interest was reported by the author(s).
Data availability statement
The data that support the findings of this study are available from the corresponding author upon reasonable request.
Additional information
Funding
References
- Debnath S, Yallowitz AR, McCormick J, et al. Discovery of a periosteal stem cell mediating intramembranous bone formation. Nature. 2018;562(7725):133–139. DOI:10.1038/s41586-018-0554-8
- Ortinau LC, Wang H, Lei K, et al. Identification of functionally distinct Mx1+αSMA+ periosteal skeletal stem cells. Cell Stem Cell. 2019;25(6):784–796.e5. DOI:10.1016/j.stem.2019.11.003
- Gao B, Deng R, Chai Y, et al. Macrophage-lineage TRAP+ cells recruit periosteum-derived cells for periosteal osteogenesis and regeneration. J Clin Invest. 2019;129(6):2578–2594. DOI:10.1172/JCI98857
- Wang J, Xu J, Wang X, et al. Magnesium-pretreated periosteum for promoting bone-tendon healing after anterior cruciate ligament reconstruction. Biomaterials. 2021;268:120576.
- Lin Z, Fateh A, Salem DM, et al. Periosteum: biology and applications in craniofacial bone regeneration. J Dent Res. 2014;93(2):109–116.
- Ribeiro FV, Suaid FF, Ruiz KG, et al. Peri-implant reconstruction using autologous periosteum-derived cells and guided bone regeneration. J Clin Periodontol. 2010;37(12):1128–1136.
- Ghanmi S, Trigui M, Baya W, et al. The periosteum-like effect of fresh human amniotic membrane on bone regeneration in a rabbit critical-sized defect model. Bone. 2018;110:392–404.
- Yang G, Liu H, Cui Y, et al. Bioinspired membrane provides periosteum-mimetic microenvironment for accelerating vascularized bone regeneration. Biomaterials. 2021;268:120561.
- Dai K, Deng S, Yu Y, et al. Construction of developmentally inspired periosteum-like tissue for bone regeneration. Bone Res. 2022;10(1):1.
- Colnot C. Skeletal cell fate decisions within periosteum and bone marrow during bone regeneration. J Bone Miner Res. 2009;24(2):274–282.
- Roberts SJ, van Gastel N, Carmeliet G, et al. Uncovering the periosteum for skeletal regeneration: the stem cell that lies beneath. Bone. 2015;70:10–18.
- Chai Y, Jiang X, Ito Y, et al. Fate of the mammalian cranial neural crest during tooth and mandibular morphogenesis. Development. 2000;127(8):1671–1679.
- Quarto N, Wan DC, Kwan MD, et al. Origin matters: differences in embryonic tissue origin and Wnt signaling determine the osteogenic potential and healing capacity of frontal and parietal calvarial bones. J Bone Miner Res. 2010;25(7):1680–1694.
- Chai Y, Maxson RE Jr. Recent advances in craniofacial morphogenesis. Dev Dyn. 2006;235(9):2353–2375.
- Aghaloo TL, Chaichanasakul T, Bezouglaia O, et al. Osteogenic potential of mandibular vs. long-bone marrow stromal cells. J Dent Res. 2010;89(11):1293–1298.
- Pravitharangul A, Suttapreyasri S, Leethanakul C. Iliac and mandible osteoblasts exhibit varied responses to LMHF vibration. Cell Biol Int. 2018;42(10):1349–1357.
- Lloyd B, Tee BC, Headley C, et al. Similarities and differences between porcine mandibular and limb bone marrow mesenchymal stem cells. Arch Oral Biol. 2017;77:1–11.
- Huang X, Cheng B, Song W, et al. Superior CKIP-1 sensitivity of orofacial bone-derived mesenchymal stem cells in proliferation and osteogenic differentiation compared to long bone-derived mesenchymal stem cells. Mol Med Rep. 2020;22(2):1169–1178.
- Yang X, Jiang J, Zhou L, et al. Osteogenic and angiogenic characterization of mandible and femur osteoblasts. J Mol Histol. 2019;50:105–117.
- Wan Q, Schoenmaker T, Jansen ID, et al. Osteoblasts of calvaria induce higher numbers of osteoclasts than osteoblasts from long bone. Bone. 2016;86:10–21.
- Goldberg S, Grynpas MD, Glogauer M. Heterogeneity of osteoclast activity and bone turnover in different skeletal sites. Arch Oral Biol. 2016;71:134–143.
- Leucht P, Kim JB, Amasha R, et al. Embryonic origin and Hox status determine progenitor cell fate during adult bone regeneration. Development. 2008;135(17):2845–2854.
- Wei Q, Holle A, Li J, et al. BMP-2 signaling and mechanotransduction synergize to drive osteogenic differentiation via YAP/TAZ. Adv Sci. 2020;7(15):1902931. DOI:10.1002/advs.201902931
- Han P, Frith JE, Gomez GA, et al. Five piconewtons: the difference between osteogenic and adipogenic fate choice in human mesenchymal stem cells. ACS Nano. 2019;13(10):11129–11143.
- Yagi R, Chen LF, Shigesada K, et al. A WW domain-containing yes-associated protein (YAP) is a novel transcriptional co-activator. Embo J. 1999;18(9):2551–2562.
- Zhou R, Wu Q, Wang M, et al. The protein phosphatase PPM1A dephosphorylates and activates YAP to govern mammalian intestinal and liver regeneration. PLoS Biol. 2021;19(2):e3001122. DOI:10.1371/journal.pbio.3001122
- Sun Y, Yong KM, Villa-Diaz LG, et al. Hippo/Yap-mediated rigidity-dependent motor neuron differentiation of human pluripotent stem cells. Nat Mater. 2014;13(6):599–604.
- Yin J, Qiu S, Shi B, et al. Controlled release of FGF-2 and BMP-2 in tissue engineered periosteum promotes bone repair in rats. Biomed Mater. 2018;13(2):025001.
- Xiang L, Ma L, Wei N, et al. Effect of lentiviral vector overexpression α-calcitonin gene-related peptide on titanium implant osseointegration in α-CGRP-deficient mice. Bone. 2017;94:135–140.
- Daruich A, Le Rouzic Q, Jonet L, et al. Iron is neurotoxic in retinal detachment and transferrin confers neuroprotection. Sci Adv. 2019;5(1):eaau9940. DOI:10.1126/sciadv.aau9940
- Ohlsson C, Henning P, Nilsson KH, et al. Inducible Wnt16 inactivation: WNT16 regulates cortical bone thickness in adult mice. J Endocrinol. 2018;237(2):113–122. DOI:10.1530/JOE-18-0020
- van Gastel N, Torrekens S, Roberts SJ, et al. Engineering vascularized bone: osteogenic and proangiogenic potential of murine periosteal cells. Stem Cells. 2012;30(11):2460–2471.
- Agata H, Asahina I, Yamazaki Y, et al. Effective bone engineering with periosteum-derived cells. J Dent Res. 2007;86(1):79–83.
- He W, Zhang H, Qiu J. Osteogenic effects of bioabsorbable magnesium implant in rat mandibles and in vitro. J Periodontol. 2021;92(8):1181–1191.
- Peng R, Yao X, Ding J. Effect of cell anisotropy on differentiation of stem cells on micropatterned surfaces through the controlled single cell adhesion. Biomaterials. 2011;32(32):8048–8057.
- Scott KE, Fraley SI, Rangamani P. A spatial model of YAP/TAZ signaling reveals how stiffness, dimensionality, and shape contribute to emergent outcomes. Proc Natl Acad Sci USA. 2021;118(20). DOI:10.1073/pnas.2021571118
- Bennett CN, Ouyang H, Ma YL, et al. Wnt10b increases postnatal bone formation by enhancing osteoblast differentiation. J Bone Miner Res. 2007;22(12):1924–1932.
- Zhao Y, Sun Q, Wang S, et al. Spreading shape and area regulate the osteogenesis of mesenchymal stem cells. Tissue Eng Regen Med. 2019;16(6):573–583.
- Jiao F, Zhao Y, Sun Q, et al. Spreading area and shape regulate the apoptosis and osteogenesis of mesenchymal stem cells on circular and branched micropatterned islands. J Biomed Mater Res A. 2020;108(10):2080–2089.
- Huang Y, Xiao D, Huang S, et al. Circular RNA YAP1 attenuates osteoporosis through up-regulation of YAP1 and activation of Wnt/β-catenin pathway. Biomed Pharmacother. 2020;129:110365.
- Zhang Q, Guo Y, Yu H, et al. Receptor activity-modifying protein 1 regulates the phenotypic expression of BMSCs via the Hippo/Yap pathway. J Cell Physiol. 2019;234(8):13969–13976.
- Zhang D, Zhang S, Wang J, et al. LepR-expressing stem cells are essential for alveolar bone regeneration. J Dent Res. 2020;99(11):1279–1286. DOI:10.1177/0022034520932834
- Groeneveldt LC, Herpelinck T, Maréchal M, et al. The bone-forming properties of periosteum-derived cells differ between harvest sites. Front Cell Dev Biol. 2020;8:554984.
- Wang T, Zhang X, Bikle DD. Osteogenic differentiation of periosteal cells during fracture healing. J Cell Physiol. 2017;232(5):913–921.
- Bragdon BC, Bahney CS. Origin of reparative stem cells in fracture healing. Curr Osteoporos Rep. 2018;16(4):490–503.
- Doherty L, Wan M, Kalajzic I, et al. Diabetes impairs periosteal progenitor regenerative potential. Bone. 2021;143:115764.
- Pan JX, Xiong L, Zhao K, et al. YAP promotes osteogenesis and suppresses adipogenic differentiation by regulating β-catenin signaling. Bone Res. 2018;6:18.
- Pan H, Xie Y, Zhang Z, et al. YAP-Mediated mechanotransduction regulates osteogenic and adipogenic differentiation of BMSCs on hierarchical structure. Colloids Surf B Biointerfaces. 2017;152:344–353.
- Wang B, Wu B, Jia Y, et al. Neural peptide promotes the angiogenesis and osteogenesis around oral implants. Cell Signal. 2021;79:109873.