
ABSTRACT
Although targeting DNA-damage repair by inhibition of PARP exhibits weak or modest single-agent activity due to the existence of functional BRCA1/2 alleles, PARP inhibitors have been gradually applicable in BRCA-proficient cancers. Checkpoint kinase 1 (Chk1) inhibition selectively disrupts homologous recombination (HR)-mediated DNA repair and confers synthetic lethality in p53-deficient tumors, we therefore aim at expounding the chemopotentiating effects of Chk1 inhibition on PARPi in BRCA-proficient and p53-deficient cancer cells. Initially, BRCA wild-type, p53-null cells including AsPC-1 and H1299 demonstrated innate resistance to PARP inhibitor olaparib compared to BRCA1-mutant, p53-null MDA-MB-436 cells. We quantified the interaction between olaparib and a selective Chk1 inhibitor MK-8776, which produced synergistic effects under sub-IC50 concentrations in p53-depleted AsPC-1 and H1299 cells. Olaparib in combination with MK-8776 showed enhanced antitumor effects through prohibiting proliferation and secondarily inducing apoptosis in two cell lines. Of note, we observed that MK-8776 significantly sensitized cells to olaparib by broad DNA and chromosomal breaks. Mechanistically, MK-8776 abrogated olaparib-induced BRCA1 intranuclear foci formation, MCM7-mediated replication machineries, and ultimately triggered an accumulation of γH2AX, a well-recognized marker of DNA double-strand breaks. Additionally, we established ectopic expression of hotspot mutant p53 in H1299 cells. Introduction of p53R175 H promoted olaparib resistance as single-agent treatment, but the synergy between olaparib and MK-8776 was still achievable and the region of synergy was produced by lower combination concentrations. These data provide insight into how Chk1 inhibition could be effectively targeted and confer sensitivity to olaparib toward p53-deficient and HR-proficient cancers.
1. Introduction
DNA is susceptible to multiple forms of damage, and double-strand breaks (DSBs) are the most toxic form of DNA lesions. A network of cellular pathways that sense, signal, and repair DNA lesions, is collectively defined as the DNA damage response (DDR). Functional DDR is responsible for genomic integrity and cellular homeostasis [Citation1]. Radiation therapy and chemotherapy, to some extent, kill cancer cells via the induction of DNA damage. Consequently, cancer cells are often more reliant on DDR pathways to circumvent treatment-induced cell death. This represents a vulnerability of cancer cells to overcome radio- and chemoresistance by targeting a subset of DDR pathways. In addition, cancer cells with inherent defects of one DDR pathway are prone to utilize alternative intact DDR pathways for their survival, and suppression of these compensatory pathways offers a synthetic lethal approach to specifically kill cancer cells [Citation2] .
Cancer patients carrying a mutation or loss in the BRCA1 and BRCA2 genes show improved survival and response to inhibitors of Poly-(ADP-ribose) polymerases 1 and 2 (PARP1/2) or PARPi, as the death of cancer cells upon the synthetic lethal interactions between loss of BRCA-initiated homologous recombination (HR) repair and PARP-mediated DNA single-strand break repair [Citation3]. BRCA-likeness (or BRCAness) describes a defect in HR repair, mimicking BRCA1/2 loss, and cancer cells are sensitive to PARPi due to their BRCAness [Citation4]. Since the DNA repair defects confer vulnerability to PARP inhibition, cancer cells appear to be highly reliant on alternative DDR pathways to boost their repair capability, and hence tolerate PARPi therapy. Despite the clinical success of PARPi in cancer treatment, PARPi resistance is starting to take off through multiple mechanisms, one of which occurs via the restoration of HR [Citation5]. Pharmacologically induced BRCAness by suppression of HR-related genes represents a promising strategy to cause HR defectiveness or “HRDness” phenotype, thereby sensitizing cancer cells to PARPi [Citation6] .
Checkpoint kinase 1 (Chk1), a serine/threonine protein kinase, represents an attractive therapeutic target at the crossroad of cell cycle checkpoint surveillance, DNA replication fork stabilization, and HR repair. In particular, Chk1 is required for HR repair by phosphorylation of the HR repair factor RAD51 on Thr-309 and BRCA2 on Thr-3387 [Citation7,Citation8]. In this scenario, Chk1 inhibition may exhibit a phenotype of BRCAness and potentiate the therapeutic index of PARPi. Olaparib is a first-in-class PARPi and the first targeted treatment of patients with BRCA1/2-mutant cancers. Preclinical and clinical studies indicate that Chk1 inhibition has shown a great potential to overcome olaparib resistance in BRCA-mutant cancers [Citation9–11], but excluded BRCA-proficient cancers.
In addition to BRCA mutations, targeting DDR mechanisms focuses anticancer therapy specifically on cancer cells that already possess high levels of DNA damage due to genetic defects in p53-dependent functions, as mutated tumor suppressor TP53 gene is the most frequent alteration in human cancers [Citation12]. It has been well characterized that p53 plays an essential role in the G1 checkpoint [Citation13]. In comparison, Chk1 activity largely regulates S and G2 checkpoints upon DNA damage [Citation14]. Thus, deficiency of p53 endows cancer cells with greater dependency on Chk1-mediated checkpoints activation, and cancer cells with p53 deficiency become highly reliant on Chk1 to manage DNA damage in order to maintain cell survival. In p53-deficient cancer cells, Chk1 inhibition elicits therapeutic vulnerabilities of chemotherapy by forced mitotic entry in the presence of DNA damage [Citation15]. Therefore, defective p53 might facilitate Chk1 inhibition to trigger more pronounced cell death to tackle PARPi resistance and enhance the therapeutic index of PARPi in BRCA wild-type cancers.
PARP inhibition is selectively used for BRCA-mutated ovarian, breast, pancreatic, and prostate cancers. To date, PARPi success in the clinic has excluded BRCA-proficient cancers, and the presence of wild-type, functional BRCA allele is responsible for PARPi resistance [Citation16]. In most cases, the BRCA1/2 genes are wild-type while the p53 gene is mutated, and the synthetic lethal phenotype under PARPi/Chk1i combination therapy for BRCA-proficient and p53-deficient cancer cells is still largely unknown. Ongoing clinical trials of PARPi therapy have shifted to multiple tumor types regardless of BRCA status, including lung cancer [Citation17] . To strengthen the evidence and expand the landscape for PARPi-based therapy in p53-mutated and HR-proficient cancer cells, we used human pancreatic cancer (PC) cell-line AsPC-1 and human non-small cell lung cancer (NSCLC) cell-line H1299, in which the status of BRCA1/2 is wild-type while the p53 protein is naturally depleted. We further stably expressed mutant p53 in the H1299 cell line to validate the PARPi/Chk1i combination therapy in the presence of mutant p53. Several inhibitors of Chk1 have been developed either as single agents or in combination therapeutics. MK-8776 is a potent and more selective inhibitor of Chk1 than Chk2, and has been currently tested in clinical trials [Citation18]. In the present study, we have shown that MK-8776 can effectively sensitize olaparib in both p53-depleted and p53-mutated cells, in which BRCAness phenotypic traits were obtained. Our study attempted to refine and expand a narrow therapeutic scope of PARPi by combination therapy with Chk1i beyond BRCA-mutated cancers.
2. Materials and methods
2.1 Cell culture
Human pancreatic cancer cell-line AsPC-1 (cat. no. TCHu8), non-small-cell lung cancer cell-line NCI-H1299 (cat. no. TCHu160) and human breast cancer cell-line MDA-MB-436 (cat. no. TCHu184) were obtained from the Cell Resource Center of the Chinese Academy of Sciences (Shanghai, China). The DNA (STR) profiles of these cells within 6 months of use were authenticated by GENEWIZ, Inc (Suzhou, China) using GenePrint® 10 System (Promega). MDA-MB-436 cells were cultured in Leibovitz’s L-15 medium supplemented with 20% fetal bovine serum (FBS) and 100 μg/mL penicillin/streptomycin in 100% air incubator. The other two cell lines were cultured in RPMI-1640 medium supplemented with 10% FBS and 100 μg/mL penicillin/streptomycin. Cells were grown in monolayer cultures at a humidified 37°C, 5% CO2 incubator.
2.2 Chemicals and reagents
PARP inhibitor olaparib (AZD2281, cat. no. S1060) and selective Chk1 inhibitor MK-8776 (SCH 900,776, cat. no. S2735) were provided by Selleck Chemicals. A 50 mM stock solution was prepared in 100% DMSO and cells that were treated with equal volume of DMSO served as controls.
2.3 Cell viability assay
Cell viability was measured by the 3-(4,5-dimethyl-2-thiazolyl) −2,5- diphenyl −2 H- tetrazolium bromide (MTT) assay. Briefly, cells were plated at 5000 cells/well in 96-well plates (Wuxi NEST Biotechnology, China, cat. no. 701,001) and cultured overnight. Cells were incubated with various concentrations of olaparib (0–500 μM) or MK-8776 (0–100 μM) for 72 h. Subsequently, cells were added to 20 μL/well of 0.5 mg/mL MTT (Sigma Aldrich, cat. no. M2128) and incubated for another 4 h. The medium was carefully aspirated and replaced with 150 μL/well DMSO. After gently shaking the plate for 10 min, the optical density of the reaction solution was read at 480 nm using EnSpire multilabel plate reader (PerkinElmer).
2.4 Drug interactions analysis
Combenefit software [Citation19] was used to analyze the potential synergy between olaparib and Chk1 inhibitor after 72 h co-treatment. All data were normalized to DMSO-treated control according to the MTT assay and imported into the software. Dose–response curves (experimental data) for each individual compound were combined to generate a dose–response matrix. Deviations of each combination in the experimental data from the predicted data were assigned a percentage score, indicating the degree of either synergy or antagonism.
2.5 Colony formation assay
Briefly, 500 cells were seeded in triplicate in six-well culture plates and allowed to attach for 24 h followed by undergoing low concentrations of olaparib or/and MK-8776 treatment for 12 days. To prevent the drying and evaporation of culture media during long-term culture, media were changed and fresh drugs were added in the middle term of treatment. At the end of culture, cells were fixed and stained with crystal violet solution. The colonies were visualized and counted with ImageJ software. The colony formation efficiency was calculated as (number of colonies/number of cells inoculated) × 100%. The data were normalized to vehicle controls.
2.6 Western blot analysis
Cells were rinsed with ice-cold PBS and lyzed with RIPA buffer following treatment. After boiling protein samples in 5× loading buffer, equal amounts of protein (25 μg) were subjected to sodium dodecyl sulfate-polyacrylamide gel electrophoresis (SDS-PAGE). Separated proteins were transferred onto PVDF membranes. The membranes were blocked with 5% skim milk and probed with indicated primary antibodies overnight, including p53 (diluted 1:1000, Abcam, cat. no. ab1101), mutant p53 (diluted 1:1000, Abcam, cat. no. ab32049), phospho-Chk1-Ser345 (diluted 1:1000, CST, cat. no. 2348), Chk1 (diluted 1:1000, CST, cat. no. 2360), phospho-histone H2AX-Ser139 (diluted 1:1000, Sigma-Aldrich, cat. no. 05–636), MCM7 (CST, cat. no. 3735), BRCA1 (diluted 1:1000, Santa Cruz, cat. no. sc-6965), RAD51 (diluted 1:1000, CST, cat. no. 8875), and GAPDH (diluted 1:5000, Abcam, cat. no. ab8245). After washing, membranes were incubated with HRP-conjugated anti-rabbit or mouse second antibody (Proteintech, cat. no. SA00001–2 and SA00001–1) at a dilution of 1: 10,000 followed by enhanced chemiluminescence (Millipore, cat. no. WBKLS0500) and visualized using a ChemiDoc XRS system (Bio-Rad). All blots were quantified, and the data were expressed as fold change of the densitometry values (normalized to the loading control) compared to the treatment control using ImageJ software.
2.7 Flow cytometry analysis
For assessment of DNA replication, cells treated with olaparib or/and MK-8776 were labeled with 5-ethynyl-2’-deoxyuridine (EdU) and detected using a Click-iTTM Plus EdU Alexa Fluor 647 Flow Cytometry Kit (Molecular Probes, cat. no. C10634). Briefly, cells were incubated with 10 μM EdU for 2 h. Cells were fixed, permeabilized, and stained with the fluorescent dye azide (Click-iT reaction cocktail). DNA was stained with Hoechst dye 33342 (1 μg/mL in PBS, Molecular Probes, cat. no. H3570). EdU incorporation was evaluated by flow cytometry. For detection of cell apoptosis, cells were double stained with FITC-conjugated Annexin Vand PI. Samples were immediately analyzed by flow cytometry. Cytofluorometric acquisitions were performed on an LSRFortessa cytofluorometer (Becton Dickinson). Data were quantified using FlowJo software (Becton Dickinson).
2.8 Alkaline comet assay
Briefly, cells treated with olaparib or/and MK-8776 were harvested and detected for DNA strand breaks using a comet assay kit (Abcam, cat. no. ab238544) according to the manufacturer’s instructions. Comet agarose was dropped onto the comet slide to create a base layer. Cell suspension at a density of 2 × 10⁵ cells/mL was mixed with comet agarose and then added onto comet slide in triplicate for each group. After accelerating the gelling for 30 min at 4°C, the slides were immersed in a cold lysis buffer for 30–60 min. Following the cell lysis, the slides were submerged in prechilled alkaline solution for 30 min at 4°C, and then submerged in alkaline electrophoretic buffer (300 mM NaOH, 1 mM Na2EDTA, pH > 13). DNA electrophoresis was run at 16 V and 1 V/cm for 30 min at 4°C. Following electrophoresis, the slides were neutralized, dehydrated, dried and stained with DNA dye provided by the kit. The samples were then imaged using a fluorescence microscope. A total of 100 cells from each sample were counted randomly. The levels of % DNA in tail were quantified to assess the DNA strand breaks using ImageJ software.
2.9 Metaphase spreading assay
Briefly, cells treated with olaparib or/and MK-8776 were further treated with 0.1 μg/mL colcemid (Biological Industries, cat. no.12-004-1D) for 4 h. Cells were then trypsinized, and treated in a dropwise manner with prewarmed 0.075 M KCl. After 20 min incubation at 37°C, cells were fixed in freshly prepared methanol: acetic acid mix (3:1), and dropped onto coverslips and stained with Giemsa solution. Chromosome morphology was examined under microscopy with 100× magnification. Chromosome shape evaluation was performed with at least 20 nuclei, and the percentage of cells with aberrant chromosomes adjacent to the nuclei was analyzed.
2.10 Cell immunofluorescence assay
Immunofluorescence staining was performed using standard methods. To obtain the morphologic images of DNA damage foci, cells were seeded at 1 × 10⁵ per well in a six-well plate containing a glass coverslip in each well. After treatment, cells were fixed in precooled acetone for 15 min and rinsed three times with PBS. Cells were then permeabilized in 0.1% Triton X-100 and incubated with 1% BSA/PBS to block nonspecific antibody binding for 30 min at room temperature. Subsequently, cells were immunostained with antibodies against BRCA1 (diluted 1:200, Santa Cruz, cat. no. sc-6965) overnight at 4 ºC. Cells were incubated with goat anti-mouse IgG conjugated to Alexa Fluor 488 (Invitrogen, cat. no. A12379) following PBS washing. Nuclei were counterstained with Hoechst dye 33,342. The coverslips were mounted onto glass slides with ProLong® Gold Antifade Reagent (Molecular Probes, cat. no. P36930). For quantitative analysis, foci were counted per cell using a two-photon laser confocal microscope with 100× magnification objective lens (Zeiss LSM 880 NLO). Nuclei foci count was performed with at least 40 cells under blinded conditions and 5 foci were registered for each sample.
2.11 Database analysis
To characterize the sensitivity patterns of the cell lines with various genetic status of p53 to olaparib, we applied the multiple database including Genomics of Drug Sensitivity in Cancer (GDSC: https://www.cancerrxgene.org/) [Citation20],the cell-line projects of the Catalog Of Somatic Mutations In Cancer (COSMIC: https://cancer.sanger.ac.uk/cosmic) [Citation21] and Cellosaurus of Expasy (https://web.expasy.org/cellosaurus/) database, as well as published papers [Citation22,Citation23] as original data source to identify the molecular features of p53 in cancer cell lines and predict response to olaparib. We retrieved all the entries of drug sensitivity data and removed duplicate records, verified the p53 status in these cancer cell lines, which were divided into p53 wild-type and p53-mutated groups. The difference between olaparib sensitivity between wild-type and mutant p53 groups was determined.
2.12 Plasmids and gene transfection
The open reading frame of human TP53 sequence-verified cDNA (clone ID: 3,544,714, Dharmacon) was subcloned to pcDNA3.1(+) by BamHI (up) and NotI (down). For generation of the hot spot mutations (R175 H, R248W and R273 H) of p53, the appropriate residue of the wild-type p53 was mutated via overlapping polymerase-chain reactions using the specific mutation-containing primers and the QuikChange II XL site-directed mutagenesis kit. All the mutants were generated and fully sequenced by GENEWIZ, Inc (Suzhou, China). Transfections were performed using opti-MEM medium (Gibco, cat. no. 31,985,070) plus X-tremeGENE HP DNA transfection reagent (Roche, cat. no. 06366236001), according to the manufacturer’s directions. Single-cell clones were obtained by limiting dilution. Colonies were allowed to grow for a period of 3–4 weeks followed by Western blotting validation.
2.13 Statistical analysis
Data were presented as the means ± SD and evaluated using either two-tailed Mann–Whitney U-test or one-way analysis of variance (ANOVA) followed by post hoc Tukey’s test. * p < 0.05 was considered significant. Data analysis was performed using IBM SPSS Statistics 20.0. Scientific graphing was performed using GraphPad Prism 6.0.
3. Results
3.1 Drug interaction screening identifies effective synergy between olaparib and MK-8776 under sub-IC50 concentrations
Using olaparib and MK-8776 as a tool of PARPi and Chk1i, respectively, we initially studied their effects on p53-null/BRCA-wild type AsPC-1 and H1299 cells, as well as p53-null/BRCA1-mutant MDA-MB-436 cells [Citation24] . As shown in , AsPC-1 and H1299 cells demonstrated certain intrinsic resistant to olaparib, as the IC50 values for two cell lines at 72 h treatment were generally five-fold higher than those for MDA-MB-436 cells. In comparison, the Chk1 inhibitor MK-8776 exhibited monotherapy activity under much lower concentrations than olaparib and showed similar cytotoxicity among the three cell lines (). We further explored whether MK-8776 served as a potentiator of olaparib. Here, we quantified drug combination effects using Combenefit software. The cross-drug combination design used twofold individual IC50 values as the maximum combination concentrations. We applied the Loewe additivity, Bliss independence and Highest Single Agent (HSA) models to predict drug interactions that the expected combination effect equals to the higher effect of individual drugs [Citation19]. In both AsPC-1 and H1299 cells, we observed that the most intense region of synergy was attained across combined concentrations under sub-IC50 values (). Therefore, the data suggest that sub-IC50 concentrations of olaparib and MK-8776 are sufficient to yield synergistic effects in p53-deficient cancer cells.
Figure 1. Sub-IC50 concentrations of olaparib and Chk1 inhibitor MK-8776 generate synergy targeting two p53-deficient cancer cells. (a) Cell viability was determined by MTT assay in AsPC-1, H1299 and MDA-MB-231 cells treated with indicated concentrations of (A) olaparib (0, 31.2, 62.5, 125, 250 or 500 μM) or (b) MK-8776 (0, 6.2, 12.5, 25, 50 or 100 μM) for 72 h. (C) AsPC-1 and H1299 cells were incubated with MK-8776 (x axis) and olaparib (y axis) in an 8 × 8 concentration checkerboard format for 72 h. Cell viability was determined by MTT assay. The experiment data (left panel, values were relative cell viability compared with control) were analyzed and calculated with Combenefit software using three synergy models (Loewe, Bliss and Highest Single Agent, HSA). The predicted data were subtracted from the experimental data, yielding a final difference value for each combination. The greater a difference value was, the more synergistic that particular combination was.
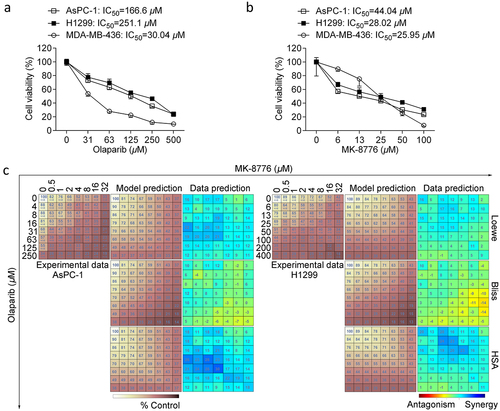
Figure 2. Effects of olaparib or/and MK-8776 on clonogenic survival, cell proliferation and apoptosis. (a) AsPC-1 and H1299 cells were incubated with low concentrations of olaparib (5 μM) or/and MK-8776 (1 μM) for 12 days. The colony forming ability was determined by a clonogenic assay. The data are presented as the mean ± SD. One way ANOVA followed by post-hoc Tukey’s analysis was performed. *, P <0.05, **, P <0.01 as indicated between two groups. (b) AsPC-1 and H1299 cells were incubated with olaparib (50 μM) or/and MK-8776 (10 μM). After 24 h treatment, cells were pulsed with 10 μM EdU for additional 2 h. EdU incorporation for DNA synthesis and cell cycle analysis was assessed in triplicate using a click reaction with Alexa Fluor 488 azide and Flow Cytometry. (c) AsPC-1 and H1299 cells were incubated with olaparib (50 μM) or/and MK-8776 (10 μM) after 72 h treatment followed by apoptosis assay.
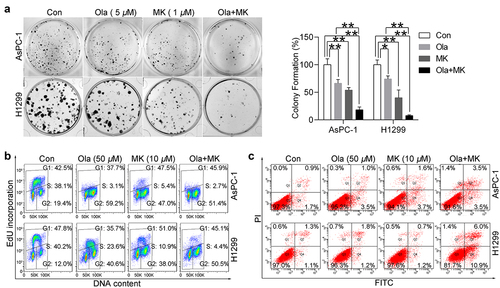
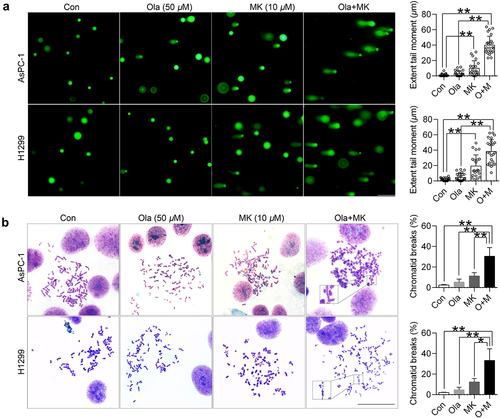
Figure 3. MK-8776 sensitizes olaparib by inducing DNA and chromosome breaks. (a) Representative images of comet formation in AsPC-1 and H1299 cells in the presence of 50 μM olaparib or/and 10 μM MK-8776. Scale bar, 200 μm. For quantification of comet assay, triplicate slides with at least 15 random fields (50 cells) were counted for tail moments. Data were expressed as the mean ± SD. One way ANOVA followed by post-hoc Tukey’s analysis was performed. *, P <0.05, **, P <0.01 as indicated between two groups. Scatter plots show all points, medians, and lower and upper quantiles. (b) Representative images of chromosomal aberrations in AsPC-1 and BxPC-3 cells were shown by the chromosome spreading assay. Scale bar, 50 μm. AsPC-1 and H1299 treated with 50 μM olaparib or/and 10 μM MK-8776 for 24 h were arrested with colcemid, fixed and metaphases processed. Cells were dropped on glass slides and stained with Giemsa. For quantification, triplicate slides with at least 20 well-spread metaphases were counted for chromosomal aberrations. Data were expressed as the mean ± SD. One way ANOVA followed by post-hoc Tukey’s analysis was performed. *, P <0.05, **, P <0.01 as indicated between two groups.
3.2 Chk1 inhibition primarily sensitizes olaparib by defects in the replication machinery
Next, we investigated whether Chk1 inhibition could enhance the anti-cancer activity of olaparib by blocking cell growth or inducing cell death. The clonogenic assay measures long-term anti-cancer effects and evaluates cell death. To this end, we incubated cells with low concentrations of olaparib (5 μM) or/and MK-8776 (1 μM), and olaparib combined with MK-8776 was more efficient in reducing clonogenic formation of two cell lines compared to single-agent (). Chk1 primarily maintains replication fork stability in response to replication stress and DNA damage [Citation25]. To scrutinize DNA synthesis during the cell cycle progress, we applied 5-Ethynyl-2’-deoxyuridine (EdU) as a thymidine analog for labeling dividing cells during S-phase. Detection of EdU incorporated into the DNA of cultured cells in combination with Hoechst staining to measure DNA content was assessed by flow cytometry. We incubated AsPC-1 and H1299 cells with olaparib or/and MK-8776 for 24 h, which was found to result in a dramatic reduction of the S-phase population and cell cycle blockage at G2 phase. In AsPC-1 cells, the proportion of S-phase cells sharply decreased from 38.1% to 3.1% upon 50 μM olaparib, and this proportion further decreased to 2.7% in combination with 10 μM MK-8776. In comparison with H1299 cells, the proportion of S-phase cells decreased from 40.2% to 23.6% upon 50 μM olaparib, and this proportion substantially decreased to 4.4% in combination with 10 μM MK-8776 (). Next, we questioned whether combination therapy could enhance the pro-apoptotic potential upon extended exposure with olaparib and MK-8776 until 72 h. Indeed, we observed that olaparib plus MK-8776 could trigger the emergence of a small proportion of apoptotic cells under nontoxic doses (). Together, these data potentially demonstrate that suppression of Chk1 activity primarily sensitizes olaparib due to an obstacle for DNA replication.
3.3 Concurrent treatment with olaparib and MK-8776 causes DNA damage and chromosome abnormalities
Chk1 activity is essential for promoting replication fork progression. The failure of checkpoint activation may result in an increased likelihood of the propagation of damaged genomes and chromosome instability by collapsed replication forks [Citation14]. Moreover, dual blockade of PARP activity and Chk1-mediated activation of HR would lead to catastrophic DNA damage. To test this hypothesis and explore the synergistic mechanisms underlying combination therapy, we investigated DNA breaks and chromosomal anomalies in the presence of olaparib and MK-8776. An alkaline comet assay was applied to assess DNA lesions characterized by broad DNA migration into the comet tail and reduced intensity in the head region [Citation26]. In line with our expectations, we observed that 50 μM olaparib did not significantly alter the extent of tail moment and 10 μM MK-8776 only triggered a slight increase in tail moment. In comparison, a significantly augmented production of comets was displayed with simultaneous treatment with olaparib and MK-8776 (). Subsequently, we applied metaphase spreads to confirm chromosomal aberrations. In agreement with the comet assay, we found MK-8776 but not olaparib, caused fragmentation of chromosomes with broken ends (indicated by the red arrows). Surprisingly, combination therapy led to a broad formation of non-recognizable, entangled chromosomes. In our view, these structural anomalies visually might be their broken ends that rejoined in the wrong way (). Thus, the chemopotentiating effect of Chk1 inhibition, at least in part, through DNA damaging-effect.
3.4 MK-8776 confers BRCAness and blocks olaparib-induced HR
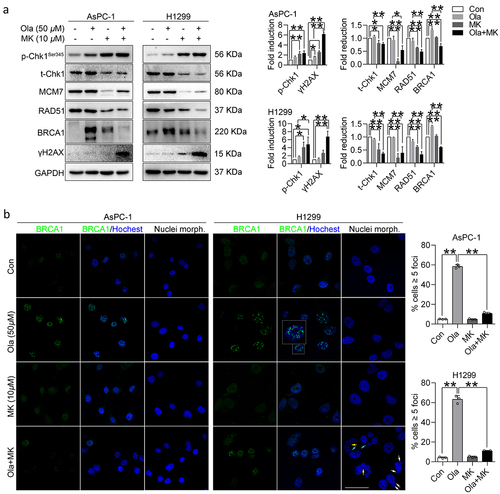
To examine whether Chk1 inhibition could induce BRCAness and impair HR in the presence of olaparib, we determined the functional molecules involved in the HR pathway. We surprisingly found olaparib could activate Chk1 activity, which was evidenced by an increased level of phosphor-Chk1 on its residue Ser-345 with intact total Chk1, a sign of replication stress. We also found a dramatic induction of p-Chk1-Ser-345 in response to 10 μM MK-8776, which has been previously established as the consequence of inhibition of autophosphorylation on residue Ser-296 [Citation27]. In addition, the stability of total Chk1 was also disrupted by MK-8776. Consistent with our expectations, olaparib promoted the expression of BRCA1 but not RAD51, and MK-8776 down-regulated and prevented these HR-related proteins in the presence of olaparib, suggesting PARP inhibition increased the reliance on Chk1-depdenent activation of replication stress and HR. Additionally, MCM7, a core component of the DNA replication apparatus, was also significantly destroyed, accompanied by the accumulation of DNA damage marker γH2AX (). Our findings were further validated by determining the nuclear loading of HR proteins. Fluorescence immunostaining of BRCA1 indicated that olaparib caused a strong pan nuclear staining pattern of BRCA1 foci, which could be completed impaired by MK-8776. Chk1 is essential for chromosome segregation and cytokinesis [Citation28]. Surprisingly, cells received combination therapy were also detected with typical nuclear abnormalities in H1299 cells. As indicated by blue, white and yellow arrows, respectively, micronuclei, nuclear buds and nucleoplasmic bridges appeared in cells exposed to olaparib plus MK-8776 (). However, the micronucleus incidence was not observed in AsPC-1 cells. As micronuclei are visible only after cell division, suggesting H1299 cells completed the first cell cycle, whereas AsPC-1 cells failed to undergo cytokinesis upon combination therapy. Taken together, our data reveal that the reactivation of HR signified by functional BRCA1 contributes to olaparib resistance, which can be rescued by Chk1 inhibitors. The formation of multinucleated cells with extensive DNA damage might be responsible for cell death.
Figure 4. MK-8776 abrogates olaparib-induced HR signaling. (a) AsPC-1 and H1299 cells were incubated with 50 μM olaparib or/and 10 μM MK-8776. After 6 h treatment, whole cell lysates were harvested for immunoblot of p-Chk1 (Ser-345), total Chk1, MCM7, RAD51, BRCA1 and γH2AX. GAPDH was used as an internal control. All densitometry data generated for blots are presented as mean ± SD by three independent experiments. Comparisons test was performed by one-way ANOVA followed by post hoc Tukey’s test. *, P <0.05, **, P <0.01 for statistical significance. (b) Representative images of pan-nuclear BRCA1 staining in p53-null cells. Cells were challenged with or without 50 μM olaparib or/and 10 μM MK-8776 for 24 h. Confocal images of indicated treatments with antibodies against BRCA1 (green). Nuclei were stained with Hoechst 33342. 1000 × magnification images, scale bar represents 50 μm. Quantification of the average number of BRCA1 foci per nucleus is plotted. Each bar represents the mean of three experiments ± SD and at least 40 cells were analyzed for each experiment. Comparisons test was performed by one-way ANOVA followed by post hoc Tukey’s test. *, P <0.05, **, P <0.01 for statistical significance.
3.5 Synergy between olaparib and MK-8776 is preserved in p53 hotspot-mutated cells
Mutant p53 is an attractive target for treating cancer, and we next asked whether MK-8776 could sensitize p53-mutated cells to olaparib. As mutant p53 can exert a dominant-negative effect on wild-type p53 [Citation29], and H1299 cells were more resistant to olaparib, we therefore introduced mutant p53 in the absence of wild-type p53 using H1299 cells. Initially, we conducted analysis of relationship between olaparib sensitivity and p53 status using public data obtained from GDSC (Supplementary Table 1). Not surprisingly, the IC50 values of olaparib in p53-mutated cell lines were significantly higher than that in p53 wild-type cell lines (). To establish H1299 cells harboring hotspot mutant p53 (R175 H, R248W, R273 H), p21 was used as an indicator of transcriptional activity of p53, and wild-type p53 rather than mutant p53 caused increased expression of p21. We also used p53 antibody DO-1, which is a mouse mAb that detects all forms of human p53, and antibody Y5, which can recognize the mutant forms of p53. Using two antibodies, we found R175 H mutation could be efficiently detected by both DO-1 and Y5 ().
Figure 5. MK-8776 synergizes with olaparibs in p53-mutant H1299 cells. (a) Olaparib sensitivity analysis by GDSC in a panel of cell lines, including 101 cell lines with normal p53 (WT) and 497 cell lines with mutated p53 (MUT). Data were expressed as the mean ± SD. Mann-Whitney U test was performed. * p < 0.05 as indicated between two groups. (b) Immunoblot confirmation of H1299 cells with various p53 status. Whole cell lysates were detected for expression of p21, wild-type and mutant p53 using DO-1 and Y5 antibody respectively. GAPDH was used as an internal control. H1299 cells were stably transfected with empty vector pcDNA3.1, wild-type p53 and mutant p53 (R175 H, R248W and R273 H), and treated wit Cell viability was determined by MTT assay in H1299-p53-R175 H cells treated with (c) Olaparib (0, 31.2, 62.5, 125, 250 or 500 μM) or (d) MK-8776 (0, 6.2, 12.5, 25, 50 or 100 μM) for 72 h. Cell viability was determined by MTT assay. (e) H1299-p53-R175 cells were incubated with MK-8776 (x axis) and olaparib (y axis) in an 8 × 8 concentration checkerboard format for 72 h. Cell viability was determined by MTT assay. The experiment data (left panel, values were relative cell viability compared with control) were analyzed and calculated with Combenefit software using three synergy models (Loewe, Bliss and Highest Single Agent, HSA).
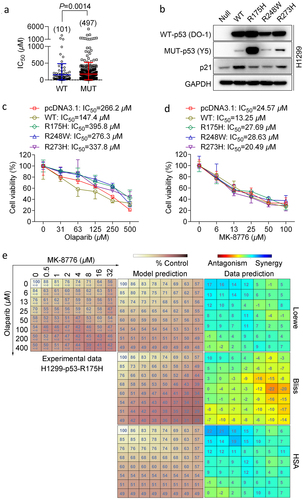
Next, we performed drug sensitivity analysis in five transfected cell strains including empty vector-transfected counterpart (pcDNA3.1). Our data showed that wild-type p53 caused increased sensitivity to olaparib, whereas cells expressed with p53 mutants were associated with lower sensitivity to olaparib (). The pattern of sensitivity of MK-8776 displayed a very low degree of variation against p53-deleted and mutated cells (). R175 H accounts for the most frequently occurring p53 mutants [Citation30], which weakened olaparib monotherapy. However, the region of synergy between olaparib and MK-877 surprisingly shifted to the upper left corner of the checkerboard format table across the lowest combination-dose regimens (). Thus, mutant p53 could lead to a resistance to olaparib treatment, but it could not confound the ability of Chk1 inhibition-mediated chemopotentiation of olaparib. Altogether, these data indicate that the p53 mutation is responsible for single agent and combinatorial drug sensitivity but not compromises the synergy of drug combination.
4. Discussion
In this study, we expanded the application of PARPi in most clinical settings characterized with p53-deficient and HR-proficient cancers by combining PARPi with Chk1 inhibition. Initially, we observed that p53-null and BRCA1/2 wild-type cells were inherently resistant to olaparib compared to p53-null and BRCA1 mutant cells, while BRCA status did not affect MK-8776 sensitivity. Primarily using H1299 cell model stably harboring mutant p53, we found that olaparib and MK-8776 produced synergistic effects under sub-IC50 concentrations, indicating that dual blockade of PARP/Chk1 pathways would be necessary for improved efficacy of olaparib in patients with functional BRCA1/2 (wild-type) or BRCA1/2 reversion mutations-mediated recovery of BRCA1/2 function [Citation31]. We have introduced that cells in which p53 is deleted or mutated might be forced to premature entry into mitosis upon Chk1 inhibition. Unlike a previous report that olaparib’s effect on the cell cycle is p53 dependent [Citation32], we observed that olaparib as single-agent treatment resulted in decreased proliferative capacity at the S phase, suggesting olaparib could induce replicative stress in cells lacking p53. In this scenario, the addition of MK-8776 promoted the entry of cells into mitosis and impaired MCM7-mediated replication apparatus potentially due to checkpoints abrogation and replication fork collapse. We also noticed that an effective synergy between Chk1 inhibition by MK-8776 and olaparib was consistent with the level of DNA lesions, chromosome fragmentation and the presence of micronucleation and aneuploidy, which is a newly identified mitotic death [Citation33]. Inadequate DNA repair under replication stress may lead to premature mitotic entry aberrant mitosis, accumulation of chromosome breaks, whole-chromosome missegregation and mitotic failure [Citation34,Citation35]. Micronuclei are biomarkers of chromosomal damage. As discussed above, we proposed that at least two distinct ways by replication catastrophe and mitotic death might be responsible for synergistic combined effects.
Our results showed that a “gain-of-function” mechanism by activation of Chk1-mdiated HR after olaparib treatment. Consistent with previous reports [Citation36,Citation37], Chk1 activity inhibition under nontoxic concentrations remarkably diminished the formation of BRCA1 foci and destabilized RAD51 proteins that were induced by olaparib. We also noticed that Chk1 inhibition by MK-8776 could destabilize Chk1 itself. This reduction of Chk1 and RAD51 levels, followed by impaired DNA repair and DNA damage, may provide an explanation, in part, for the cytotoxicity of Chk1 inhibitors as single agents or chemosensitizers. The inability of cells lacking Chk1 activity/protein and BRCA1/RAD51 loading made HR regressed, which resulted in HR dysfunction in BRCA1/2 proficient cells.
In summary, the present data can be unified in the following model. In the absence of p53, inhibition of Chk1 activity offers the G2 checkpoint adaptation in the presence of unrepairable DNA breaks upon olaparib therapy, impeding HR factors recruitment to DNA damage sites, followed by replication fork collapse, the loss of the G2/M checkpoint, allowing cells with damaged DNA to progress prematurely into M phase, and finally leading to mitotic death. Additional experimental data presented here may also be applicable in p53-mutated cells. The challenge for this study is the validity in preclinical models, including genetically matched p53 wild-type or mutant patient cohorts with wild-type BCRA1/2. Based on the complexity of DDR network, our findings may lead to therapeutic approaches using PARPi in a variety of gain-of-function in HRD tumors.
Author contributions
Yang Zhao performed the experiments and interpretation of data and contributed to the original draft of the manuscript. Kehui Zhou, Xiangyu Xia and Yajie Guo provided technical support for experiments. Li Tao designed the study, performed the statistical analysis of the data, contributed to the interpretation of the data, reviewed and edited the manuscript. Li Tao has access to and takes responsibility for the integrity of the data and for the accuracy of the data analysis.
Supplemental Material
Download MS Word (40 KB)Disclosure statement
No potential conflict of interest was reported by the author(s).
Data availability statement
The data that support the findings of this study are available from the corresponding author (Li Tao) upon reasonable request.
Supplementary material
Supplemental data for this article can be accessed online at https://doi.org/10.1080/15384101.2022.2111769
Additional information
Funding
References
- Minchom A, Aversa C, Lopez J. Dancing with the DNA damage response: next-generation anti-cancer therapeutic strategies. Ther Adv Med Oncol. 2018;10:1758835918786658.
- Roos WP, Thomas AD, Kaina B. DNA damage and the balance between survival and death in cancer biology. Nat Rev Cancer. 2016;16:20–33.
- Patel PS, Algouneh A, Hakem R. Exploiting synthetic lethality to target BRCA1/2-deficient tumors: where we stand. Oncogene. 2021;40:3001–3014.
- Rigakos G, Razis E. Brcaness: Finding the Achilles heel in ovarian cancer. Oncologist. 2012;17:956–962.
- Noordermeer SM, van Attikum H. PARP inhibitor resistance: A tug-of-war in BRCA-mutated cells. Trends Cell Biol. 2019;29:820–834.
- Zhou P, Wang J, Mishail D, et al. Recent advancements in PARP inhibitors-based targeted cancer therapy. Precision Clin Med. 2020;3:187–201.
- Sorensen CS, Hansen LT, Dziegielewski J, et al. The cell-cycle checkpoint kinase Chk1 is required for mammalian homologous recombination repair. Nat Cell Biol. 2005;7:195–201.
- Bahassi EM, Ovesen JL, Riesenberg AL, et al. The checkpoint kinases Chk1 and Chk2 regulate the functional associations between hBRCA2 and Rad51 in response to DNA damage. Oncogene. 2008;27:3977–3985.
- Kim H, George E, Ragland R, et al. Targeting the ATR/CHK1 axis with PARP inhibition results in tumor regression in BRCA-mutant ovarian cancer models. Clin Cancer Res. 2017;23:3097–3108.
- Kim H, Xu H, George E, et al. Combining PARP with ATR inhibition overcomes PARP inhibitor and platinum resistance in ovarian cancer models. Nat Commun. 2020;11:3726.
- Burgess BT, Anderson AM, McCorkle JR, et al. Olaparib combined with an ATR or Chk1 inhibitor as a treatment strategy for Acquired Olaparib-Resistant BRCA1 mutant ovarian cells. Diagnostics. 2020;10:121.
- Williams AB, Schumacher B. P53 in the DNA-Damage-Repair Process. Cold Spring Harb Perspect Med. 2016;6:a026070.
- Senturk E, Manfredi JJ. P53 and cell cycle effects after DNA damage. Methods Mol Biol. 2013;962:49–61.
- Smits VA, Gillespie DA. DNA damage control: regulation and functions of checkpoint kinase 1. Febs J. 2015;282:3681–3692.
- Parsels LA, Tanska DM, Parsels JD, et al. Dissociation of gemcitabine chemosensitization by CHK1 inhibition from cell cycle checkpoint abrogation and aberrant mitotic entry. Cell Cycle. 2016;15:730–739.
- Matsumoto K, Nishimura M, Onoe T, et al. PARP inhibitors for BRCA wild type ovarian cancer; gene alterations, homologous recombination deficiency and combination therapy. Jpn J Clin Oncol. 2019;49:703–707.
- Farago AF, Yeap BY, Stanzione M, et al. Combination olaparib and temozolomide in relapsed small-cell lung cancer. Cancer Discov. 2019;9:1372–1387.
- Guzi TJ, Paruch K, Dwyer MP, et al. Targeting the replication checkpoint using SCH 900776, a potent and functionally selective CHK1 inhibitor identified via high content screening. Mol Cancer Ther. 2011;10:591–602.
- Di Veroli GY, Fornari C, Wang D, et al. Combenefit: an interactive platform for the analysis and visualization of drug combinations. Bioinformatics. 2016;32:2866–2868.
- Yang W, Soares J, Greninger P, et al. Genomics of Drug Sensitivity in Cancer (GDSC): A resource for therapeutic biomarker discovery in cancer cells. Nucleic Acids Res. 2013;41:D955–61.
- Tate JG, Bamford S, Jubb HC, et al. COSMIC: The Catalogue of Somatic Mutations in Cancer. Nucleic Acids Res. 2019;47:D941–D7.
- Leroy B, Girard L, Hollestelle A, et al. Analysis of TP53 mutation status in human cancer cell lines: a reassessment. Hum Mutat. 2014;35:756–765.
- Berglind H, Pawitan Y, Kato S, et al. Analysis of p53 mutation status in human cancer cell lines: a paradigm for cell line cross-contamination. Cancer Biol Ther. 2008;7:699–708.
- Na B, Yu X, Withers T, et al. Therapeutic targeting of BRCA1 and TP53 mutant breast cancer through mutant p53 reactivation. NPJ Breast Cancer. 2019;5:14.
- Zhang Y, Hunter T. Roles of Chk1 in cell biology and cancer therapy. Int J Cancer. 2014;134:1013–1023.
- Clementi E, Garajova Z, Markkanen E. Measuring DNA damage using the alkaline comet assay in cultured cells. Bio Protoc. 2021;11:e4119.
- Leung-Pineda V, Ryan CE, Piwnica-Worms H. Phosphorylation of Chk1 by ATR is antagonized by a Chk1-regulated protein phosphatase 2A circuit. Mol Cell Biol. 2006;26:7529–7538.
- Peddibhotla S, Lam MH, Gonzalez-Rimbau M, et al. The DNA-damage effector checkpoint kinase 1 is essential for chromosome segregation and cytokinesis. Proc Natl Acad Sci USA. 2009;106:5159–64.29.
- Willis A, Jung EJ, Wakefield T, et al. Mutant p53 exerts a dominant negative effect by preventing wild-type p53 from binding to the promoter of its target genes. Oncogene. 2004;23:2330–2338.
- Chiang YT, Chien YC, Lin YH, et al. The function of the mutant p53-R175H in cancer. Cancers (Basel). 2021;13:4088.
- Mayor P, Gay LM, Lele S, et al. BRCA1 reversion mutation acquired after treatment identified by liquid biopsy. Gynecol Oncol Rep. 2017;21:57–60.
- Porcelli L, Quatrale AE, Mantuano P, et al. Optimize radiochemotherapy in pancreatic cancer: PARP inhibitors a new therapeutic opportunity. Mol Oncol. 2013;7:308–322.
- Castedo M, Perfettini JL, Roumier T, et al. Cell death by mitotic catastrophe: a molecular definition. Oncogene. 2004;23:2825–2837.
- Bakhoum SF, Kabeche L, Murnane JP, et al. DNA-Damage response during mitosis induces whole-chromosome missegregation. Cancer Discov. 2014;4:1281–1289.
- Wilhelm T, Said M, Naim V. DNA replication stress and chromosomal instability: dangerous liaisons. Genes (Basel). 2020;11:11.
- Do KT, Kochupurakkal B, Kelland S, et al. Phase 1 combination study of the CHK1 inhibitor Prexasertib and the PARP inhibitor olaparib in high-grade Serous ovarian cancer and other solid tumors. Clin Cancer Res. 2021;27:4710–4716.
- Mani C, Jonnalagadda S, Lingareddy J, et al. Prexasertib treatment induces homologous recombination deficiency and synergizes with olaparib in triple-negative breast cancer cells. Breast Cancer Res BCR. 2019;21:104.