
ABSTRACT
This study aimed to investigate the effects of scaffold matrix attachment region binding protein 1 (SMAR1) on the development of bladder cancer (BCa). SMAR1 expression in paired tumor and corresponding adjacent normal tissues from 55 BCa patients was detected by quantitative reverse transcription-polymerase chain reaction. BCa cells were transfected to regulate SMAR1 expression. BCa cells were treated with XAV-939, LiCl and 2-deoxyglucose. The effect of SMAR1 on the viability, proliferation, migration, invasion and Warburg effect of BCa cells was researched by counting kit-8, colony formation assay, Transwell and aerobic glycolysis assays. Western blot was performed to detect protein expression. BCa cell growth in vivo was recorded in nude mice. Immunohistochemical staining was performed for clinical and xenografted tumor tissue specimens. SMAR1 expression was down-regulated in BCa patients, associating with worse prognoses. SMAR1 knockdown enhanced the viability, proliferation, migration, invasion, EMT and Warburg effect of BCa cells. The opposite effect was found in the SMAR1 overexpression BCa cells. XAV-939 treatment reversed the elevation of β-catenin, c-Myc and Cyclin D1 proteins expression and Warburg effect in Bca cells post-SMAR1 knockdown. LiCl treatment abrogated the inhibition of β-catenin, c-Myc and Cyclin D1 proteins expression and Warburg effect proteins due to SMAR1 overexpression in BCa cells. SMAR1 overexpression inhibited the growth of BCa cells in vivo. SMAR1 might suppress the Wnt/β-catenin signaling pathway activity to inhibit the progression of BCa. It might be an effective treatment target for BCa.
Background
Bladder cancer (BCa) is a fatal malignancy of the urinary tract. In the last decade, the average growth rate of BCa incidence has been 4.6% and the 5-year survival rate is as low as 6% [Citation1]. As most symptoms are overlooked at an early stage and owing to the lack of effective therapeutic strategies for patients at advanced stages, the prognoses in BCa remain unfavorable [Citation2]. More than 50% of BCa patients relapse within 6–12 years after their first diagnoses [Citation3]. The higher risk of mortality still exists despite substantial improvements in treatment modalities for BCa [Citation4]. Tumor metastasis is the main cause of the high mortality rate among patients with BCa [Citation5]. Thus, it is of importance to elucidate the mechanisms underlying the progression of BCa.
Matrix-associated region-binding proteins (MARBPs) are implicated in association with multiple physiological processes, including DNA damage repair, cell cycle progression, and apoptosis [Citation6]. Scaffold matrix attachment region binding protein 1 (SMAR1), a MARBP, is located on human chromosome 16q24 and is dysregulated in human cancers, especially in higher-grade tumors [Citation7]. SMAR1 favors the immunosurveillance of tumor cells, thereby resulting in a high chance of tumor regression and tumor cell elimination [Citation8]. It increases chemotherapeutic sensitivity and reduces stemness of the osteosarcoma cells [Citation9]. In breast cancer, SMAR1 attenuates the tumorigenic potential, tumor generation in vivo, glucose utilization, and lactate production [Citation7]. Simultaneously, SMAR1 enhances the chemotherapeutic sensitivity and reduces the stemness of breast cancer stem cells [Citation10]. Moreover, SMAR1 prevents tumor progression by arresting the cell cycle at the G2/M phase, suppressing migration of endothelial cells required for angiogenesis, and attenuating the processes involved in epithelial to mesenchymal transition (EMT) [Citation11–13]. SMAR1 also suppresses tumor progression by blocking pathways related to metastasis and DNA damage repair [Citation14].
However, the effects of SMAR1 on BCa remain unknown. Herein, we aimed to investigate the effects of SMAR1 on BCa progression through in vitro and in vivo assays. Taye et al. [Citation15] indicate that SMAR1 weakens the migration and invasion of colorectal cancer cells by inhibiting the activity of the Wnt/β-catenin signaling pathway. The Wnt/β-catenin signaling pathway is activated in BCa, while its inhibition is not conducive to proliferation, migration, invasion, and EMT of BCa cells [Citation16]. Therefore, we also examined whether SMAR1 affected BCa progression by regulating the activity of the Wnt/β-catenin signaling pathway.
Methods
Patients and sample collection
Paired BCa tissues and corresponding adjacent normal tissues were obtained from 55 BCa patients admitted to The Sixth Affiliated Hospital of Wenzhou Medical University. These patients were first diagnosed with BCa between December 2019 and November 2020; they had no history of undergoing cancer-related treatment. Tissues were obtained during surgery. After washing with sterile phosphate-buffered saline (PBS) buffer, the tissues were immediately stored at ‑80°C until further use. The clinicopathological characteristics of the 55 BCa patients were recorded.
The study design was approved by the ethics committee of The Sixth Affiliated Hospital of Wenzhou Medical University and complied with the Declaration of Helsinki. All patients provided signed written informed consent.
Quantitative reverse transcription-polymerase chain reaction (qRT-PCR)
Total RNA from clinical tissues of the patients with BCa were extracted using Trizol reagent (Solarbio, Beijing, China) according to the manufacturer’s instructions. A reverse transcription reaction (1 μg of total RNA) was performed to synthesize the cDNA template using reverse transcriptase (Solarbio, Beijing, China). The conditions for the reverse transcription reaction were 42°C for 60 min and 72°C for 10 min. qRT-PCR was performed using the SYBR Green (Bio-Rad) kit according to the following conditions: 95°C for 45 s; 60°C for 30 s; 72°C for 45 s. The reaction was set at 40 cycles. The primer sequences for SMAR1 and glyceraldehyde-3-phosphate dehydrogenase (GAPDH) were as follows: SMAR1 sense 5′-CTTGCGGTTGGATAGCATTGA-3′andantisense5′-GCTGCTTGTTCGTGACCAGAT-3′; GAPDH sense 5′-TGCACCACCAACTGCTTAGC-3′ and antisense 5′-GGCATGGACTGTGGTCATGAG-3′. The relative mRNA expression of SMAR1 was normalized with that of GAPDH and estimated using the 2-ΔΔCt method.
Cell lines
BCa cell lines (RT4, J82, T24, and SW780) and normal bladder epithelial cell line, SV-HUC-1, were purchased from the American Type Culture Collection (ATCC, Manassas, Virginia, USA). All the five cell lines were maintained in Dulbecco’s modified Eagle’s medium (DMEM) supplemented with 10% fetal bovine serum (FBS), at 37°C, 5% CO2.
Cell transfection
SMAR1 siRNA and siRNA negative control (NC) sequence constructs were synthesized by Genechem (Shanghai, China). A full-length SMAR1 expression vector was constructed by cloning the SMAR1 cDNA fragments into the pcDNA3.1 vector (Shanghai, China). J82 cells were seeded into 6-well plates (1 × 10⁶ cells) having serum-free DMEM (1 mL) and were transfected using the SMAR1 siRNA or siRNA NC constructs. The pcDNA3.1-SMAR1 and pcDNA3.1 empty vectors were separately transfected into T24 cells. Transfection was performed using Lipofectamine 3000 (Thermo Fisher Scientific, Waltham, MA, USA) according to the manufacturer’s instructions. After 8 h of transfection, cells were incubated in DMEM supplemented with 10% FBS for 48 h at 37°C and 5% CO2.
Treatment with inhibitor or activator of Wnt/β-catenin signaling pathway or glycolysis inhibitor orgalactose
J82 cells stably transfected with SMAR1 siRNA were treated for 48 h in DMEM containing 10% FBS and XAV-939 (10 nM, an inhibitor of Wnt/β-catenin signaling pathway) at 37°C and 5% CO2. Additionally, T24 cells stably transfected with pcDNA3.1-SMAR1 vector were incubated for 48 h in DMEM containing 10% FBS and LiCl (10 nM, an activator of Wnt/β-catenin signaling pathway) [Citation17]. Moreover, the transfected J82 and T24 cells were treated by DMEM containing 10% FBS and 1 mM 2-deoxyglucose (2-DG) [Citation18] for 48 h at 37°C and 5% CO2. For galactose treatment, the transfected J82 and T24 cells were cultured by DMEM containing galactose (rather than glucose).
Cell counting kit-8 (CCK-8) assay
The proliferation of J82 and T24 cells was detected by the CCK-8 assay. Briefly, J82 and T24 cells were seeded into 96-well plates (1 × 10⁵ cells) and maintained in 100 μL DMEM (10% FBS) at 37°C and 5% CO2. After culturing for 24, 48, and 72 h, the CCK-8 reagent (10 μL) was added, and cells were treated for 4 h at 37°C. The value of optical density (OD) was measured using a porous microplate reader (BioTek, Winooski, VT, USA) at 450 nm. Five replicate wells were set for each group of cells.
Colony formation experiment
J82 and T24 cells were harvested and suspended in DMEM with 10% FBS (1 × 10⁴ cells/mL). A total of 1 mL of cell suspension was seeded into 6-well plates and cultured for 14 consecutive days at 37°C and 5% CO2. The medium in each well was changed every third day after discarding the old media. Cells adhered to the bottom of each well were fixed with 4% paraformaldehyde and stained using 0.1% crystal violet reagent. The colony number was counted under a microscope; more than 50 cells clustered together were considered as one colony.
Transwell experiment
J82 and T24 cells were suspended in DMEM without FBS (1 × 10⁶ cells/mL). A total of 500 μL cell suspension was seeded into the upper chamber coated with (or without) Matrigel. DMEM with 20% FBS (600 μL) was added into the lower chamber. Cells were cultured for 24 h at 37°C and 5% CO2. Cells in the lower chamber were fixed with 4% paraformaldehyde and stained using 0.1% crystal violet solution. The migration and invasion of cells were determined by counting five random fields of view under a microscope.
Aerobic glycolysis
J82 and T24 cells of each group were cultured for 48 h at 37°C and 5% CO2. Then cells were collected to detected the glucose 6-phosphate (G6P) level, glucose consumption, lactate and adenosine triphosphate (ATP) production by respectively using G6P assay kit (S0185, Beyotime, Shanghai, China), glucose assay kit (S0201S, Beyotime, Shanghai, China), lactate assay kit (K607–100, Amyjet Scientific, Wuhan, China) and ATP assay kit (KA1661, Amyjet Scientific, Wuhan, China). The detection procedure was implemented in line with the instructions of the kits. Moreover, glucose (10 mM) as added into each well at the indicated time points to research the oxygen consumption rate (OCR), extracellular acidification rate (ECAR) and glycolytic flux by using the Seahorse XF96 Flux Analyzer (Seahorse Bioscience, Billerica, Massachusetts, USA). The operation was carried out in accordance with the manufacturer’s instructions.
Western blot
Total proteins were extracted after incubating cells with lysis buffer (Boster, Wuhan, China). Total protein concentrations were detected using the BCA kit (Beyotime, Shanghai, China). Sodium dodecyl sulfate-polyacrylamide gel electrophoresis (SDS-PAGE) was performed using 40 μg of the total proteins sample. After transferring the separated proteins onto polyvinyl difluoride (PVDF) membranes, the membranes were blocked using a 5% bovine serum albumin (BSA) solution. Rabbit anti-primary antibodies (12 h at 4°C) and horseradish peroxidase (HRP)-conjugated goat anti-rabbit secondary antibody (2 h at room temperature) were used successively to probe proteins on the PVDF membranes. Rabbit anti-primary antibodies were as follows: anti-SMAR1 (1:1000, 204,110-T02, Sino Biological, Beijing, China), E-cadherin (1:1000, ab15148, Abcam, Cambridge, MA, USA), N-cadherin (1:1000, ab18203, Abcam, Cambridge, MA, USA), Bax (1:1000, ab53154, Abcam, Cambridge, MA, USA), Bcl2 (1:1000, ab59348, Abcam, Cambridge, MA, USA), glucose transporter type 1 (GLUT1) (1:1000, ab15309, Abcam, Cambridge, MA, USA), phosphofructokinase (PFK) (1:1000, BYFG-70 R -13,427, Fishreag Biotechnology, Nanjing, China), β-catenin (1:1000, ab16051, Abcam, Cambridge, MA, USA), c-Myc (1:1000, ab152146, Abcam, Cambridge, MA, USA), Cyclin D1 (1:1000, ab226977, Abcam, Cambridge, MA, USA) and GAPDH (1:1000, ab9485, Abcam, Cambridge, MA, USA). HRP-conjugated goat anti-rabbit secondary antibody (1:5000, ab6721) was purchased from Abcam (Cambridge, MA, USA). The protein blots were visualized by enhanced chemiluminescence (Solarbio, Beijing, China). The band intensities of proteins were analyzed using the Image J software (National Institutes of Health, Bethesda, MD, USA). GAPDH was set as the control.
Animal experiments
All animal protocols were approved by the Animal Ethics Committee of The Sixth Affiliated Hospital of Wenzhou Medical University. The animal experiments were performed following the Guide for the Care and Use of Laboratory Animals.
Nude mice (six weeks old, n = 12) were purchased from the Shanghai Animal Experiment Center of the Chinese Academy of Sciences (Shanghai, China). Stably transfected T24 cells (4 × 10⁶ cells) with pcDNA3.1-SMAR1 or pcDNA3.1 empty vector constructs were suspended in 100 μL PBS. The two kinds of T24 cell suspensions were subcutaneously injected into the backs of the nude mice. Each T24 cell suspension was injected in six nude mice. Mice were reared in a sterile animal room (about 22°C) with free access to food and water. Every week, the tumor sizes were measured and volumes were calculated as (tumor length × tumor width2)/2. Four weeks post-injection, mice were euthanized and the xenografted tumor tissues were excised. The weights of xenograft tumor tissues were recorded. The xenografted tumor tissues were stored at ‑80°C until further use.
Immunohistochemistry (IHC)
Clinical and xenografted tumor tissues were sectioned into slices (5 μm in thickness) after embedding into paraffin. A series of graded ethanol solutions were used for the dehydration of slices. After incubation with antigen retrieval solution, the slices were probed with primary antibodies against Ki67 (1:200, ab15580, Cambridge, MA, USA), SMAR1 (1:200, 204,110-T02, Sino Biological, Beijing, China), and E-cadherin (1:200, ab15148, Cambridge, MA, USA) for 12 h at 4°C. Thereafter, the sections were treated with HRP-labeled goat anti-rabbit secondary antibody (1:100, ab6721, Cambridge, MA, USA) for one h at 37°C. (DAB) and hematoxylin was used to further stain these slices. After enclosing in neutral resin, the slides were observed under a microscope.
Statistical analysis
vAll data were expressed as mean ± standard deviation. GraphPad Prism 6 was used to plot graphs after statistical analyses. Analysis of the relationship between SMAR1 mRNA expression and clinical characteristics of BCa patients was performed using the χ2 test. Comparisons between two groups were made using a two-tailed Student’s t-test. One-way analysis of variance (ANOVA) with Tukey’s post hoc test was used for the comparison of multiple groups. P < 0.05 indicated a statistically significant difference. All experiments were performed at least thrice.
Results
SMAR1 is down-regulated in patients with BCa and is associated with the progression of BCa
The mRNA expression of SMAR1 in 55 paired tumor tissues and corresponding adjacent normal tissues obtained from BCa patients was detected by qRT-PCR. The results demonstrated a significantly reduced mRNA expression of SMAR1in tumor tissues relative to the adjacent normal tissues (P < 0.01) (). IHC showed fewer SMAR1 positive expression cells (brown particles) in tumor tissues relative to the adjacent normal tissues (). Analysis of the relationship between mRNA expression of SMAR1 and clinical characteristics of BCa patients is listed in . Those with a low mRNA expression of SMAR1 significantly exhibited higher pathological stages (P = 0.004), tumor grades (P = 0.017), larger tumor sizes (P = 0.005), and metastases (P = 0.011) as compared to the BCa patients with high mRNA expression of SMAR1. Western blot indicated lower protein expression of SMAR1 in BCa cell lines (RT4, J82, T24, and SW780) relative to that in the normal bladder epithelial cell line, SV-HUC-1 (P < 0.01) ().
Figure 1. SMAR1 is down-regulated in patients with BCa and is significantly associated with BCa progression. (A) mRNA expression of SMAR1 in 55 paired tumor tissues and adjacent normal tissues from BCa patients as detected by qRT-PCR. ** P <0.01. (B) Protein expression of SMAR1 in tumor tissues of BCa patients as evaluated by IHC. (C) Protein expression of SMAR1 in BCa cell lines (RT4, J82, T24, and SW780) and the normal bladder epithelial cell line, SV-HUC-1, as detected by western blot. ** P <0.01 vs. SV-HUC-1 cell line.
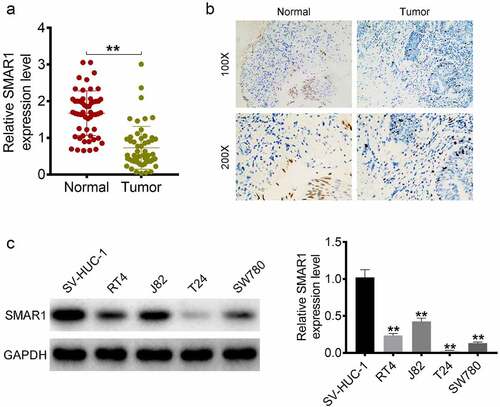
Table 1. Analysis of the relationship between SMAR1 mRNA expression and BCa patients’ clinical characteristics.
SMAR1 inhibits the proliferation, migration and invasion of BCa cells
J82 cells were transfected with the SMAR1 siRNA construct and T24 cells were transfected with the SMAR1 overexpression vector construct (). The function of SMAR1 expression on the malignant phenotype of J82 and T24 cells was then investigated by CCK-8 assay, colony formation experiment and Transwell experiment. It showed a significant increase in OD450 value, colony formation number, migration number and invasion number of the J82 cells of the siSMAR1–1 and siSMAR1–2 groups relative to the siNC group (P < 0.05 or P < 0.01). Conversely, SMAR1 overexpressing T24 cells exhibited a markedly lower OD450 value, colony formation number, migration number and invasion number than that the Vector group (P < 0.01) ().
Figure 2. SMAR1 inhibits the proliferation, migration and invasion of BCa cells. (a) Transfection efficiency of SMAR knockdown or overexpression in BCa cells. (b) the viability of BCa cells by CCK-8 assay. (c) BCa cells proliferation in colony formation experiment. (d) the migration and invasion abilities of BCa cells were evaluated by the Transwell experiment. (e) Western blot for the detection of proteins expression of E-cadherin, N-cadherin, Bcl2 and Bax in BCa cells. ** P <0.01 vs. siNC group or Vector group. # P <0.05 and ## P <0.01 vs. siNC group.
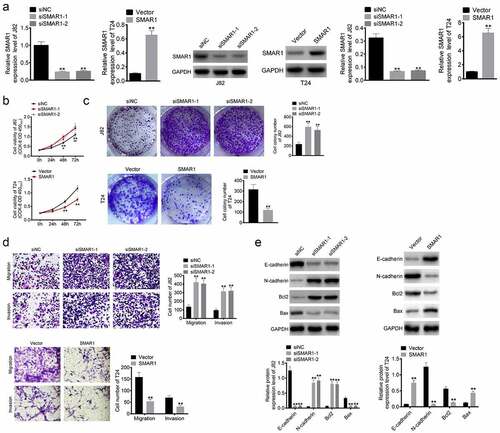
Western blot was performed to detect expression of E-cadherin, N-cadherin, Bcl2 and Bax proteins in the J82 and T24 cells. Lower protein expression of E-cadherin and Bax, while higher N-cadherin and Bcl2 levels were observed in the siSMAR1–1 and siSMAR1–2 J82 cells relative to the siNC group (P < 0.01). However, SMAR1 overexpressing T24 cells had higher protein levels of E-cadherin and Bax, and lower protein levels of N-cadherin and Bcl2 as compared to the Vector group (P < 0.01) ().
SMAR1 inhibits the migration and invasion of BCa cells by suppressing the Warburg effect
The effect of SMAR1 on the Warburg effect in BCa cells was explored. It could be discovered that, SMAR1 knockdown increased G6P level, glucose consumption, lactate and ATP production in J82 cells (P < 0.01). However, SMAR1 overexpression decreased these indicators in T24 cells (P < 0.01) (). Moreover, SMAR1 down-regulation elevated the OCR, ECAR and glycolytic flux in J82 cells, whereas SMAR1 overexpression showed the opposite results in T24 cells (P < 0.05 or P < 0.01) (). Therefore, SMAR1 could repress the Warburg effect in BCa cells.
Figure 3. SMAR1 inhibits the migration and invasion of BCa cells by suppressing the Warburg effect. (a) ELISA for the research of G6P level, glucose consumption, lactate and ATP production in BCa cells. (b, c, d) the detection of OCR, ECAR and glycolytic flux in BCa cells. (e) the detection of G6P level, glucose consumption, lactate and ATP production in 2-DG (glycolysis inhibitor) treated BCa cells by ELISA. (f) the migration and invasion abilities exploration of 2-DG treated BCa cells by Transwell experiment. (g) Western blot for the detection of proteins expression of E-cadherin, N-cadherin, Bcl2, Bax, GLUT1 and PFK in 2-DG treated BCa cells. (h) the migration and invasion abilities detection of J82 and T24 cells cultured in DMEM containing galactose (rather than glucose). * P <0.05 or ** P <0.01 vs. siNC group, Vector group, siNC +2-DG group or Vector +2-DG group.
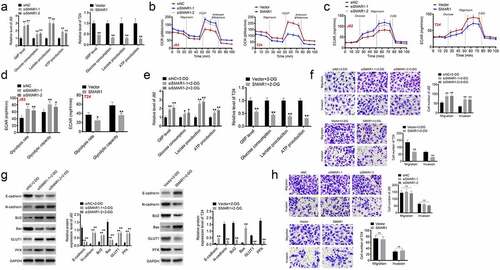
Next, this study used 2-DG (glycolysis inhibitor) to treat J82 and T24 cells. In comparison to the siNC +2-DG group, J82 cells of the siSMAR1-1 + 2-DG group and the siSMAR1-2 + 2-DG group exhibited higher G6P level, glucose consumption, lactate and ATP production (P < 0.05 or P < 0.01). Conversely, relative to the Vector +2-DG group, these indicators were all decreased in T24 cells of the SMAR1 + 2-DG group (P < 0.01) (). Transwell experiment displayed higher migration and invasion number in J82 cells of the siSMAR1-1 + 2-DG group and the siSMAR1-2 + 2-DG group when matched to the siNC +2-DG group (P < 0.01). However, lower migration and invasion number was discovered in T24 cells of the SMAR1 + 2-DG group when compared to the Vector +2-DG group (P < 0.01) (). Based on western blot, it was found lower expression of E-cadherin and Bax proteins, and higher expression of N-cadherin, Bcl2, GLUT1 and PFK proteins in J82 cells of the siSMAR1-1 + 2-DG group and the siSMAR1-2 + 2-DG group than the siNC +2-DG group (P < 0.01). On the contrary, higher expression of E-cadherin and Bax proteins, as well as lower expression of N-cadherin, Bcl2, GLUT1 and PFK proteins was observed in T24 cells of the SMAR1 + 2-DG group when matched to the Vector +2-DG group (P < 0.01) (). Intriguingly, for J82 and T24 cells cultured in DMEM containing galactose (rather than glucose), the difference in number of migration and invasion cells was not significantly among groups (). Hence, all of these above data implied that SMAR1 might inhibit the migration and invasion of BCa cells by suppressing the Warburg effect.
SMAR1 suppresses the activity of the Wnt/β-catenin signaling pathway to inhibit the Warburg effect in BCa cells
XAV-939 (an inhibitor of Wnt/β-catenin signaling pathway) and LiCl (an activator of Wnt/β-catenin signaling pathway) were used to treat J82 and T24 cells respectively. Western blot suggested that siSMAR1 J82 cells had lower protein expressions of SMAR1 and E-cadherin and higher β-catenin, c-Myc, Cyclin D1, and N-cadherin levels as compared to the siNC group (P < 0.01). However, relative to the siSMAR1 group, substantially higher level of E-cadherin protein, and lower levels of β-catenin, c-Myc, Cyclin D1, and N-cadherin proteins were observed in the siSMAR1 + XAV-939 treated J82 cells (P < 0.01). Additionally, SMAR1 overexpressing T24 cells exhibited significantly higher SMAR1 and E-cadherin protein expression, and lower protein levels of β-catenin, c-Myc, Cyclin D1, and N-cadherin than those in the Vector group (P < 0.01). In comparison with the SMAR1 group, a remarkable reduction in the protein expression of E-cadherin, and an elevation in the levels of β-catenin, c-Myc, Cyclin D1, and N-cadherin were observed in the SMAR1 + LiCl treated T24 cells (P < 0.01) ().
Figure 4. SMAR1 suppresses the activity of the Wnt/β-catenin signaling pathway in BCa cells. (a,b) the expression of proteins in the Wnt/β-catenin signaling pathway by using western blot. (c) the G6P level, glucose consumption, lactate and ATP production in BCa cells as researched by ELISA. (d,e,f) the investigation of OCR, ECAR and glycolytic flux in BCa cells. ** P <0.01 vs. siNC group or Vector group. # P <0.05 or ## P <0.01 vs. siSMAR1 group or SMAR1 group.

Western blot presented higher expression of GLUT1 and PFK proteins in J82 cells of the siSMAR1 group when compared to the siNC group and the siSMAR1 + XAV-939 group (P < 0.05or P < 0.01). Oppositely, lower expression of GLUT1 and PFK proteins was occurred in T24 cells of the SMAR1 group when matched to the Vector group and the SMAR1 + LiCl group (P < 0.01) (). Moreover, the G6P level, glucose consumption, lactate and ATP production was higher in J82 cells of the siSMAR1 group than the siNC group and the siSMAR1 + XAV-939 group (P < 0.05or P < 0.01). Conversely, these indicators were all decreased in T24 cells of the SMAR1 group when relative to the Vector group and the SMAR1 + LiCl group (P < 0.01) (). Additionally, the elevated OCR and ECAR were found in J82 cells of the siSMAR1 group, in comparison to the siNC group and the siSMAR1 + XAV-939 group (P < 0.05 or P < 0.01). On the contrary, T24 cells of the SMAR1 group exhibited the reduced OCR, ECAR and glycolytic flux than the Vector group and the SMAR1 + LiCl group (P < 0.05 or P < 0.01) (). These data suggested that SMAR1 might suppress the activity of the Wnt/β-catenin signaling pathway to inhibit the Warburg effect in BCa cells.
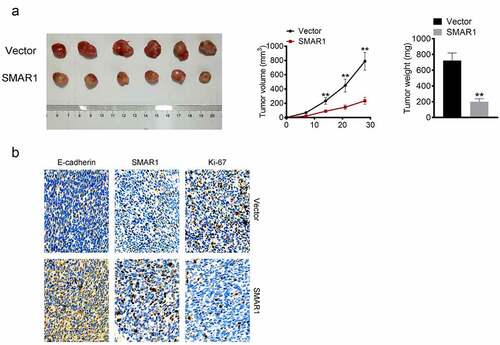
SMAR1 inhibits the growth of BCa cells in vivo
SMAR1 overexpressing T24 cells or the corresponding Vector group were injected subcutaneously into nude mice. On the 14th, 21st, and 28th-day post-injection, the mice in the SMAR1 group exhibited prominently lower tumor volumes than those in the Vector group (P < 0.01). On the 28th day post-injection, xenografted tumor tissues were excised and weighed. The tumors from mice in the SMAR1 group weighed significantly lesser relative to those from the Vector group (P < 0.01) (). IHC was performed for the xenografted tumor tissues. As shown in , in comparison of protein expression with the Vector group, lesser Ki-67, while higher SMAR1 and E-cadherin were found in the xenografted tumor tissues from the SMAR1 group.
Figure 5. SMAR1 inhibits the growth of BCa cells in vivo. (a) the volume and weight of xenografted tumor tissues. (b) Proteins expressions of Ki-67, SMAR1, and E-cadherin in xenografted tumor tissues by IHC. ** P <0.01 vs. Vector group.
Discussion
This study reports the significance of SMAR1 on the progression of BCa. Patients with BCa showed low expression of SMAR1 and this was associated with worse prognoses. SMAR1 inhibited BCa progression both in vitro and in vivo by negatively regulating the activity of the Wnt/β-catenin signaling pathway.
SMAR1 exhibits 99% homology with human BANP, mapped to the 16q24 locus [Citation19]. Previous studies show that SMAR1 is a tumor suppressor and functions in several ways, such as by repressing p65 transactivation and mediating the protein expressions of IkappaBalpha, Cytokeratin 8, and Cyclin D1 [Citation19–21]. EMT is a critical process during tumors progression, resulting in the loss of epithelial features of the cell and simultaneous acquisition of mesenchymal characteristics. The acquisition of mesenchymal characteristics allows tumor cells to obtain stronger migration and invasion capabilities [Citation3]. During EMT, levels of some genes related to cell migration, adhesion, and invasion are transcriptionally altered, especially those of E-cadherin and N-cadherin [Citation22]. The loss of E-cadherin expression is generally considered to enhance tumors metastases by facilitating tumor cell dissociation and invasion [Citation23]. E-cadherin can hinder epithelial cell dissociation from the original tumor mass, in addition to preventing the migration and invasion of tumor cells to the surrounding tissues by enhancing cell-cell adhesion and junctions [Citation23]. In contrast, N-cadherin promotes the stability of microvessels through ensheathing endothelial cells and mural cells, thereby enhancing angiogenesis and the microvascular integrity [Citation22]. A previous study reports that SMAR1-dependent inhibition of migration of breast cancer cells is associated with the up-regulation of E-cadherin [Citation13]. This paper implied that SMAR1 could suppress the migration, invasion and EMT of BCa cells. Additionally, it is well known that Bax is pro-apoptotic proteins and Bcl2 exerts anti-apoptotic function [Citation24]. This study suggested that SMAR1 enhanced Bax protein expression but reduced Bcl2 protein expression. Thus, SMAR1 might attenuate the viability, proliferation, migration and invasion by intensifying the apoptosis ability of BCa cells.
Warburg effect (also known as aerobic glycolysis) is a major characteristic metabolic phenotype of tumor cells, and an important factor for maintaining tumor growth and survival [Citation25]. GLUT1 is a member of the cell surface glucose transporter family [Citation26]. It possesses the capacity to transport glucose across the cell membrane, thererby facilitating the proliferation and metastasis of multiple tumor cells [Citation25]. PFK is a key maker of Warburg effect, which up-regulation is one of the main features of tumor malignant development [Citation27,Citation28]. In this study, SMAR1 suppressed the G6P level, glucose consumption, lactate, ATP production, OCR, ECAR and glycolytic flux, and inhibited the expression of GLUT1 and PFK in BCa cells. These data suggested that SMAR1 might suppress the progression of BCa by attenuating the Warburg effect in BCa cells.
As a classical pathway, the Wnt/β-catenin signaling transduction is involved in the development of several malignant tumors [Citation29]. The activation of the Wnt/β-catenin signaling pathway facilitates BCa progression by enhancing proliferation and EMT of BCa cells [Citation30–32]. SMAR1 can also inhibit the progression of colorectal cancer by suppressing the activity of the Wnt/β-catenin signaling pathway [Citation15]. However, whether SMAR1 regulates the development of other tumor types by regulating the activity of the Wnt/β-catenin signaling pathway, remains unclear. In this study, SMAR1 was found to inhibit the expression of β-catenin, c-Myc, and Cyclin D1 at the protein level. β-catenin, encoded by CTNNB1, is a critical intracellular signal transducer in the Wnt/β-catenin signaling pathway [Citation33]. A high expression of β-catenin can induce tumorigenic traits, exacerbate tumor cell proliferation and survival, and suppress T-cell responses, resulting in the induction of tumor progression [Citation34]. The accumulation of β-catenin is associated with progression and a worse prognosis of BCa [Citation35].
c-Myc and Cyclin D1 are the downstream effectors of the Wnt/β-catenin signaling pathway [Citation36]. c-Myc is a transcriptional regulator encoded by the proto-oncogene, myc, exerting promoting effects on tumorigenesis, angiogenesis, and tumor cell proliferation and growth [Citation37]. Inhibition of c-Myc expression can induce the reduced migration and growth of BCa cells [Citation38]. The effects of inhibition of SMAR1 on c-Myc expression in BCa cells were reported by our group. Cyclin D1 is a member of the Cyclin family, which aggravates cellular proliferation by accelerating the cell cycle progression and is closely related to tumor development and poor prognoses [Citation39,Citation40]. Cyclin D1 is also involved in the mechanisms underlying the inhibition of EMT [Citation41]. Rampalli et al. [Citation19] reported that SMAR1 can inhibit the expression of Cyclin D1 in tumors. The increased SMAR1 expression can inhibit the transition of the cell cycle from the G1 phase to the S phase by reducing the expression of Cyclin D1 [Citation42]. Similarly, SMAR1 exerted an inhibitory effect on the expression of Cyclin D1 in BCa cells. Interestingly, the application of LiCl (an activator of the Wnt/β-catenin signaling pathway) could partially reverse the inhibitory effects of SMAR1 on the activity of the Wnt/β-catenin signaling pathway and EMT. Taken together, SMAR1 attenuated proliferation, migration, invasion, and EMT of BCa cells by suppressing the activity of the Wnt/β-catenin signaling pathway.
Additionally, in this study, XAV-939 (an inhibitor of Wnt/β-catenin signaling pathway) treatment reversed the promotion of SMAR1 silencing on the Warburg effect, whereas LiCl (an activator of Wnt/β-catenin signaling pathway) treatment abrogated the inhibition of SMAR1 overexpression on the Warburg effect in BCa cells. Thus, SMAR1 might inhibit the activity of the Wnt/β-catenin signaling pathway to inhibit the Warburg effect, thereby suppressing the progression of BCa. Previous study has been proved that the activation of the Wnt/β-catenin signaling pathway could enhance the Warburg effect of tumor cells [Citation43,Citation44]. This paper showed the consistent results.
Conclusions
In conclusion, BCa cells and patients with BCa showed low expression of SMAR1. SMAR1 could inhibit proliferation, migration, invasion, EMT and Warburg effect of BCa cells in vitro. Moreover, SMAR1 suppressed the in vivo growth of BCa cells. Mechanistically, SMAR1 might inhibit the activity of the Wnt/β-catenin signaling pathway to inhibit the Warburg effect, thereby suppressing the progression of BCa. This is the first report that elucidates the function of SMAR1 in BCa progression. Thus, SMAR1 may be a novel treatment target for BCa.
Availability of data and materials
The datasets used and/or analyzed during the current study are available from the corresponding author on reasonable request.
Consent for publication
All BCa patients have signed written informed consent.
Ethics approval and consent to participate
This study has been approved by the ethics committee of The Sixth Affiliated Hospital of Wenzhou Medical University and complies with the Declaration of Helsinki.
Disclosure statement
No potential conflict of interest was reported by the author(s).
Additional information
Funding
References
- Li J, Huang S, Zhang Y, et al. LINC00460 enhances bladder carcinoma cell proliferation and migration by modulating miR-612/FOXK1 axis. Pharmacology. 2021;106(1–2):79–90. DOI:10.1159/000509255
- Zhou Q, Yu J, Zheng Q, et al. Kinesin family member 3A stimulates cell proliferation, migration, and invasion of bladder cancer cells in vitro and in vivo. FEBS Open Bio. 2021;11(5):1487–1496. DOI:10.1002/2211-5463.12768
- Zhang Z, Chen F, Zhan H, et al. lncRNA CASC9 sponges miR‑758‑3p to promote proliferation and EMT in bladder cancer by upregulating TGF‑β2. Oncol Rep. 2021;45(1):265–277. DOI:10.3892/or.2020.7852
- Li Y, et al. microRNA-27b inhibits cell proliferation and invasion in bladder cancer by targeting engrailed-2. Biosci Rep. 2021;41(1):BSR20201000.
- Tang C, Wu Y, Wang X, et al. LncRNA MAFG-AS1 regulates miR-125b-5p/sphk1 axis to promote the proliferation, migration, and invasion of bladder cancer cells. Hum Cell. 2021;34(2):588–597. DOI:10.1007/s13577-020-00470-3
- Liu HC, Ma F, Shen Y, et al. Overexpression of SMAR1 enhances radiosensitivity in human breast cancer cell line MCF7 via activation of p53 signaling pathway. Oncol Res. 2014;22(5):293–300. DOI:10.3727/096504015X14424348426035
- Choksi A, Parulekar A, Pant R, et al. Tumor suppressor SMAR1 regulates PKM alternative splicing by HDAC6-mediated deacetylation of PTBP1. Cancer Metab. 2021;9(1):16. DOI:10.1186/s40170-021-00252-x
- Alam A, Taye N, Patel S, et al. SMAR1 favors immunosurveillance of cancer cells by modulating calnexin and MHC I expression. Neoplasia. 2019;21(10):945–962. DOI:10.1016/j.neo.2019.07.002
- Xu H, Liu T, Li W, et al. SMAR1 attenuates the stemness of osteosarcoma cells via through suppressing ABCG2 transcriptional activity. Environ Toxicol. 2021;36(6):1090–1098. DOI:10.1002/tox.23108
- Bhattacharya A, et al. SMAR1 repression by pluripotency factors and consequent chemoresistance in breast cancer stem-like cells is reversed by aspirin. Sci Signal. 2020;13(654):eaay6077.
- Kaul R, Mukherjee S, Ahmed F, et al. Direct interaction with and activation of p53 by SMAR1 retards cell-cycle progression at G2/M phase and delays tumor growth in mice. Int J Cancer. 2003;103(5):606–615. DOI:10.1002/ijc.10881
- Chakraborty S, Adhikary A, Mazumdar M, et al. Capsaicin-Induced activation of p53-SMAR1 auto-regulatory loop down-regulates VEGF in non-small cell lung cancer to restrain angiogenesis. PLoS One. 2014;9(6):e99743. DOI:10.1371/journal.pone.0099743
- Adhikary A, Chakraborty S, Mazumdar M, et al. Inhibition of epithelial to mesenchymal transition by E-cadherin up-regulation via repression of slug transcription and inhibition of E-cadherin degradation: dual role of scaffold/matrix attachment region-binding protein 1 (SMAR1) in breast cancer cells. J Biol Chem. 2014;289(37):25431–25444. DOI:10.1074/jbc.M113.527267
- Paul D, Ghorai S, Dinesh US, et al. Cdc20 directs proteasome-mediated degradation of the tumor suppressor SMAR1 in higher grades of cancer through the anaphase promoting complex. Cell Death Dis. 2017;8(6):e2882. DOI:10.1038/cddis.2017.270
- Taye N, Alam A, Ghorai S, et al. SMAR1 inhibits Wnt/β-catenin signaling and prevents colorectal cancer progression. Oncotarget. 2018;9(30):21322–21336. DOI:10.18632/oncotarget.25093
- Huang H, Fan X, Zhang X, et al. LncRNA CARLo-7 facilitates proliferation, migration, invasion, and EMT of bladder cancer cells by regulating Wnt/β-catenin and JAK2/STAT3 signaling pathways. Transl Androl Urol. 2020;9(5):2251–2261. DOI:10.21037/tau-20-1293
- Wang T, Wang M, Fang S, et al. Fibulin-4 is associated with prognosis of endometrial cancer patients and inhibits cancer cell invasion and metastasis via Wnt/β-catenin signaling pathway. Oncotarget. 2017;8(12):18991–19012. DOI:10.18632/oncotarget.15086
- Kwak S, Park S-H, Kim S-H, et al. miR-3189-Targeted GLUT3 repression by HDAC2 knockdown inhibits glioblastoma tumorigenesis through regulating glucose metabolism and proliferation. J Exp Clin Cancer Res. 2022;41(1):87. DOI:10.1186/s13046-022-02305-5
- Rampalli S, Pavithra L, Bhatt A, et al. Tumor suppressor SMAR1 mediates cyclin D1 repression by recruitment of the SIN3/histone deacetylase 1 complex. Mol Cell Biol. 2005;25(19):8415–8429. DOI:10.1128/MCB.25.19.8415-8429.2005
- Singh K, Sinha S, Malonia SK, et al. Tumor suppressor SMAR1 represses IκBα expression and inhibits p65 transactivation through matrix attachment regions. J Biol Chem. 2009;284(2):1267–1278. DOI:10.1074/jbc.M801088200
- Pavithra L, Singh S, Sreenath K, et al. Tumor suppressor SMAR1 downregulates Cytokeratin 8 expression by displacing p53 from its cognate site. Int J Biochem Cell Biol. 2009;41(4):862–871. DOI:10.1016/j.biocel.2008.08.038
- Loh, C-Y., Chai, J., et al. The E-Cadherin and N-Cadherin switch in Epithelial-to-Mesenchymal transition: signaling, therapeutic implications, and challenges. Cells. 2019;8(10):1118. DOI:10.3390/cells8101118
- Na, T.Y., Schecterson, L., Mendonsa, A M., et al. The functional activity of E-cadherin controls tumor cell metastasis at multiple steps. Proc Natl Acad Sci USA. 2020;117(11):5931–5937. DOI:10.1073/pnas.1918167117
- Vávrová, J., M. Rezáčová. Importance of proapoptotic protein PUMA in cell radioresistance. Folia Biol (Praha). 2014;60(2):53–56.
- Xu, Z., Shao, J., Zheng, C., et al. The E3 ubiquitin ligase RBCK1 promotes the invasion and metastasis of hepatocellular carcinoma by destroying the PPARγ/PGC1α complex. Am J Cancer Res. 2022;12(3):1372–1392.
- Lunt, S.Y., M.G. Vander Heiden. Aerobic glycolysis: meeting the metabolic requirements of cell proliferation. Annu Rev Cell Dev Biol. 2011;27:441–464.
- Shen, J., Jin, Z., Lv, H., et al. PFKP is highly expressed in lung cancer and regulates glucose metabolism. Cell Oncol (Dordr). 2020;43(4):617–629. DOI:10.1007/s13402-020-00508-6
- Mou, J.J., Peng, J., Shi, Y-Y., et al. Mitochondrial DNA content reduction induces aerobic glycolysis and reversible resistance to drug-induced apoptosis in SW480 colorectal cancer cells. Biomed Pharmacother. 2018;103:729–737.
- Bugter, J.M., N. Fenderico. Mutations and mechanisms of WNT pathway tumour suppressors in cancer. Nat Rev Cancer. 2021;21(1):5–21.
- Zhan, Y., Zhang, L., Yu, S., et al. Long non-coding RNA CASC9 promotes tumor growth and metastasis via modulating FZD6/Wnt/β-catenin signaling pathway in bladder cancer. J Exp Clin Cancer Res. 2020;39(1):136. DOI:10.1186/s13046-020-01624-9
- Zhang, M., Du, H., Wang, Lu, et al. Thymoquinone suppresses invasion and metastasis in bladder cancer cells by reversing EMT through the Wnt/β-catenin signaling pathway. Chem Biol Interact. 2020;320:109022.
- Yoshida, T., Sopko, N A., Kates, M., et al. Three-Dimensional organoid culture reveals involvement of Wnt/β-catenin pathway in proliferation of bladder cancer cells. Oncotarget. 2018;9(13):11060–11070. DOI:10.18632/oncotarget.24308
- He, S., S. Tang. WNT/β-Catenin signaling in the development of liver cancers. Biomed Pharmacother. 2020;132:110851.
- Shang, S., F. Hua, Z.W. Hu. The regulation of β-catenin activity and function in cancer: therapeutic opportunities. Oncotarget. 2017;8(20):33972–33989.
- Urakami, S., Shiina, H., Enokida, H., et al. Epigenetic inactivation of Wnt inhibitory factor-1 plays an important role in bladder cancer through aberrant canonical Wnt/β-Catenin signaling pathway. Clin Cancer Res. 2006;12(2):383–391. DOI:10.1158/1078-0432.CCR-05-1344
- Vallée, A., Y. Lecarpentier. Crosstalk between peroxisome proliferator-activated receptor gamma and the canonical WNT/β-Catenin pathway in chronic inflammation and oxidative stress during carcinogenesis. Front Immunol. 2018;9:745.
- Fu, J., Liu, Y., Wang, X., et al. Role of DHX33 in c-Myc-induced cancers. Carcinogenesis. 2017;38(6):649–660. DOI:10.1093/carcin/bgx041
- Sun, J., Zhang, H., Tao, D., et al. CircCDYL inhibits the expression of C-MYC to suppress cell growth and migration in bladder cancer. Artif Cells Nanomed Biotechnol. 2019;47(1):1349–1356. DOI:10.1080/21691401.2019.1596941
- Mizushima, S., Sasanami, T., Ono, T., et al. Cyclin D1 gene expression is essential for cell cycle progression from the maternal-to-zygotic transition during blastoderm development in Japanese quail. Dev Biol. 2021;476:249–258.
- Wang, H., J. Wang, B. Zhao. Correlation of p16 and Cyclin D1 expression with the incidence and prognosis of cardiac carcinoma. Oncol Lett. 2019;17(6):4859–4864.
- Jiao, J., Huang, Lu, Ye, F., et al. Cyclin D1 affects epithelial-mesenchymal transition in epithelial ovarian cancer stem cell-like cells. Onco Targets Ther. 2013;6:667–677.
- Pavithra, L., Rampalli, S., Sinha, S., et al. Stabilization of SMAR1 mRNA by PGA2 involves a stem–loop structure in the 5′ UTR. Nucleic Acids Res. 2007;35(18):6004–6016. DOI:10.1093/nar/gkm649
- Wu, Z., Zhou, Z., Zhang, W., et al. MiR-21-5p inhibition attenuates Warburg effect and stemness maintenance in osteosarcoma cells via inactivation of Wnt/β-catenin signaling. Acta Biochim Pol. 2021;68(4):725–732. DOI:10.18388/abp.2020_5631
- Cha, P.H., Hwang, J-H., Kwak, D-K., et al. APC loss induces Warburg effect via increased PKM2 transcription in colorectal cancer. Br J Cancer. 2021;124(3):634–644. DOI:10.1038/s41416-020-01118-7