
ABSTRACT
Long non-coding ribonucleic acid 01555 (linc01555) is a brand-new long non-coding RNA (lncRNA) that acts a carcinogenic function in various cancers. However, its role in small cell lung cancer (SCLC) is uncertain. This research was to figure out the role of linc01555 in cisplatin (DDP) resistance of SCLC cells and its possible latent mechanism. After establishment of the resistant sub-strain H446/DDP or DMS-53/DDP, detection of linc01555, microRNA (miR)-122-5p and CLICl was done in the H446/DDP or DMS-53/DDP cell line. After intervention, cell biological functions were determined, as well as tube formation ability. The detection of angiomotin (Amot)-p130 and the validation of the regulatory mechanism were performed. Furthermore, tumor xenografts were applied in nude mice to evaluate the effect of linc01555 on DDP resistance in SCLC in vivo. Linc01555 was elevated in SCLC tissues and cells, and in H446/DDP cells or DMS-53/DDP vs. its parental cells; Restraining linc01555 or elevating miR-122-5p repressed the proliferation and metastasis of H446/DDP or DMS-53/DDP cells and vasculogenic mimicry (VM) formation. CLIC1 mediated miR-122-5p to influence the occurrence and development of SCLC. Linc01555 competitively combined with miR-122-5p, which targeted CLIC1. Refrained linc01555 elevated Amot-p130 via the miR-122-5p/CLIC1 axis. Reduced linc01555 refrained tumor growth and DDP resistance in vivo.In short, linc01555 may cause changes in DDP resistance via miR-122-5p/CLIC1 in SCLC. The finding may offer drug targets for SCLC resistance.
1. Introduction
Lung cancer (LC) is a cancer with the highest morbidity and mortality in the world. It is majorly assigned into small cell lung cancer (SCLC) and non-small cell lung cancer (NSCLC) [Citation1]. SCLC takes up approximately 15% of LC and is a minor subtype of LC [Citation2]. Owing to early and distant metastasis, SCLC is regarded as a highly aggressive malignant tumor, and most SCLC patients are in the advanced period when being diagnosed, inducing a very unpleasing prognosis [Citation3]. The rapid growth rate and resistance to chemotherapy drugs frequently cause the failure of clinical therapy of SCLC. Therefore, overcoming chemotherapy resistance has become a major challenge for SCLC.
Long non-coding RNA (lncRNA), a type of non-coding RNA, has been determined to take on a crucial modulatory role in tissue differentiation, and other biological functions [Citation4]. LncRNAs are available to control tumorigenesis and progression [Citation5]. For instance, lncRNA TUG1 modulates LIMK2b via EZH2 to take part in the cell growth and chemotherapy resistance of SCLC [Citation6]. A recent study has clarified that lncRNA is available to modulate several key oncogenes or tumor suppressor genes via lncRNA-microRNA (miRNA) or lncRNA-mRNA interactions, and influence tumor development. Hence, a deep understanding of the function of lncRNA in SCLC is vital for figuring out the latent mechanism of SCLC.
Linc01555, a newly discovered lncRNA, has been reported to be elevated in gastric cancer, and its elevation accelerates the proliferation, invasion and metastasis via the Notch signaling pathway [Citation7]. Moreover, a study has manifested that knockdown of linc01555 represses the development of CRC cells, and elevated LINC01555 accelerates invasion and metastasis of CRC cells via activating neuropeptides [Citation8]. However, the functions of linc01555 in SCLC are still ambiguous.
This study was to figure out the possible latent molecular mechanism of linc01555 in SCLC. It was discovered that linc01555 was up-regulated in SCLC tissues and cells, and its elevation was linked with unpleasing prognosis. Linc01555 knockdown repressed the development of SCLC cells and the formation of VM. In this study, it was first determined the function of linc01555 in the chemotherapy resistance of SCLC cells. Moreover, linc01555 impacted SCLC angiogenesis and chemotherapy resistance via modulating angiomotin (Amot)-p130 through the miR-122-5p/CLIC1 axis. In short, the research clarifies that linc01555 may be a brand-new latent molecular target for SCLC cure.
2. Materials and methods
2.1. Clinical data
From July 2016 to August 2019, 63 pairs of SCLC and adjacent normal tissues were collected from patients in The First Affiliated Hospital of Xi’an Jiaotong University. SCLC tissue samples were collected from cisplatin-responsive (DDP-sensitive) SCLC patients (n = 33) and DDP-non-responsive SCLC patients (n = 30). Inclusion criteria: (1) newly diagnosed SCLC patients; (2) confirmed by histopathological biopsy. Exclusion criteria: (1) Any treatment within 3 months before admission; (2) Relapsed cases; (3) Other clinical diseases. SCLC (tumor) and adjacent non-tumor lung tissue were collected from each patient by performing an MRI-guided biopsy. No radiotherapy or immunotherapy was done in patients before surgery. Fresh tissues was frozen with liquid nitrogen and stored at −80°C. Written informed consent was obtained from all patients before the study, and the research was approved by the ethics committee of The First Affiliated Hospital of Xi’an Jiaotong University [Citation9].
2.2. Tumor specimens and primary cell culture
Human SCLC cell lines (H446, H69, SHP-77, DMS-53) and normal epithelial cell line BEAS-2B were purchased from Shanghai Institute of Biochemistry and Cell Biology (Shanghai, China). Culture of these cells was done using Roswell Park Memorial Institute (RPMI) 1640 medium consisting of 10% fetal bovine serum (FBS) in a humidified incubator [Citation10]. In the laboratory, H446 or DMS-53 cells were cultured at high concentrations of DDP (0.5 μg/mL) for 12 months and maintained in complete medium consisting of DDP to establish the resistant substrains H446/DDP or DMS-53/DDP [Citation11].
2.3. Cell transfection
Linc01555 short hairpin RNA (shLinc01555, CAGAAGAATGGTACAAATVCAAG) and control (shNC) were provided by GeneChem (Shanghai, China). pcDNA3.1 consisting of the complete sequence of CLICl was obtained from GenScript (Nanjing, China). miR-122-5p mimic and inhibitor and their negative controls (NC) were obtained from GeneChem. Lipofectamine 2000 (Invitrogen, Carlsbad, CA, USA) was applied for cell transfection.
2.4. Cell counting kit 8 (CCK-8) and 50% inhibitory concentration (IC50) values
Cells were seeded in the complete medium in a 96-well tissue culture plate with a density of 3000– 12,000 cells per well. The growth medium was added with chemotherapeutic drugs (DDP solution). Drug-free medium was served as controls. Then, cells were incubated for 24 h to evaluate the cell viability. The luminescence analytical performance was in accordance with the instructions of the CCK8 manufacturer (Dojindo, Japan), and the drug IC50 values were calculated using Graphpad.
2.5. Colony formation assay
The cells (1 × 10² cells/well) in logarithmic growth were seeded in a 6-well plate and cultured in an incubator for 7 d. Then, cells were fixed with 4% paraformaldehyde, and staining with 0.1% crystal violet solution was conducted. Finally 10 fields of view randomly were selected under the microscope (Optical-SH, Shanghai, China) to calculate the colony formation number.
2.6. Flow cytometry
Annexin V-fluorescein isothiocyanate (FITC)/propidium iodide (PI) double staining kit (KA3805; Abnova, USA) was selected for observation of the cell apoptosis 48 h after transfection. In short, after centrifugation, cells were resuspended in pre-cooled phosphate buffer saline (PBS), and added with 300 μL of binding buffer. Then, 5 μL Annexin V-FITC was added for cell staining, and 5 μL PI was supplemented to the cells 5 min before detection on a flow cytometer (Cube 6; Partec, Germany). With the excitation wavelength of 480 nm and 530 nm, or over 575 nm, detection of FITC or PI was performed.
After detachment with 0.25% trypsin, cells were made into a single cell suspension and centrifuged. Next, the cells were treated with pre-cold 70% ethanol, resuspended in 100 μL PBS, and added with RNase (final concentration: 1 mg/mL). Then, cells were stained with PI solution (final concentration: 50 μg/mL). The cell cycle percentage was calculated by measuring the amount of DNA in the cell cycle at excitation wavelengths above 575 nm [Citation12].
2.7. In vitro three-dimensional test tube formation experiment
After covering each well of a 96-well plate with 90 μL of matrix, cells were resuspended in serum-free medium and seeded on the surface of the matrix. The vascular structure of cells was observed and photographed under the microscope [Citation13].
2.8. Nucleocytoplasmic separation
Cytoplasmic and nuclear RNA was extracted from H446 or DMS-53 cells [Citation14]. Cells were suspended in buffer containing 10 mM Tris-HCl (pH 7.5), 1.5 mM MgCl, 140 mM NaCl, 0.05% Igepal supplemented with complete protease inhibitor cocktail (Roche) and SUPERaseIN (Ambion). Then, cells were centrifuged to obtain supernatant and nuclear pellet. RNA was extracted using TRIzol.
2.9. Quantitative reverse transcription-PCR (RT-qPCR)
RNA was extracted from tissues or cells by TriZol reagent (Thermo) and reverse transcribed into complementary DNA (cDNA) using the Super Script III kit (Invitrogen). Subsequently, the relative expression levels were quantified using the SYBR Premix kit (Takara, Japan) and analyzed with the 2−ΔΔCt method with GAPDH or U6 as endogenous controls. All primers were from Ribo Bio (China). The primer sequences are listed in .
Table 1. RT-qPCR primer sequence.
2.10. Western blot analysis
Total protein was extracted by radioimmunoprecipitation assay (RIPA) lysis buffer (R0010; Beijing Solarbio Science & Technology Co., Ltd, Beijing, China). Proteins were separated by 10% polyacrylamide gel electrophoresis and electroblotted on nitrocellulose membranes by wet method. After blocking the membrane with 5% bovine serum albumin, the primary mouse anti-human monoclonal antibody CLIC1 (1: 1000; ab77214; Abcam), Amot-p130 (1: 1000; 43,130; Cell Signaling Technology) were added, with GAPDH (1: 2000; ab8245; Abcam) as the loading control. The membrane was then incubated with horseradish peroxidase (HRP)-labeled goat anti-mouse immunoglobulin G (IgG) (Abcam, 1:10,000, ab6785) and washed with Tris-buffered saline Tween-20. Next, it was visualized using an enhanced chemiluminescence solution (WBKLS0500, Pierce, Rockford, IL, USA) and photographed for analysis. The Alpha Digi-Doc system (Alpha Innotech) was used for gray value analysis, and the ratio of the gray value of the target band to the gray value of GAPDH was used to describe the relative expression of the protein.
2.11. The luciferase activity assay
A fragment consisting of the predicted miR-122-5p binding site from the linc01555 or CLIC1 mRNA 3-untranslated region (UTR) was PCR-amplified and cloned into the psiLinc01555 luciferase reporter vector (Promega, Madison, WI, USA). The linc01555-mut type (Mut) and CLIC1-Mut reporter genes were generated by the Quickchange XL site-directed mutagenesis kit (Agilent Technologies). Lipofectamine 2000 was applied to co-transfect 80% confluent cells in 96-well plates with a luciferase reporter vector and miR-122-5p mimic or mimic control. Luciferase activity was detected by a dual-luciferase reporter gene assay system (Promega).
2.12. RNA immunoprecipitation (RIP) assay
RIP assays were performed by the Magna RIP RNA-Binding Protein Immunoprecipitation Kit (Millipore Corporation, Billerica, MA, USA). Briefly, lysis using RIP lysis buffer of SCLC cells was performed. Then, 5 μg of argonaute 2 (Ago2) antibody or normal rabbit IgG (Millipore, MA, USA) were preincubated with magnetic beads to form magnetic bead-antibody complexes. Cell lysates were then incubated with magnetic bead-antibody complexes. Subsequently, purification of RNA from the immunoprecipitate was performed. The extracted RNA was then analyzed by RT-qPCR [Citation15].
2.13. RNA-Pull down assay
The biotinylated miR-122-5p probe and reference substance were all from GenePharma (Shanghai, China). The cell lysate was combined with M-280 streptavidin magnetic beads (Invitrogen), and detection of CLIC1 was performed using RT-qPCR [Citation16]
2.14. In vivo drug resistance model
Female athymic nude mice (Weitehe Laboratory Animal Technology Co., Ltd., Beijing, China) were housed under specific pathogen-free conditions with free access to water and housed in a restricted-access room with a 12-h light cycle and temperature-controlled. The mice were subcutaneously injected with 0.1 mL of a cell suspension consisting of 3 × 10⁶ SCLC cells into the flanks. When the tumor was measurable, the volume was measured with a caliper, and the volume calculation formula was: volume = (length × width2)/2. After 1 week, all mice were given DDP (5 mg/kg; Beijing Sun Biotechnology Co., Ltd) 5 days a week [Citation17]. Measurements of tumor volume were performed over the next few weeks. After 4 weeks, the mice were euthanized by cervical dislocation, and the tumors were removed, weighed, and stored at −80°C.
2.15. Hematoxylin-Eosin staining
Tumor tissue was excised from mice and fixed with 10% formalin to prepare paraffin slices of 5 μm. Hematoxylin-eosin staining was performed after deparaffinization and images were taken under a microscope (Olympus, Tokyo, Japan) [Citation18].
2.16. Immunohistochemistry
Tumor tissue from mice were made into paraffin slices of 4 μm sections, blocked with Then 3% H2O2, incubated with Ki67 (ab15580, 1:500 dilution, Abcam) and HRP-labeled IgG (ab6721, 1:100, Abcam), and microscopically observed [Citation19].
2.17. Statistical analysis
Data were analyzed using SPSS 21.0 (SPSS, Inc, Chicago, IL, USA) statistical software. The data were normally distributed by the Kolmogorov-Smirnov test, and the results were expressed as mean ± standard deviation (SD). The t-test was used for comparison between two groups, one-way analysis of variance (ANOVA) was for comparison between multiple groups, and Fisher’s least significant difference t test (LSD-t) was for pairwise comparison after ANOVA analysis. Enumeration data were expressed as rate or percentage, and chi-square test was used for comparative analysis. P was a two-sided test; P < 0.05 emphasized statistical significance.
3. Results
3.1. Upregulated linc01555 in SCLC
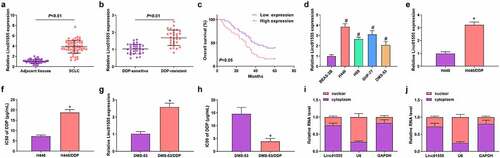
For figuring out the function of linc01555 in SCLC, SCLC and adjacent tissues were collected from the hospital. Detection of linc01555 in SCLC tissues found that linc01555 was elevated (). At the same time, in SCLC tissues, linc01555 was higher in DDP-resistant tissues compared with DDP-sensitive tissues (). Meanwhile, SCLC patients with elevated linc01555 had an unpleasing prognosis (). Furthermore, linc 01555 was elevated in SCLC cells compared to BEAS-2B cells, highest in H446 cells and lowest in DMS-53 cells (). Subsequent incubation of H446 cells or DMS-53 cells with DDP showed significantly higher levels of linco1555 in H446/DDP or DMS-53/DDP cells than in their parental cells (). To assess the DDP resistance of H446/DDP or DMS-53 cells, the IC50 of DDP was tested against H446/DDP or DMS-53/DDP cells and their parental H446 or DMS-53 cells. An increase in IC50 demonstrated that H446/DDP or DMS-53/DDP cells were resistant to DDP (. In addition, linc01555 was mainly located in the cytoplasm as determined by nucleocytoplasmic separation assay (). The above results indicated that linc01555 was elevated in SCLC tissues and cells.
Figure 1. Linc01555 is elevated in SCLC tissues and cells. (a) Linc01555 in 63 pairs of SCLC and adjacent normal tissues. (b) RT-PCR to detect linc01555 in DDP-sensitive and DDP-resistant tissues. (c) Kaplan Meier survival analysis clarified the link of linc01555 with SCLC patients’ prognosis. (d) RT-PCR analysis of linc01555 in SCLC cells. (e) qPCR detection of linc01555 in H446/DDP and parental cells. (f) CCK-8 method to detect the IC50 of DDP on H446/DDP cells and their parental H446 cells. (g) qPCR detection of linc01555 in DMS-53/DDP and parental cells. (h) CCK-8 method to detect the IC50 of DDP on DMS-53/DDP cells and their parental cells. (i, j) linc01555 distribution in H446 and DMS-53 cells. H446 and DMS-53 cells were separated into cytoplasmic and nuclear fractions, and the relative expression of linc01555 was detected by RT-qPCR. # P <0.05, vs. BEAS-2B cells; + P <0.05, vs. parental H446 cells.
3.2. Linc01555 competitively combines with miR-122-5p
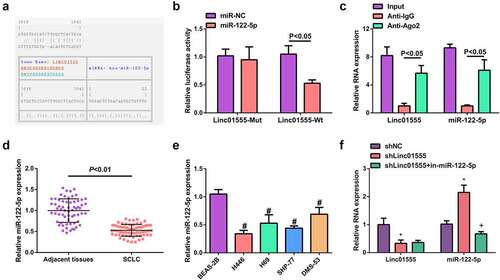
The potential binding site of linc01555 to miR-122-5p was predicted by bioinformatics analysis (). The assay showed that miR-122-5p significantly reduced the luciferase activity of linc01555-WT-transfected cells, but had no significant effect on linc01555-MUT-transfected cells (). Meanwhile, linc01555 with miR-122-5p was significantly enriched in the Ago2 immunoprecipitated fraction of cells compared with normal IgG (). In clinical tissues, miR-122-5p was downregulated in SCLC tissue samples (). Furthermore, transfection with sh-NC/linc01555 or sh-linc01555 + in-miR-122-5p was done in H446/DDP cells, elucidating that sh-linc01555 inhibited linc01555 and increased miR-122-5p expression, whereas miR-122-5p inhibitor based on sh-linc01555 transfection reduced miR-122-5p without significantly affecting linc01555 (). These results clarified that linc01555 competitively combined with miR-122-5p.
Figure 2. Linc01555 competitively absorbs miR-122-5p. (a) Bioinformatics to forecast the latent combining site of linc01555 with miR-122-5p. (b) the luciferase activity assay on cells transfected with Linc01555-WT/MUT. (c) RTq-PCR to detect the relative enrichment of linc01555 and miR-122-5p after RIP. (d, e) RT-PCR to detect miR-122-5p in SCLC tissues and adjacent tissues, SCLC cells and BEAS-2B cells. (f) RT-PCR to detect linc01555 and miR-122-5p. # P <0.05, vs. BEAS-2B cells; * P <0.05, vs. The shNC; + P <0.05, vs. The shlinc01555.
3.3. Depression of linc01555 represses the proliferation and metastasis of H446/DDP or DMS-53/DDP cells and VM formation
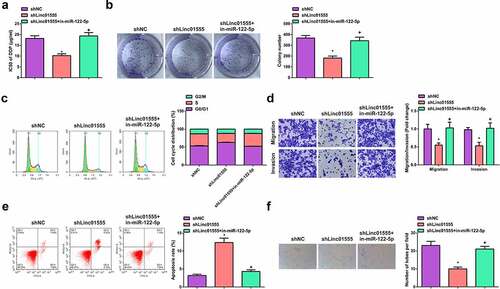
For further studying the function of linc01555 in SCLC cells, transfection of sh-NC/linc01555, sh-linc01555 + in-miR-122-5p was done in H446/DDP or DMS-53/DDP cells. The results of experiments affirmed that in H446/DDP or DMS-53/DDP cells, refraining linc01555 suppressed cell development (; Fig. S1A-F). VMs are tubular structures formed by tumor cells that can provide nutrients and participate in the control of tumor initiation and progression [Citation20]. The tube-forming effect of linc01555 on H446/DDP or DMS-53/DDP cells was observed by three-dimensional culture method, and it was found that inhibition of linc01555 significantly inhibited the tube-forming ability of VM (; Fig. S1 G). Notably, the above results were effectively reversed after the introduction of miR-122-5p inhibitors into H446/DDP or DMS-53/DDP cells. In short, suppression of linc01555 clearly depressed the proliferation and metastasis of H446/DDP or DMS-53/DDP cells.
Figure 3. Depression of linc01555 refrains the proliferation and metastasis of H446/DDP cells and VM formation. (a, b) After H446 cells treated with DDP, the IC50 value and cell proliferation detected by CCK-8 and colony formation assays. (c) the cell cycle determined by flow cytometry. (d)transwell assay for cell migration and invasion. (e) the apoptosis rate determined by flow cytometry. A-E. In the cells transfected with shlinc01555 and shlinc01555 + in-miR-122-5p; (f) Three-dimensional culture method to observe the tube formation of linc01555 on H446/DDP cells. * P <0.05, vs. The shNC; + P <0.05, vs. The shlinc01555.
3.4. MiR-122-5p refrains SCLC cell chemotherapy resistance with VM formation
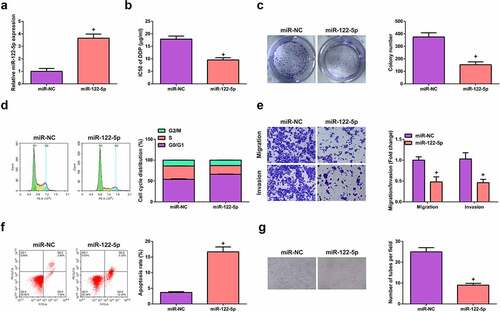
It was previously concluded that miR-122-5p is involved in mediating the effect of linc01555 on SCLC progression. Next, the role of miR-122-5p in SCLC was further investigated. H446/DDP or DMS-53/DDP cells were introduced with miR-NC/122-5p (; Fig. S2A). Functional experiments demonstrated that enhanced miR-122-5p inhibited cell development (; Supplementary ), blocked cells in G0/G1 phase, and inhibited VM tube formation (; Fig. S2 G). It is suggested that miR-122-5p inhibits SCLC proliferation and metastasis, chemoresistance and VM formation.
Figure 4. MiR-122-5p refrains SCLC cell chemotherapy resistance and VM formation. (a) Detection of cell transfection efficiency by RT-qPCR. (b, c) CCK-8 and colony formation assays to test cell proliferation. (d) Cell cycle examined by flow cytometry. (e) Cell migration and invasion detected by Transwell. (f) Flow cytometry to examine the apoptosis rate. (g) the tube formation of H446/DDP cells observed by three-dimensional culture method; + P <0.05, vs. The miR-NC.
3.5. Linc01555 targets CLIC1 in SCLC cells via sponge action of miR-122-5p
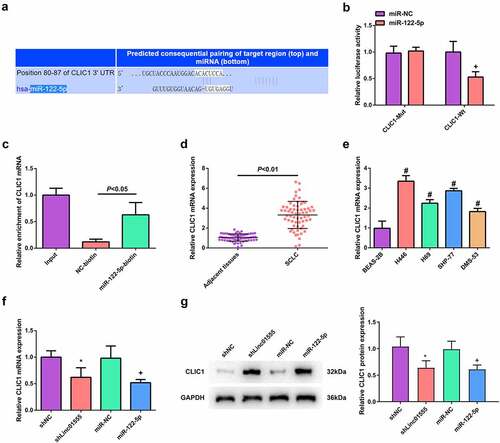
Next, the target genes of miR-122-5p were identified by Starbase. A potential binding site of miR-122-5p to CLIC1 was discovered (). Compared with NC-biotin, CLIC1 mRNA was significantly enhanced in miR-122-5p-biotin (), indicating that miR-122-5p can bind to CLIC1 immediately. At the same time, CLIC1 was elevated in SCLC tissues and cell lines (). The effects of linc01555 and miR-122-5p on CLIC1 were elucidated. Inhibition of linc01555 or induction of miR-122-5p was found to inhibit CLIC1 expression in H446/DDP cells (). Taken together, these results demonstrate that linc01555 absorbed miR-122-5p and regulated CLIC1 in SCLC H446/DDP cells.
Figure 5. Linc01555 targets CLIC1 in SCLC cells via sponging miR-122-5p. (a) Bioinformatics sites to forecast the combining sites of miR-122-5p to CLIC1. (b, c) the luciferase activity and RNA pull down assays to testify the binding of miR-122-5p to CLIC1. (d, e) CLIC1 in SCLC tissues and cell lines analyzed by qPCR. (f, g) qPCR and Western blot to detect CLIC1 after repressing linc01555 or enhancing miR-122-5p. # P <0.05, vs. BEAS-2B cells; * P <0.05, vs. The shNC; + P <0.05, vs. The miR-NC.
3.6. CLIC1 mediates miR-122-5p to affect the occurrence and development of SCLC
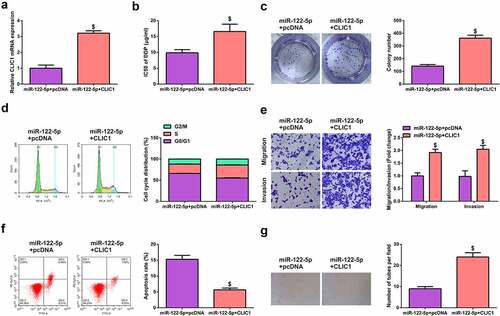
To further explore the mechanism of action between miR-122-5p and CLIC1, miR-122-5p + pcDNA was introduced into H446/DDP or DMS-53/DDP cells, and the transfection efficiency was verified (; Fig. S3A). Functional experiments elucidated that the promotion of CLIC1 reversed miR-122-5p-induced inhibition of H446/DDP or DMS-53/DDP cell development and VM tube formation (; Fig. S3B-G). This suggests that CLIC1-mediated miR-122-5p affects SCLC occurrence and development.
Figure 6. CLIC1 mediates miR-122-5p to impact the occurrence and development of SCLC. (a) Detection of cell transfection efficiency by RT-qPCR. (b, c) CCK-8 and colony formation assays to examine the proliferation of transfected cells. (d) Cell cycle detection by flow cytometry. (e) Transwell assay to test migration and invasion of transfected cells. (f) Apoptosis rate of transfected cells measured by flow cytometry. (g) Three-dimensional culture method to observe the tube formation of H446/DDP cells. $ P <0.05, vs. The miR-122-5p + pcDNA.
3.7. Repression of linc01555 up-regulates Amot-p130 via the miR-122-5p/clic1 axis
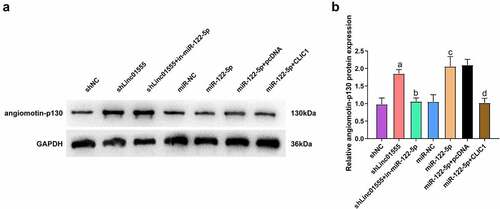
Amot-p130 can be used to inhibit the formation of angiogenic mimetics in SCLC [Citation21] In addition, one study reported that CLIC1 knockdown inhibited gastric cancer invasion and migration by upregulating AMOT-p130 [Citation22]. To verify the connection of the linc01555/miR-122-5p/CLIC1 axis to Amot-p130, Amot-p130 was detected in each group of cells. The results showed that repression of linc01555 or up-regulation of miR-122-5p could significantly elevate Amot-p130, while promotion of CLIC1 reversed the promoting effect of miR-122-5p on Amot-p130 (). Briefly, repression of linc01555 up-regulated Amot-p130 via the miR-122-5p/CLIC1 axis
Figure 7. Restraining linc01555 upregulates Amot-p130 via miR-122-5p/clic1 axis. (a, b) Western Blot to detect Amot-p130 in each group of cells. A P <0.05, vs. The shNC; b P <0.05, vs. The shLinc01555; c P <0.05, vs. The miR-NC; d P <0.05, vs. The miR-122-5p + pcDNA.
3.8. Down-Regulated linc01555 in vivo restrains tumorigenesis and DDP resistance
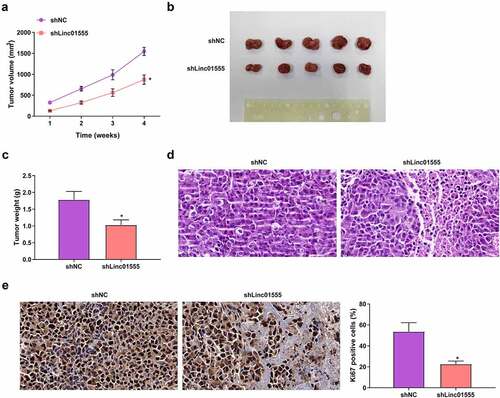
Finally, it was explored whether linc01555 could control tumor growth in vivo. To address this issue, a xenograft mouse model was established by subcutaneous injection of H446/DDP cells introduced with sh-NC or sh-Linc01555. sh-Linc01555 significantly suppressed tumor growth (). Histopathological analysis showed that tumor necrosis occurred in tumor tissue after linc01555 knockout, and no obvious pathological changes were found in tumor tissue of control group (). Immunohistochemical data showed that Ki67 levels were significantly decreased after linc01555 downregulation (). These data manifested that down-regulated linc01555 refrained tumor growth and DDP resistance in vivo.
Figure 8. Down-Regulation of linc01555 restrains tumorigenesis and DDP resistance in vivo. Measurement of tumor volume weekly; (b) Tumor images after 4 weeks; (c) Tumor weight measured 6 weeks later. (d) Histopathological changes were observed by HE staining. (e) the positive expression of Ki67 was detected by immunohistochemistry. * P <0.05, vs. The shNC.
4. Discussion
The prognosis of SCLC is still extremely poor due to early metastasis, high recurrence rate and drug resistance, but the mechanism of drug resistance remains uncertain and needs further study [Citation23]. LncRNAs are associated with chemoresistance in SCLC. For example, linc00173 modulates Etk by acting as a competing endogenous RNA (ceRNA) for miR-218 to stimulate chemoresistance and progression in SCLC [Citation24]. Linc01555, a recently discovered novel lncRNA, has been studied to be elevated in colorectal and gastric cancers. However, no studies have emphasized the role of linc01555 in SCLC. In this study, linc01555 was analyzed in 63 human SCLC tissues (33 sensitive to DDP and 30 resistant to DDP). Linc01555 was found to be significantly elevated in SCLC tissues and DDP-resistant. SCLC patients with elevated linc01555 had a poor prognosis. Therefore, this study may provide an independent prognostic factor for SCLC patients.
To explore the functional properties of linc01555 in SCLC, stable drug-resistant substrains H446/DDP and DMS-53/DDP were first established, and then sh-NC and sh-Linc01555 were transfected into H446/DDP and DMS-53/DDP cells. The results show that inhibition of linc01555 reduced H446/DDP and DMS-53/DDP cell development and VM formation. Next, we further explored the mechanism of linc01555 involved in SCLC chemoresistance. A large body of evidence confirms that lncRNAs are involved in regulatory networks as ceRNAs. Inspired by this, we speculated whether linc01555 could play the role of ceRNA in SCLC chemoresistance. To test this conjecture, bioinformatics analysis was to find the miRNAs that interact with linc01555. As we speculated, miR-122-5p was predicted to be a potential target of linc01555. Consistent with reports, miR-122-5p is abnormally expressed in a variety of human cancers, including hepatocellular carcinoma [Citation25], breast cancer [Citation26], osteosarcoma [Citation27], and nasopharyngeal carcinoma [Citation28]. It was in this study that the reduction of miR-122-5p in SCLC was identified for the first time, which is consistent with previous studies [Citation29,Citation30]. Furthermore, inhibition of linc01555 elevated miR-122-5p expression while miR-122-5p inhibitor significantly decreased miR-122-5p expression without significantly affecting linc01555. It was also confirmed that linc01555 acts as a ceRNA of miR-122-5p.
MiRNAs are linked with the occurrence and development of human cancer [Citation31], and are available to impact the sensitivity of cancer cells to anti-cancer drugs. For example, miR-495 accelerates chemoresistance in SCLC through epithelial-mesenchymal transition of Etk/BMX [Citation32]. Meanwhile, elevated miR-122-5p inhibited chemoresistance and VM formation in SCLC cells in the study. In order to further explore the molecular mechanism of miR-122-5p, Starbase was applied to discover the potential binding site of miR-122-5p and CLIC1. CLIC1 is part of the chloride channel protein family and has been implicated in a variety of human tumors [Citation33]. In the study, CLIC1 was elevated in SCLC and negatively correlated with miR-122-5p. Inhibition of linc01555 or enhancement of miR-122-5p inhibited CLIC1 expression. Taken together, these results suggest that linc01555 sponged miR-122-5p in SCLC cells and modulated CLIC1.
VM is induced by multiple genes [Citation34]. VM cells are ubiquitous in solid tumors and can be used to form new blood vessels, accelerate tumor cell proliferation and metastasis [Citation35]. Amot is an angiostatin-binding protein that regulates endothelial cell migration and angiogenesis [Citation36,Citation37]. Amot has two classical isomers, Amot-p130 and Amot-p80 [Citation38]. A previous study has shown that elevation of Amot-p130 independent of Smad2/3 signaling inhibits VM tube formation in SCLC cells, whereas its knockdown did the opposite. This study elucidated that repression of linc01555 or upregulation of miR-122-5p induced Amot-p130, whereas the increase of CLIC1 reversed this phenomenon. Briefly, repression of linc01555 up-regulated Amot-p130 via the miR-122-5p/CLIC1 axis.
In addition, in vivo experiments were performed to deeply explore the effect of linc01555 on tumor growth. Meanwhile, a xenograft mouse model was established by subcutaneous injection of H446/DDP cells introduced with sh-NC or sh-Linc01555. These data show that down-regulated linc01555 inhibited tumor growth and DDP resistance in vivo. In future studies, we hope to further clarify the effect of upregulation of miR-122-5p or knockdown of CLIC1 alone on tumor growth and DDP resistance in vivo.
5. Conclusion
In conclusion, this study shows that linc01555 is upregulated in SCLC tissues, and its elevation indicates poor prognosis in SCLC patients. Meanwhile, linc01555 mediates SCLC tumorigenesis by controlling the development of cells with angiogenesis and DDP resistance, as well as other biological functions. It was also demonstrated that linc01555 controls CLIC1 by competitively binding to miR-122-5p to upregulate Amot-p130, thereby promoting SCLC angiogenesis and DDP resistance. This study provides a new strategy for lncRNA-targeted diagnosis and treatment of SCLC.
Ethical approval
All procedures performed in this study involving human participants were in accordance with the ethical standards of the institutional and/or national research committee and with the 1964 Helsinki Declaration and its later amendments or comparable ethical standards. All subjects was approved by the First Affiliated Hospital of Xi’an Jiaotong University. The mouse experiments were approved by the Animal Welfare Committee of The First Affiliated Hospital of Xi’an Jiaotong University. All methods were performed in accordance with relevant guidelines and regulations. (No. 201,601×A576)
Supplemental Material
Download Zip (26.6 MB)Disclosure statement
No potential conflict of interest was reported by the author(s).
Supplementary material
Supplemental data for this article can be accessed online at https://doi.org/10.1080/15384101.2022.2112132
Additional information
Funding
Related Research Data
References
- Chen Y, Shen T, Ding X, et al. lncRNA MRUL suppressed non-small cell lung cancer cells proliferation and invasion by targeting miR-17-5p/srsf2 axis. Biomed Res Int. 2020;2020:9567846.
- Sun Y, Hu B, Wang Q, et al. Long non-coding RNA HOTTIP promotes BCL-2 expression and induces chemoresistance in small cell lung cancer by sponging miR-216a. Cell Death Amp Dis. 2018 Jan 24;9(2):85. DOI:10.1038/s41419-017-0113-5
- Sun Y, Zhou Y, Bai Y, et al. A long non-coding RNA HOTTIP expression is associated with disease progression and predicts outcome in small cell lung cancer patients. Mol Cancer. 2017 Oct 17;16(1):162. DOI:10.1186/s12943-017-0729-1
- Gomes AQ, Nolasco S, Soares H. Non-Coding RNAs: multi-tasking molecules in the cell. Int J Mol Sci. 2013 Jul 31;14(8):16010–16039. DOI:10.3390/ijms140816010
- Xie Y, Zhang Y, Du L, et al. Circulating long noncoding RNA act as potential novel biomarkers for diagnosis and prognosis of non-small cell lung cancer. Mol Oncol. 2018 May;12(5):648–658. DOI:10.1002/1878-0261.12188
- Niu Y, Ma F, Huang W, et al. Long non-coding RNA TUG1 is involved in cell growth and chemoresistance of small cell lung cancer by regulating LIMK2b via EZH2. Mol Cancer. 2017 Jan 9;16(1):5. DOI:10.1186/s12943-016-0575-6
- Zhao X, Zhao Z Linc01555 promotes proliferation, migration and invasion of gastric carcinoma cells by interacting with Notch signaling pathway. J Buon. 2020 Mar-Apr;25(2):1007–1012.
- Wang X, Chen X, Zhou H, et al. The long noncoding RNA, LINC01555, promotes invasion and metastasis of colorectal cancer by activating the neuropeptide, Neuromedin U. Med Sci Monit. 2019 May 30;25:4014–4024. DOI:10.12659/MSM.916508
- Liu WZ, Liang FH, Yang GY, et al. LncRNA LINC01116 sponges miR-93-5p to promote cell invasion and migration in small cell lung cancer. BMC Pulm Med. 2021;21(1):50. DOI:10.1186/s12890-020-01369-3
- Li X, Lv F, Li F, et al. Long noncoding RNA H19 facilitates small cell lung cancer tumorigenesis through miR-140-5p/fgf9 axis. Onco Targets Ther. 2020;13:3525–3534.
- Huang W, Yang Y, Wu J, et al. Circular RNA cESRP1 sensitises small cell lung cancer cells to chemotherapy by sponging miR-93-5p to inhibit TGF-β signalling. Cell Death Differ. 2020 May;27(5):1709–1727. DOI:10.1038/s41418-019-0455-x
- Jia Y, Zhao J, Yang J, et al. miR-301 regulates the SIRT1/SOX2 pathway via CPEB1 in the breast cancer progression. Mol Ther Oncolytics. 2021 Sep 24;22:13–26. DOI:10.1016/j.omto.2021.03.007
- Yu S, Ruan X, Liu X, et al. HNRNPD interacts with ZHX2 regulating the vasculogenic mimicry formation of glioma cells via linc00707/mir-651-3p/sp2 axis. Cell Death Amp Dis. 2021 Feb 4;12(2):153. DOI:10.1038/s41419-021-03432-1
- Long B, Li N, Xu X, et al. Long noncoding RNA LOXL1-AS1 regulates prostate cancer cell proliferation and cell cycle progression through miR-541-3p and CCND1. Biochem Biophys Res Commun. 2018;505:561–568. DOI:10.1016/j.bbrc.2018.09.160
- Yuan JB, Gu L, Chen L, et al. Annexin A8 regulated by lncRNA-TUG1/miR-140-3p axis promotes bladder cancer progression and metastasis. Mol Ther Oncolytics. 2021 Sep 24;22:36–51. DOI:10.1016/j.omto.2021.04.008
- Wu Y, Wang T, Xia L, et al. LncRNA WDFY3-AS2 promotes cisplatin resistance and the cancer stem cell in ovarian cancer by regulating hsa-miR-139-5p/sdc4 axis. Cancer Cell Int. 2021 May 29;21(1):284. DOI:10.1186/s12935-021-01993-x
- Shen Q, Xu Z, Xu S Long noncoding RNA LUCAT1 contributes to cisplatin resistance by regulating the miR514a3p/ulk1 axis in human nonsmall cell lung cancer. Int J Oncol. 2020 Oct;57(4):967–979.
- He C, Liu YY, Li JH, et al. LncRNA RPSAP52 promotes cell proliferation and inhibits cell apoptosis via modulating miR-665/STAT3 in gastric cancer. Bioengineered. 2022;13:8699–8711. DOI:10.1080/21655979.2022.2054754
- Zhang WT, Wang ZF, Cai GH, et al. Circ_dock1 regulates USP11 through miR-132-3p to control colorectal cancer progression. World J Surg Oncol. 2021;19:67.
- Huang N, Guo W, Ren K, et al. LncRNA AFAP1-AS1 supresses miR-139-5p and promotes cell proliferation and chemotherapy resistance of non-small cell lung cancer by competitively upregulating RRM2. Front Oncol. 2019;9:1103.
- Wang D, Zheng J, Liu X, et al. Knockdown of USF1 inhibits the vasculogenic mimicry of glioma cells via stimulating SNHG16/miR-212-3p and linc00667/mir-429 axis. Mol Ther Nucl Acids. 2019 Mar 1;14:465–482. DOI:10.1016/j.omtn.2018.12.017
- Li D, Shen Y, Ren H, et al. Angiomotin-P130 inhibits vasculogenic mimicry formation of small cell lung cancer independently of Smad2/3 signal pathway. J Bioenerg Biomembr. 2021 Jun;53(3):295–305. DOI:10.1007/s10863-021-09891-7
- Mao Y, Xue P, Li L, et al. Bioinformatics analysis of mRNA and miRNA microarray to identify the key miRnagene pairs in smallcell lung cancer. Mol Med Rep. 2019 Sep;20(3):2199–2208. DOI:10.3892/mmr.2019.10441
- Chen P, Guo H, Liu Y, et al. Aberrant methylation modifications reflect specific drug responses in small cell lung cancer. Genomics. 2021 May;113(3):1114–1126. DOI:10.1016/j.ygeno.2020.12.045
- Zeng F, Wang Q, Wang S, et al. Linc00173 promotes chemoresistance and progression of small cell lung cancer by sponging miR-218 to regulate Etk expression. Oncogene. 2020 Jan;39(2):293–307. DOI:10.1038/s41388-019-0984-2
- Jin Y, Wong YS, Goh BKP, et al. Circulating microRnas as potential diagnostic and prognostic biomarkers in hepatocellular carcinoma. Sci Rep. 2019 Jul 18;9(1):10464. DOI:10.1038/s41598-019-46872-8
- Li M, Zou X, Xia T, et al. A five-miRNA panel in plasma was identified for breast cancer diagnosis. Cancer Med. 2019 Nov;8(16):7006–7017. DOI:10.1002/cam4.2572
- Yuan Q, Yu H, Chen J, et al. ADAM10 promotes cell growth, migration, and invasion in osteosarcoma via regulating E-cadherin/β-catenin signaling pathway and is regulated by miR-122-5p. Cancer Cell Int. 2020;20:99.
- Liu YH, Liu JL, Wang Z, et al. MiR-122-5p suppresses cell proliferation, migration and invasion by targeting SATB1 in nasopharyngeal carcinoma. Eur Rev Med Pharmacol Sci. 2019 Jan;23(2):622–629. DOI:10.26355/eurrev_201901_16876
- Dai C, Zhang Y, Xu Z, et al. MicroRNA-122-5p inhibits cell proliferation, migration and invasion by targeting CCNG1 in pancreatic ductal adenocarcinoma. Cancer Cell Int. 2020;20:98.
- Hu N, Tian Y, Song Y, et al. miR1225p suppresses the oncogenesis of PTC by inhibiting DUSP4 expression. Mol Med Rep. 2021 May;23(5). DOI:10.3892/mmr.2021.12007
- Li X, Ma C, Luo H, et al. Identification of the differential expression of genes and upstream microRnas in small cell lung cancer compared with normal lung based on bioinformatics analysis. Medicine (Baltimore). 2020 Mar;99(11):e19086. DOI:10.1097/MD.0000000000019086
- Wei T, Zhu W, Fang S, et al. miR-495 promotes the chemoresistance of SCLC through the epithelial-mesenchymal transition via Etk/BMX. Am J Cancer Res. 2017;7(3):628–646.
- Li BP, Mao YT, Wang Z, et al. CLIC1 promotes the progression of gastric cancer by regulating the MAPK/AKT pathways. Cell Physiol Biochem. 2018;46(3):907–924. DOI:10.1159/000488822
- Wechman SL, Emdad L, Sarkar D, et al. Vascular mimicry: triggers, molecular interactions and in vivo models. Adv Cancer Res. 2020;148:27–67.
- Zhao J, Wu J, Qin Y, et al. LncRNA PVT1 induces aggressive vasculogenic mimicry formation through activating the STAT3/Slug axis and epithelial-to-mesenchymal transition in gastric cancer. Cell Oncol (Dordr). 2020 Oct;43(5):863–876. DOI:10.1007/s13402-020-00532-6
- Troyanovsky B, Levchenko T, Månsson G, et al. Angiomotin: an angiostatin binding protein that regulates endothelial cell migration and tube formation. J Cell Biol. 2001 Mar 19;152(6):1247–1254. DOI:10.1083/jcb.152.6.1247
- Yang J, Zhang X, Chen Z, et al. Angiomotin-P130 inhibits β-catenin stability by competing with Axin for binding to tankyrase in breast cancer. Cell Death Amp Dis. 2019 Feb 21;10(3):179. DOI:10.1038/s41419-019-1427-2