
ABSTRACT
This study was used to assess THBS3‘s overall survival (OS) prognostic values in clear cell renal cell carcinoma (ccRCC) as well as to determine the LncRNA/RNA binding protein (RBP)/THBS3 interactions. Clinical data and RNA sequencing data were gathered from the TCGA dataset. Significant pathways associated with THBS3 were identified by gene set enrichment analysis (GSEA). Cox regression analyses, both univariate and multivariate, were applied to assess factors with independent prognostic abilities. We also discussed THBS3‘s relationship to immunity. We discovered that THBS3 expression was increased in ccRCC samples, as well as shorter OS in the TCGA dataset (P<0.05). External verification results in GSE6344, ICGC, ArrayExpress, UALCAN datasets, and qRT-PCR remained consistent (all P<0.05). Cox regression analyses, both univariate and multivariate, identified THBS3 as a factor with independent prognostic ability (both P<0.001). THBS3 expression as well as several clinicopathological variables were included in the nomogram OS prognosis prediction method as well. GSEA identified four THBS3-related signal pathways and THBS3 was revealed to be significantly associated with MSI, TMB, neoantigen, and immunity (all P<0.05). We also identified several LncRNA/RBP/THBS3 mRNA networks as potentially THBS3-related mechanisms. For THBS3-related drug sensitivities, THBS3 was negatively associated with Actinomycin D, Cobimetinib, Eribulin mesilate, Geldanamycin analog, and Vinblastine, while it was positively related to Erlotinib drug sensitivity. In addition to being an independent prognostic factor for ccRCC, THBS3 had a close connection to immunity, with identifying LncRNA/RBPs/THBS3 mRNA networks. Verifications of our findings in vivo and in vitro should be done in the future.
Introduction
In the United States 2022, kidney and renal pelvis cancers are estimated to have 79,000 new cases and 13,920 deaths [Citation1]. The majority of those affected by renal cell carcinoma (RCC) are diagnosed over 60 years old, and two-thirds are male. RCC has several different subtypes and nearly 70% of RCC sufferers are clear cell RCC (ccRCC). Despite the successful application of ccRCC’s early treatment through surgery or ablation, approximately one-third of these patients would present with a metastasis [Citation2]. A 5-year survival rate of only about 20% was observed for patients with advanced ccRCC who underwent surgical resection [Citation3]. It was therefore important to identify the molecular mechanisms of ccRCC and to find indicators to predict their prognosis.
The thrombospondin (THBS) family was classified as an extracellular matrix (ECM) protein, which could be further divided into two types on the basis of a molecular structure. Thrombin protein 1 and 2 (THBS1 and THBS2) belonged to the first group. The second group was made up of pentameric proteins, such as cartilage oligomeric matrix protein, thrombospondin protein 3 and 4 (THBS3 and THBS4) [Citation4]. The THBSs had been reported to be involved in a wide variety of fundamental biological processes, including tumorigenesis, issue differentiation, tumor metastasis, cell migration, or invasion [Citation5–7]. As reported, THBS3 was more than 12 kb in length, with 3.1 kb comprising the exonic sequences and 9.2kb the introns [Citation8] and it was located in both the mouse and human immediately upstream of Muc1/MUC1 (episialin) [Citation9]. A number of studies had shown that THBS3 could mediate the interaction between cells and extracellular matrix [Citation10]. However, there was still uncertainty as to whether THBS3 could serve as a prognostic biomarker for ccRCC. Therefore, the aims of this study were to assess THBS3‘s overall survival (OS) prognostic values in ccRCC as well as to reveal the relationships between THBS3 and immunity. We also determined the LncRNA/RNA binding protein (RBP)/THBS3 interactions for THBS3-related mechanisms, providing references and ideas for future studies.
Materials and methods
Data matrix acquisition and differentially expressed genes (DEGs)
Clinical data and RNA sequencing data were gathered from the TCGA ccRCC dataset (N = 72; T = 539; http://cancergenome.nih.gov/). In addition, another ccRCC datasets from the GEO (GSE6344), ICGC, ArrayExpress (E-MTAB-1980), UALCAN datasets were utilized for external verification. We utilized R software “limma” package to detect DEGs among ccRCC tissues and adjacent normal kidney tissues and to compare THBS3 expression in different tumor clinical stages, with the threshold of adjusted P values (FDR) <0.05 as well as log2 |fold change (FC)| ≥1.
Pathway enrichment and quantitative real-time PCR (qRT-PCR)
Kyoto Encyclopedia of Genes and Genomes (KEGG), as an encyclopedia of genes and genomes, was conducted to identify THBS3 significantly enriched pathways through gene set enrichment analysis (GSEA) [Citation11]. As previously described [Citation12], qRT-PCR was conducted according to the manufacturer’s instructions. Renal cell lines including ACHN, CKAI-1, 769-P, 786-O and one normal kidney cell-line HK-2 was utilized for analysis. All analysis was conducted by 2−ΔΔCt method and 5“−3” primers were shown below: THBS3-F TCTGCAATGACATCGATGAATG, THBS3-R GTTCAAAGAGACAGTGAGCATG; GAPDH-F CAGGAGGCATTGCTGATGAT, GAPDH-R GAAGGCTGGGGCTCATTT. This study was approved by the Institutional Research Ethics Committees of Jianhu Clinical Medical College of Yangzhou University.
Verification of the THBS3 protein expression utilizing the HPA and UALCAN databases
We validated the protein expression levels of THBS3 among ccRCC tumor and adjacent normal samples via immunohistochemical staining by using the online website of Human Protein Atlas (HPA) (http://www.proteinatlas.org/) and via CPTAC analysis by applying the online website of UALCAN (http://ualcan.path.uab.edu/analysis-prot.html).
Uni-/multivariate cox analysis and nomogram establishment
Cox regression analyses, both univariate and multivariate, were applied to assess factors (age, THBS3, gender, M, race, N, grade, T, stage) with independent prognostic abilities of OS in ccRCC. For predicting OS prognosis, we also used the R “rms” package to create a nomogram in order to visualize the relationship among survival rates and these individual factors (age, THBS3, gender, M, race, N, grade, T, stage). Through the point scale on the nomogram, the points were divided into each parameter and we calculated the overall point required adding up the points from each factor.
Correlation analysis of THBS3 in immunity, microsatellite instability (MSI), neoantigen and tumor mutational burden (TMB)
For pan-cancer analysis, we utilized Sangerbox online website (http://www.sangerbox.com/tool) to analyze five aspects including microsatellite instability (MSI), neoantigen, immune checkpoint molecules, tumor mutational burden (TMB) as well as immune cells [Citation13,Citation14]. In the field of immune infiltration, correlations among THBS3 and six immune infiltrating cells in TCGA ccRCC dataset were conducted using a purity-adjusted Spearman by CIBERSORT algorithm [Citation15]. For tumor microenvironment, correlations among THBS3 and estimate, immune and stromal scores in TCGA ccRCC dataset were conducted via ESTIMATE algorithm [Citation16].
THBS3-related drug sensitivity and the LncRNA/RBP/THBS3 mRNA axes construction
Using the CellMiner database, we were able to evaluate the effects of a target gene on drug sensitivity as previously described [Citation17], to identify THBS3-related drug sensitivity and to facilitate better precision treatment. A Chinese online tool called starBase v2.0 (http://starbase.sysu.edu.cn/) was applied to search the networks involving LncRNA, RBP and THBS3 mRNA, as described in previously published article [Citation18]. Combining with hub LncRNA and THBS3 positively related genes, we established the LncRNA/RBP/THBS3 mRNA network and used Cytoscape 3.6.1 software to visualize.
Results
Thbs3’s expression levels and prognosis in ccRCC
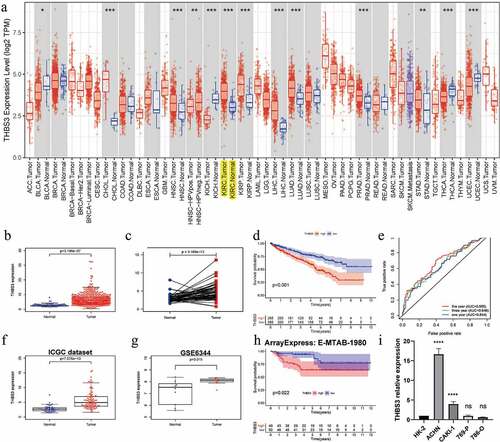
As detailed in (), THBS3”s mRNA expressions were significantly increased in ccRCC samples, compared with adjacent normal kidney tissues (P < 0.001). Based on the Kaplan–Meier curve, the OS rates were significantly lower in high-THBS3 subgroup than those in low-THBS3A subgroup (P < 0.001, ). ROC analyses of THBS3 for 1, 3, and 5 years were with the area under the curve (AUC) values of 0.644, 0.649, 0.685, separately, indicating that the prognostic ability of THBS3A is low (P < 0.001, ). GSE6344, ICGC, ArrayExpress (E-MTAB-1980) datasets were further applied to verify the THBS3” survival or expression and the outcomes remained consistent (). Further qRT-PCR results showed that THBS3 was highly expressed in ACHN and CAKI-1 cell lines (P < 0.0001, ).
Figure 1. The expression and prognosis of THBS3 in ccRCC; (A) THBS3 mRNA expression levels in pan-cancers from TCGA database; (B) Boxplot of THBS3 expression in TCGA dataset; (C) Pairwise boxplot of THBS3 expression in TCGA dataset; (D) K – M survival analysis of THBS3 in TCGA dataset; (E) ROC curves and its AUCs for 1-, 3-, and 5-year survival of THBS3 in TCGA dataset; (F) Boxplot of THBS3 expression in ICGC dataset; (G) Boxplot of THBS3 expression in GSE6344 dataset; (H) K – M survival analysis of THBS3 in ArrayExpress (E-MTAB-1980) dataset; (I) qRT-PCR results of THBS3 in ccRCC cell lines; *P <0.05; **P <0.01; ***P <0.001; ****P <0.0001; ns not significant.
Thbs3’s protein expression by HPA and UALCAN datasets in ccRCC
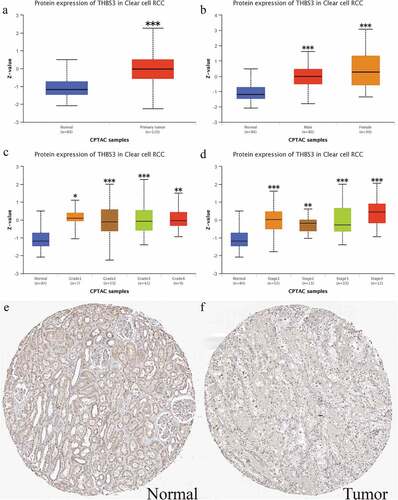
We utilized the UALCAN online database to verify THBS3”s protein expression through CPTAC analysis. As shown in , the total protein expression of THBS3 in ccRCC tumor tissues was obviously higher than that in normal kidney samples (P < 0.001). ( showed the THBS3”s protein expression distributions in different grades, different genders and different stages. Furthermore, two representative images from HPA database immunohistochemical staining (https://www.proteinatlas.org/) presented that THBS3 also had a lower expression in ccRCC samples. Generally, brownish yellow staining in the cytoplasm or nucleus is positive for immunohistochemistry and Scale bar = 200 um ().
Figure 2. External verification of THBS3 protein expression in ccRCC; (A) Total THBS3 protein expression distributions in ccRCC primary tumor and normal tissues; (B) Total THBS3 protein expression distributions in different genders; (C) Total THBS3 protein expression distributions in different grades; (D) Total THBS3 protein expression distributions in different stages; (F-G) Immunohistochemical staining from the HPA database for THBS3; Scale bar = 200 um; *P <0.05; **P <0.01; ***P <0.001.
Thbs3’s associations with clinical factors and independent prognostic ability
As displayed in , THBS3 was significantly associated with T (P = 0.0056), stage (P = 0.0039), metastasis (P = 0.0029), grade (P = 0.049), while it was not remarkably related to age, gender, race, N (all P>0.05). Cox regression analyses, both univariate and multivariate, were applied to assess factors (age, THBS3, gender, M, race, N, grade, T, stage) with independent prognostic abilities of OS in ccRCC. suggested that P values of THBS3 in both univariate (HR = 1.083, P < 0.001) and multivariate analysis (HR = 1.076, P < 0.001) were below 0.05, having independent prognostic ability of OS for ccRCC.
Figure 3. Relationships between with THBS3 expression and clinicopathologic characteristics; (A) Age; (B) Gender; (C) Race; (D) Grade; (E) Stage; (F) T; (G) Metastasis; (H) N.
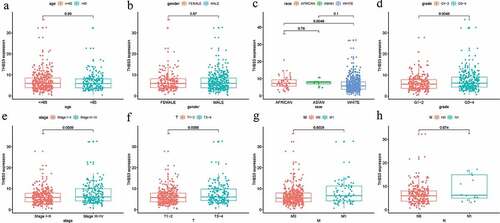
Table 1. Associations between overall survival and clinicopathologic characteristics in TCGA patients using univariate and multivariate cox analysis.
THBS3 related nomogram establishment for ccRCC
For predicting OS prognosis, we also used the R “rms” package to create a nomogram in order to visualize the relationship among survival rates and these individual factors (age, THBS3, gender, M, race, N, grade, T, stage) (). Through the point scale on the nomogram, the points were divided into each parameter and we calculated the overall point required adding up the points from each factor. Then, we could calculate the OS rates for ccRCC, making the prediction method of ccRCC patients more intuitive, thereby improving the prediction method of ccRCC patients. The AUC of OS in 1, 3 and 5 years predictions for the nomogram were 0.863, 0.810, 0.786, respectively and the C-index of this nomogram was 0.794 (). Calibration curves also indicated the robustness among prediction and actual results in TCGA dataset (). Thus, our established nomogram showed a moderate performance in predicting the sensitivity and specificity of OS for ccRCC.
Figure 4. Establishment of ccRCC prognostic prediction nomogram; (A) Nomogram construction based on THBS3 and clinicopathologic variables; (B) Calibration curves of 1-year; (C) Calibration curves of 3-year; (D) Calibration curves of 5-year.
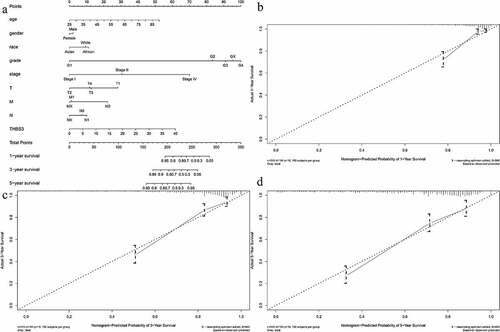
Table 2. 1-, 3-, 5-year AUCs and C-index of our constructed nomogram.
THBS3 related pathways by GSEA
Kyoto Encyclopedia of Genes and Genomes (KEGG), as an encyclopedia of genes and genomes, was conducted to identify THBS3 significantly enriched pathways through GSEA. According to our results, four THBS3-related signaling pathways were remarkably enriched and identified, including Glycerophospholipld metabolism, GNRH, Hedgehog and Oxidative phosphorylation pathways ( and ), helping to better understand THBS3 involved pathogenesis of ccRCC.
Figure 5. GSEA identified THBS3-related signaling pathways; (A) Glycerophospholipld metabolism signaling pathway; (B) GNRH signaling pathway; (C) Hedgehog signaling pathway; (D) Oxidative phosphorylation signaling pathway; (E) All of these four eligible signaling pathways significantly enriched in the high-THBS3 expression phenotype.
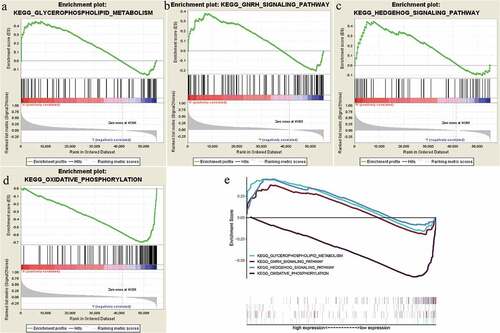
Table 3. Gene set enrichment analysis in high-THBS3 phenotype.
Thbs3’s associations with TMB, neoantigen, MSI, PPI in ccRCC
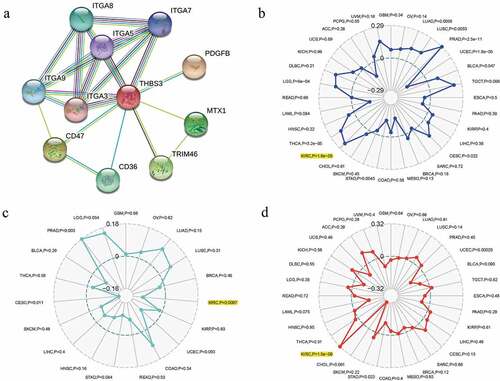
A total of 10 genes (ITGA9, ITGA8, ITGA7, ITGA5, ITGA3, FDGFB, MTX1, CD47, CD36 and TRIM46) were revealed to obviously interact with THBS3 by PPI network (). For pan-cancer analysis, we utilized Sangerbox online website to analyze THBS3’s associations with TMB, Neoantigen, MSI. The outcomes of us shed light on that THBS3 was notablely associated with TMB, MSI and neoantigen (all P < 0.001) in ccRCC ().
Figure 6. Relationships between THBS3 and PPI, MSI, neoantigen, TMB in ccRCC; (A) PPI network; (B) Relationships between THBS3 and MSI; (C) Relationships between THBS3 and neoantigen; (D) Relationships between THBS3 and TMB.
Thbs3’s associations with immune checkpoint molecules, tumor microenvironment, immune cells, immune infiltrations in ccRCC
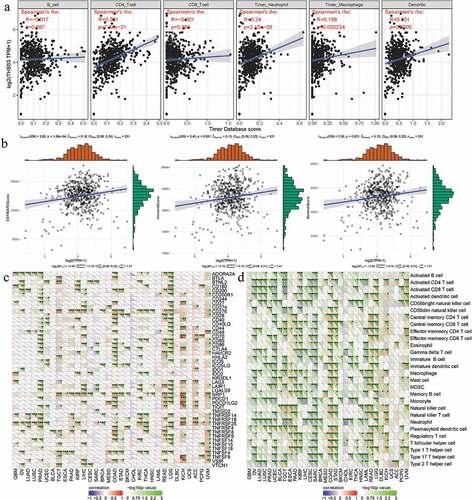
For immune infiltration, THBS3”s correlations with six immune cells” infiltration levels were assessed by TIMER analysis and the outcomes of us revealed that THBS3 was firmly related to CD4+ T cell, neutrophil, dendritic cell and macrophage cell infiltration levels (all P < 0.001; ). In addition, THBS3 had also been shown to have strong associations with estimate, immune and stromal scores in TCGA ccRCC dataset (). As showed in (, THBS3 also had strong associations with immune checkpoint molecules or immune cells pathway, such as TNFSF4, TNFSF14, TNFRSF25, TNFRSF14, LGALS9, CTLA4, CD276, BTNL2, Type 17 T helper cell, Neutrophil, Monocyte and CD56 bright natural killer cell etc. in ccRCC (all P < 0.05).
Figure 7. Associations between THBS3 and immune infiltrations, tumor microenvironment, immune checkpoint molecules and immune cells in ccRCC; (A) Relationships between THBS3 and tumor immune infiltration in ccRCC; (B) Relationships between THBS3 and immune microenvironment in ccRCC; (C) Co-expression analysis of THBS3 and immune checkpoint molecules in ccRCC; (D) Co-expression analysis of THBS3 and immune cells pathway in ccRCC.
THBS3 related drug sensitivity by CellMiner database
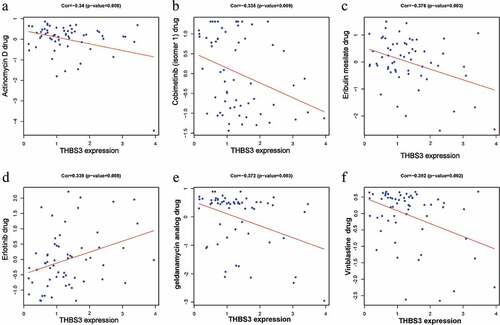
We utilized CellMiner database to identify THBS3-related drug sensitivity and to facilitate better precision treatment. Based on the cutoff value of P < 0.01 and |correlation coefficient| ≥0.3, we found that THBS3 was negatively associated with Actinomycin D, Cobimetinib, Eribulin mesilate, Geldanamycin analog and Vinblastine, while it was positively related to Erlotinib drug sensitivity ().
Figure 8. CellMiner database revealed THBS3 related drug sensitivity; (A) Actinomycin D; (B) Cobimetinib; (C) Eribulin mesilate; (D) Erlotinib; (E) Geldanamycin analog; (F) Vinblastine.
THBS3 related mechanism of LncRNA/RBP/THBS3 mRNA axes
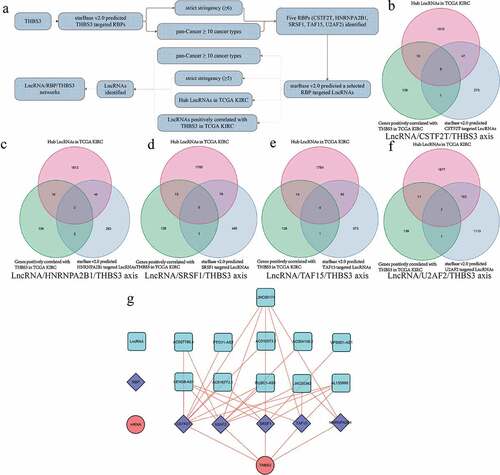
As detailed in , we firstly utilized starBase v2.0 database to find RBPs-THBS3 mRNA, RBPs-LncRNA targets. Combining with hub LncRNA and THBS3 positively related genes, we finally established the LncRNA/RBP/THBS3 mRNA network and applied Cytoscape 3.6.1 software to visualize. Based on the threshold of P < 0.001 and |correlation coefficient| ≥0.6, () presented the venn diagram of LncRNA/CSTF2T/THBS3 axis, LncRNA/HNRNPA2B1/THBS3 axis, LncRNA/SRSF1/THBS3 axis, LncRNA/TAF15/THBS3 axis and LncRNA/U2AF2/THBS3 axis, respectively. The overall LncRNA/RBP/THBS3 mRNA axes are shown in .
Figure 9. Establishment of LncRNA/RBP/THBS3 mRNA networks; (A) the whole workflow of identifying LncRNA/RBP/THBS3 mRNA networks; (B) Venn diagrams of identifying the LncRNA/CSTF2T/THBS3 axis; (C) Venn diagrams of identifying the LncRNA/HNRNPA2B1/THBS3 axis; (D) Venn diagrams of identifying the LncRNA/SRSF1/THBS3 axis; (E) Venn diagrams of identifying the LncRNA/TAF15/THBS3 axis; (F) Venn diagrams of identifying the LncRNA/U2AF2/THBS3 axis; (G) the LncRNA/RBP/THBS3 mRNA networks.
Discussion
As we knew, radiotherapy and chemotherapy were often not effective on ccRCC. Although early treatment of ccRCC could be successful through surgery or ablation, approximately one-third of these patients would present with a metastasis [Citation2]. The THBS3 gene belonged to a family member encoding extracellular matrix glycoproteins, which could mediate the interaction between cells and extracellular matrix [Citation19–21]. Mammalian THBSs played a complex tissue-specific role in tumorigenesis and development, such as tumor growth, proliferation, and cell migration, etc [Citation22]. To the best of our knowledge, few researchers had focused on the associations between THBS3 gene and its prognostic values in ccRCC. Hence, the aims of this study were to assess THBS3‘s OS prognostic values as well as determine the LncRNA/RNA binding protein (RBP)/THBS3 interactions in ccRCC.
In the present article, we discovered that THBS3 expression was increased in ccRCC samples, as well as shorter OS in the TCGA dataset. External verification results in GSE6344, ICGC, ArrayExpress, UALCAN datasets and qRT-PCR remained consistent. Cox regression analyses, both univariate and multivariate, identified THBS3 as a factor with independent prognostic ability. THBS3 expression as well as several clinicopathological variables, were included in the nomogram OS prognosis prediction method as well. GSEA identified four THBS3-related signal pathways and THBS3 was revealed to be significantly associated with MSI, TMB, neoantigen and immunity. We also identified several LncRNA/RBP/THBS3 mRNA networks as potentially THBS3-related mechanisms. For THBS3 related drug sensitivities, THBS3 was negatively associated with Actinomycin D, Cobimetinib, Eribulin mesilate, Geldanamycin analog and Vinblastine, while it was positively related to Erlotinib drug sensitivity.
Increasing numbers of studies had suggested that THBS3 plays critical roles in tumor progress and it also correlated with metastasis or poor survival in various types of cancers. Hankenson et al. revealed the roles of THBS3 in regulating bone maturation in THBS3-deficient mice [Citation23]. THBS3 expression had been associated with lung cancer, according to a cross-cancer genome-wide analysis [Citation24]. Dalla-Torre et al. found that THBS3 was a differentially expressed gene in osteosarcoma, significantly correlated with clinicopathological data [Citation10]. Deng et al revealed that higher THBS3 expression was correlated with worse OS of stage I and II gastric carcinoma (GC) [Citation25]. Animal studies have shown that when the activity of THBS2 in prostate cancer (PCa) cells decreased, bone metastases were eliminated. Moreover, THBS4 targeted therapy might provide a novel strategy for treating advanced hepatocellular carcinoma (HCC) [Citation26–28]. All of these indicated the vital roles of THBS3 in ccRCC.
In order to better understand the effects of THBS on ccRCC, we conducted a functional enrichment analysis. We used TCGA data to perform GSEA between high and low expression of THBS3. According to our results, four THBS3-related signaling pathways were remarkably enriched and identified, including Glycerophospholipld metabolism, GNRH, Hedgehog and Oxidative phosphorylation pathways. As reported in previous articles, GNRH pathway could not only regulate the development system, but also tumor development and progress [Citation29–31]. A number of studies had shown that GNRH could activate and regulate various pathways, including calcineurin/NFAT, JNK/AP-1, MAPK and cAMP/PKA/CREB pathways [Citation32–34]. Oncogenesis and development of ccRCC were markedly influenced by these pathways. There were considerable evidence suggesting that molecules involved in the Hedgehog signaling pathway were critical for the progression of malignant tumors, including RCC [Citation35–38]. D’Amato et al also found that the Hedgehog signaling pathway shall lead to the resistance of RCC cells to molecularly targeted drugs (including sunitinib) [Citation37]. As for oxidative phosphorylation pathway, it was also a well knew pathway involved in various cancers’ progress [Citation39–41].
Along with the rapid applications of immunotherapy, various biomarkers had been mined and applied, such as MSI, TMB, Neoantigen and so on. A real-world study by Palmeri et al. reinforced the TMB utility as an immunotherapy predictive biomarker [Citation42]. Park et al discussed the potential of MSI as an immunotherapy promising predictive biomarker in advanced gastroesophageal cancers [Citation43]. Zheng et al. concluded current neoantigen results and related clinical trials in colorectal cancer, serving as a promising biomarker of immunotherapy for these patients [Citation44]. Based on our results, THBS3 was not only significantly associated with TMB, MSI or neoantigen in ccRCC, but also remarkably linked to tumor microenvironment, immune infiltration levels or immune checkpoint molecules. All of these suggested the potential of THBS3 as an immunotherapy promising predictive biomarker in ccRCC.
Research on RBPs had been conducted in various cancers as a hot spot in cancer research and RBPs were involved with the mechanisms of LncRNA/RBP/mRNA networks [Citation45,Citation46]. Ni et al. suggested that the NPSR1-AS1/ELAVL1/NPSR1 mRNA axis could activate the MAPK pathway to facilitate the development of thyroid cancer [Citation47]. Zhu et al. also revealed the LINC01232/IGF2BP2/TGFBR1 mRNA axis in non-small cell lung carcinoma to activate the TGF-β pathway [Citation48]. In this article, we also successfully established the LncRNA/RBP/THBS3 mRNA network, including the LncRNA/CSTF2T/THBS3 axis, the LncRNA/HNRNPA2B1/THBS3 axis, the LncRNA/SRSF1/THBS3 axis, the LncRNA/TAF15/THBS3 axis and the LncRNA/U2AF2/ THBS3 axis. All of these provided some references for further experiments.
This was the first time that we used a robust statistical method to comprehensively explore the role of THBS3 in ccRCC. External verification results in GSE6344, ICGC, ArrayExpress, UALCAN datasets and qRT-PCR remained consistent, making the results more convincing. Moreover, role of immunity were emphasized and our results displayed significant associations among THBS3 and immune infiltration levels, tumor microenvironment and tumor immune checkpoint molecules. In addition, we also identified THBS3-related mechanisms of LncRNA/RBP/THBS3 mRNA networks. Our research results were expected to provide new ideas for the further application of THBS3 in ccRCC. Several limitations should never be ignored. On the one hand, the normal kidney tissues’ sample sizes were small in the TCGA ccRCC database, which might result in the distortion of conclusions. On the other hand, THBS3’s independent cohort validation and biological validation in vitro or in vivo as well as more experiments were required to verify THBS3-related pathways or the LncRNA/RBP/THBS3 mRNA networks in our next article.
Conclusions
We concluded that THBS3 could be used independently as a prognostic factor in ccRCC and it was also revealed to be closely related to immunity. GSEA identified four THBS3-related pathways including Glycerophospholipld metabolism pathway, GNRH pathway, Hedgehog pathway and Oxidative phosphorylation pathway. We also identified THBS3-related mechanisms of LncRNA/RBPs/THBS3 mRNA networks in ccRCC. Verifying our findings in vivo and in vitro would require further basic research.
Author’s contribution
YL.G: Protocol/project development; BY.Z: Data collection or management; JC.Z: Data analysis and manuscript revision; G.W, FF.Q: Manuscript writing/editing. All authors have read and approved the final manuscript.
Availability of data and material
The RNA-sequencing data and corresponding clinical information were downloaded from The Cancer Genome Atlas (TCGA) database (https://portal.gdc.cancer.gov/).
Ethics approval and consent to participate
This study was approved by the Institutional Research Ethics Committees of Jianhu Clinical Medical College of Yangzhou University.
Disclosure statement
No potential conflict of interest was reported by the author(s).
Additional information
Funding
References
- Siegel RL, Miller KD, Fuchs HE, et al. Cancer statistics, 2022. CA Cancer J Clin. 2022;72(1):7–33.
- Jonasch E, Walker CL, Rathmell WK. Clear cell renal cell carcinoma ontogeny and mechanisms of lethality. Nat Rev Nephrol. 2021;17(4):245–261.
- Coppin C, Kollmannsberger C, Le L, et al. Targeted therapy for advanced renal cell cancer (RCC): a Cochrane systematic review of published randomised trials. BJU Int. 2011;108(10):1556–1563.
- Sid B, Sartelet H, Bellon G, et al. Thrombospondin 1: a multifunctional protein implicated in the regulation of tumor growth. Crit Rev Oncol Hematol. 2004;49(3):245–258.
- Chu XD, Lin ZB, Huang T, et al. Thrombospondin-2 holds prognostic value and is associated with metastasis and the mismatch repair process in gastric cancer. BMC Cancer. 2022;22(1):250. DOI:10.1186/s12885-022-09201-3
- Qu HL, Hasen GW, Hou YY, et al. THBS2 promotes cell migration and invasion in colorectal cancer via modulating Wnt/β-catenin signaling pathway. Kaohsiung J Med Sci. 2022;38(5):469–478.
- Wang Y, Chen J, Gao WQ, et al. METTL14 promotes prostate tumorigenesis by inhibiting THBS1 via an m6a-YTHDF2-dependent mechanism. Cell Death Discov. 2022;8(1):143.
- Adolph KW, Long GL, Winfield S, et al. Structure and organization of the human thrombospondin 3 gene (THBS3). Genomics. 1995;27(2):329–336.
- Vos HL, Devarayalu S, de Vries Y, et al. Thrombospondin 3 (Thbs3), a new member of the thrombospondin gene family. J Biol Chem. 1992;267(17):12192–12196.
- Dalla-Torre CA, Yoshimoto M, Lee CH, et al. Effects of THBS3, SPARC and SPP1 expression on biological behavior and survival in patients with osteosarcoma. BMC Cancer. 2006;6(1):237.
- Kanehisa M, Furumichi M, Tanabe M, et al. KEGG: new perspectives on genomes, pathways, diseases and drugs. Nucleic Acids Res. 2017;45(D1):D353–d361.
- Wang G, Qu F, Liu S, et al. Nucleolar protein NOP2 could serve as a potential prognostic predictor for clear cell renal cell carcinoma. Bioengineered. 2021;12(1):4841–4855.
- Hundal J, Carreno BM, Petti AA, et al. pVAC-Seq: a genome-guided in silico approach to identifying tumor neoantigens. Genome Med. 2016;8(1):11.
- Boegel S, Löwer M, Schäfer M, et al. HLA typing from RNA-seq sequence reads. Genome Med. 2012;4(12):102.
- Shen-Orr SS, Gaujoux R. Computational deconvolution: extracting cell type-specific information from heterogeneous samples. Curr Opin Immunol. 2013;25(5):571–578.
- Yoshihara K, Shahmoradgoli M, Martínez E, et al. Inferring tumour purity and stromal and immune cell admixture from expression data. Nat Commun. 2013;4:2612.
- Mu M, Yu Q, Zhang Q, et al. A pan-cancer analysis of molecular characteristics and oncogenic role of gasdermins. Cancer Cell Int. 2022;22(1):80.
- Wang Y, Tian Y, Liu S, et al. Prognostic value and immunological role of AXL gene in clear cell renal cell carcinoma associated with identifying LncRNA/RBP/AXL mRNA networks. Cancer Cell Int. 2021;21(1):625.
- Adams J, Lawler J. Extracellular matrix: the thrombospondin family. Curr Biol. 1993;3(3):188–190.
- Lawler J. Thrombospondins. Curr Drug Targets. 2008;9(10):820–821.
- Frazier WA. Thrombospondins. Curr Opin Cell Biol. 1991;3(5):792–799.
- Wang X, Zhang L, Li H, et al. THBS2 is a potential prognostic biomarker in colorectal cancer. Sci Rep. 2016;6:33366.
- Hankenson KD, Hormuzdi SG, Meganck JA, et al. Mice with a disruption of the thrombospondin 3 gene differ in geometric and biomechanical properties of bone and have accelerated development of the femoral head. Mol Cell Biol. 2005;25(13):5599–5606.
- Fehringer G, Kraft P, Pharoah PD, et al. Cross-Cancer genome-wide analysis of lung, ovary, breast, prostate, and colorectal cancer reveals novel pleiotropic associations. Cancer Res. 2016;76(17):5103–5114. DOI:10.1158/0008-5472.CAN-15-2980
- Deng LY, Zeng XF, Tang D, et al. Expression and prognostic significance of thrombospondin gene family in gastric cancer. J Gastrointest Oncol. 2021;12(2):355–364.
- Teraoku H, Morine Y, Ikemoto T, et al. Role of thrombospondin-1 expression in colorectal liver metastasis and its molecular mechanism. J Hepatobiliary Pancreat Sci. 2016;23(9):565–573.
- Chen PC, Tang CH, Lin LW, et al. Thrombospondin-2 promotes prostate cancer bone metastasis by the up-regulation of matrix metalloproteinase-2 through down-regulating miR-376c expression. J Hematol Oncol. 2017;10(1):33.
- Su F, Zhao J, Qin S, et al. Over-Expression of thrombospondin 4 correlates with loss of miR-142 and contributes to migration and vascular invasion of advanced hepatocellular carcinoma. Oncotarget. 2017;8(14):23277–23288. DOI:10.18632/oncotarget.15054
- Harrison GS, Wierman ME, Nett TM, et al. Gonadotropin-Releasing hormone and its receptor in normal and malignant cells. Endocr Relat Cancer. 2004;11(4):725–748.
- Gründker C, Emons G. The role of gonadotropin-releasing hormone in cancer cell proliferation and metastasis. Front Endocrinol (Lausanne). 2017;8:187.
- Jayaram S, Gupta MK, Raju R, et al. Multi-Omics data integration and mapping of altered kinases to pathways reveal gonadotropin hormone signaling in glioblastoma. Omics. 2016;20(12):736–746.
- Wang Y, Sun T, Sun H, et al. SCF/C-Kit/jnk/ap-1 signaling pathway promotes claudin-3 expression in colonic epithelium and colorectal carcinoma. Int J Mol Sci. 2017;18(4):765.
- Quang CT, Leboucher S, Passaro D, et al. The calcineurin/nfat pathway is activated in diagnostic breast cancer cases and is essential to survival and metastasis of mammary cancer cells. Cell Death Amp Dis. 2015;6(2):e1658.
- Najafi M, Ahmadi A, Mortezaee K. Extracellular-Signal-Regulated kinase/mitogen-activated protein kinase signaling as a target for cancer therapy: an updated review. Cell Biol Int. 2019;43(11):1206–1222.
- Ruch JM, Kim EJ. Hedgehog signaling pathway and cancer therapeutics: progress to date. Drugs. 2013;73(7):613–623.
- Dormoy V, Danilin S, Lindner V, et al. The sonic hedgehog signaling pathway is reactivated in human renal cell carcinoma and plays orchestral role in tumor growth. Mol Cancer. 2009;8(1):123.
- D’Amato C, Rosa R, Marciano R, et al. Inhibition of hedgehog signalling by NVP-LDE225 (Erismodegib) interferes with growth and invasion of human renal cell carcinoma cells. Br J Cancer. 2014;111(6):1168–1179. DOI:10.1038/bjc.2014.421
- Zhou J, Wu K, Gao D, et al. Reciprocal regulation of hypoxia-inducible factor 2α and GLI1 expression associated with the radioresistance of renal cell carcinoma. Int J Radiat Oncol Biol Phys. 2014;90(4):942–951. DOI:10.1016/j.ijrobp.2014.06.065
- Kamada S, Takeiwa T, Ikeda K, et al. Emerging roles of COX7RP and mitochondrial oxidative phosphorylation in breast cancer. Front Cell Dev Biol. 2022;10:717881.
- Xu T, Junge JA, Delfarah A, et al. Bladder cancer cells shift rapidly and spontaneously to cisplatin-resistant oxidative phosphorylation that is trackable in real time. Sci Rep. 2022;12(1):5518. DOI:10.1038/s41598-022-09438-9
- Xue D, Xu Y, Kyani A, et al. Multiparameter optimization of oxidative phosphorylation inhibitors for the treatment of pancreatic cancer. J Med Chem. 2022;65(4):3404–3419.
- Palmeri M, Mehnert J, Silk AW, et al. Real-World application of tumor mutational burden-high (TMB-high) and microsatellite instability (MSI) confirms their utility as immunotherapy biomarkers. ESMO Open. 2022;7(1):100336. DOI:10.1016/j.esmoop.2021.100336
- Park R, Da Silva LL, Saeed A. Immunotherapy predictive molecular markers in advanced gastroesophageal cancer: mSI and beyond. Cancers (Basel). 2021;13(7).
- Zheng Y, Fu Y, Wang PP, et al. Neoantigen: a promising target for the immunotherapy of colorectal cancer. Dis Markers. 2022;2022:8270305.
- Lan Y, Xiao X, He Z, et al. Long noncoding RNA OCC-1 suppresses cell growth through destabilizing HuR protein in colorectal cancer. Nucleic Acids Res. 2018;46(11):5809–5821.
- Janakiraman H, House RP, Gangaraju VK, et al. The long (lncRNA) and short (miRNA) of it: tGFβ-mediated control of RNA-binding proteins and noncoding RNAs. Mol Cancer Res. 2018;16(4):567–579.
- Ni T, Guo D, Tan L, et al. NPSR1-AS1 activates the MAPK pathway to facilitate thyroid cancer cell malignant behaviors via recruiting ELAVL1 to stabilize NPSR1 mRNA. Cell Cycle (Georgetown, Tex). 2022;21(5):439–449.
- Zhu L, Liu Y, Tang H, et al. FOXP3 activated-LINC01232 accelerates the stemness of non-small cell lung carcinoma by activating TGF-β signaling pathway and recruiting IGF2BP2 to stabilize TGFBR1. Exp Cell Res. 2022;413(2):113024.