
ABSTRACT
Protein regulator of cytokinesis 1 (PRC1) is a microtubule-binding protein with essential roles in mitosis and cytokinesis. PRC1 is frequently overexpressed in cancer cells where it could contribute to chromosomal instability. Due to its nuclear localization in interphase, it has been speculated that PRC1 has additional functions that are involved in its pro-tumorigenic functions. In this study we investigated the potential nuclear functions of PRC1 in a lung cancer cell line. Genome wide expression profiling by RNA sequencing revealed that the expression of PRC1 results in activation of the p53 pathway and inhibition of the pro-proliferative E2F-dependent gene expression. A mutant of PRC1 that is unable to enter into the nucleus regulated the same gene sets as wildtype PRC1, suggesting that PRC1 has no nuclear-exclusive functions in A549 cells. Instead, induction of p53 by PRC1 correlates with multinucleation and depends on the localization of PRC1 to the midbody, suggesting that the induction of p53 is a consequence of overexpressed PRC1 to interfere with the normal function of PRC1 during cytokinesis. Activation of p53 by PRC1 results in cellular senescence but not in apoptosis. In conclusion, while PRC1 is frequently overexpressed in many cancers, the p53 pathways may initially protect cancer cells from the negative effects of PRC1 overexpression on cytokinesis. Because depletion of PRC1 also results in p53-pathway activation and senescence, levels of PRC1 need to be tightly regulated to allow unperturbed proliferation. Targeting the expression or function of PRC1 could create a therapeutic vulnerability for the treatment of cancer.
KEYWORDS:
Introduction
Cytokinesis, the final step in cell division process when daughter cells get separated, is crucial for maintenance of genome integrity. Cytokinesis failure causes aneuploidy which can contribute to development of cancer [Citation1–3,]. Carter et al. have identified a chromosomal instability (CIN) signature of genes whose expression is associated with aneuploidy and whose overexpression is prognostic of poor clinical outcome in several cancer types [Citation4]. Out of 10,151 genes of this signature, the second-highly ranked gene encodes for PRC1 (protein regulator of cytokinesis 1), a key regulator of cytokinesis that binds and crosslinks antiparallel microtubules at the spindle midzone (also known as central spindle) [Citation5]. PRC1 is also involved in the recruitment of regulatory proteins such as KIF4A and PLK1 to the midzone [Citation6–8Citation9,Citation10]. PRC1 is organized into several domains including a dimerization domain, rod domain, central microtubule binding domain and a Lys/Arg-rich domain [Citation8,Citation9,Citation11,]. Microtubule-binding of PRC1 is mediated by highly conserved spectrin-fold within the microtubule-binding domain and by the unstructured C-terminal part which maintains long-lived association with microtubules [Citation9,Citation11]. Additionally, the C-terminus contains two nuclear localization signals and two motifs for phosphorylation by CDK1 or PLK1, respectively [Citation8,Citation11–13,,]. Phosphorylation of PRC1 is crucial for the spatiotemporal regulation and activation of PRC1. The N-terminal part of PRC1 is composed of alpha-helices with multiple coiled-coil motifs mediating binding to kinesin family member 4 (KIF4), which contains a motor domain and translocate PRC1 along microtubules [Citation14,Citation15,]. Overexpression of PRC1 may result in cytokinesis failure and CIN, thus contributing to intratumoral heterogeneity and tumor evolution [Citation16].
In addition to its well-established role in cytokinesis, PRC1 has been proposed to function in cellular signaling that could also be involved in its pro-tumorigenic functions. Specifically, Chen et al. recently identified PRC1 as a novel Wnt-target gene in hepatocellular carcinoma that regulates Wnt signaling in a positive feedback loop by sequestering the destruction complex and stabilizing ß-catenin [Citation17]. It has been suggested that the activation of Wnt target genes by PRC1 promotes proliferation, stemness and metastasis of hepatocellular carcinoma. Similarly, PRC1 overexpression leads to increased proliferation of lung adenocarcinoma cells by activation of the Wnt/β-catenin pathway [Citation18]. These cytokinesis-independent functions could contribute to the tumorigenic activities of PRC1. In addition, the ability of the kinase CDK16 to promote cancer cell proliferation has been linked to the regulation of nuclear localization of PRC1 [Citation19].
In this study, we investigated the potential nuclear roles of PRC1 by performing genome-wide expression profiling by RNA-seq analysis. We find no evidence for Wnt-signaling regulation by PRC1 in lung adenocarcinoma cells. Instead, the p53 pathway is robustly activated upon PRC1 overexpression by both wildtype PRC1 and by a mutant of PRC1 that is unable to enter the nucleus. Activation of p53 by PRC1 results in cellular senescence but not in apoptosis. While the induction of p53 by PRC1 does not require nuclear localization of PRC1, it depends on localization of PRC1 to the midbody and correlates with multinucleation. In conclusion, while PRC1 is frequently overexpressed in many cancers, where it correlates with an unfavorable clinical prognosis, activation of the p53 pathways appears to initially protect cells from the negative effects of PRC1 overexpression on cytokinesis.
Results
Expression of PRC1 results in activation of the p53 pathway and downregulation of the E2F-dependent transcriptional program
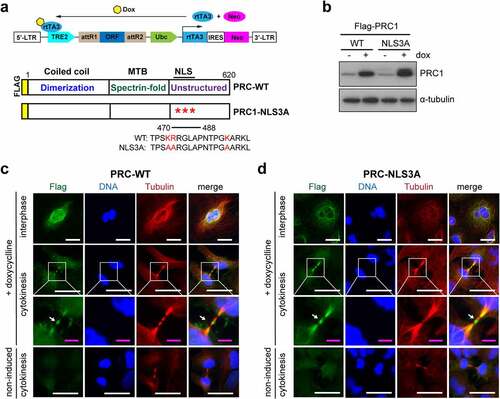
To address whether PRC1 regulates gene expression in the nucleus in interphase, we determined genome wide expression changes by wildtype PRC1 and by a version of PRC1 that fails to locate to the nucleus. We first generated A549 lung cancer cell lines stably expressing either doxycycline-inducible flag-tagged wildtype PRC1 (PRC1-WT) or PRC1 with mutated nuclear localization signals (PRC1-NLS3A) (). Immunoblotting confirmed that ectopically expressed PRC1-WT and PRC1-NLS3A were expressed at similar levels after induction with doxycycline (). We next investigated the subnuclear localization of PRC1 by immunostaining with an anti-flag antibody. Non-induced cells showed only a background signal compared to doxycycline-induced cells (). During cytokinesis, PRC1-WT and PRC1-NLS3A were both localized to the midbody indicating that the NLS3A mutation does not interfere with the ability of PRC1 to properly localize in mitosis. Importantly, while PRC1-WT exhibited nuclear localization in interphase cells, PRC1-NLS3A was excluded from nuclei. Instead, during interphase PRC1-NLS3A was localized in the cytoplasm where it co-localized with perinuclear microtubule ().
Figure 1. Inducible expression and localization of PRC1 and PRC1-NLS3A in A549 lung cancer cells. a) Scheme of the pINDUCER vector for inducible cDNA expression and of the PRC1 constructs. The NLS3A mutant contains three amino acid changes in the NLS sequence. Both constructs were generated with an N-terminal flag-tag. Dox: doxycycline; rtTA3: reverse tet-transactivator 3; TRE2: tetracycline response element 2; MTB: microtubule-binding domain; NLS: nuclear localization signal; b) Expression of PRC1-WT or PRC1-NLS3A was induced with doxycycline and analyzed by immunoblotting. Tubulin served as a loading control. C) and D) Expression of PRC1-WT (c) or PRC1-NLS3A (d) was induced with doxycycline. Cells were fixed and immunostained for flag (green), Hoechst (blue) and tubulin (red) and investigated by fluorescence microscopy. Example of cells in interphase and cytokinesis are shown. Arrow: midbody. White bar: 25 μm; Magenta bar: 5 μm.
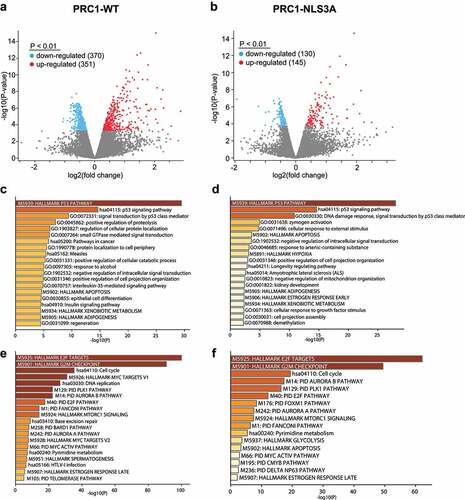
We next analyzed genome-wide expression changes upon induction of either PRC1-WT or PRC1-NLS3A. RNA was isolated from three independent biological replicates of cells expressing either PRC1-WT or PRC1-NLS3A. Non-induced cells served as controls. Isolated RNA was subjected to RNA-seq. Analysis of the RNA-seq data revealed that 370 genes were significantly downregulated and 351 genes were significantly upregulated by PRC1-WT (adjusted p-value <0.01) (). Fewer genes were downregulated (130) and upregulated (145) by PRC1-NLS3A compared to control cells by using the same threshold of adjusted p-value (<0.01) (). Although fewer genes were up- or downregulated by PRC1-NLS3A compared to wildtype PRC1, gene ontology analysis showed that highly similar gene sets were enriched by both PRC1-WT and PRC1-NLS3A (). Among the upregulated genes, the p53 signaling pathway was the most strongly enriched pathway by both PRC1-WT and PRC1-NLS3A (). On the other hand, the most significantly downregulated gene sets in both, PRC1-WT and PRC1-NLS3A expressing cells are related to the cell cycle, including genes regulated by the pro-proliferative transcription factors E2F and MYC ().
Figure 2. Expression of PRC1-WT and PRC1-NLS3A results in activation of the p53 pathway and downregulation of E2F-dependent cell cycle genes. a) b) Volcano plots of RNA-seq data. By adjusted p-value of <0.01, 370 genes were down-regulated and 351 genes upregulated by PRC1-WT (A) and 130 genes were down-regulated and 145 genes upregulated by PRC1-NLS3A (B). C) and D) Enriched pathways and gene ontologies (GO) in genes up- (c, d) or downregulated (e,f) after PRC1-WT (c,e) or PRC1-NLS3A (d,f) expression.
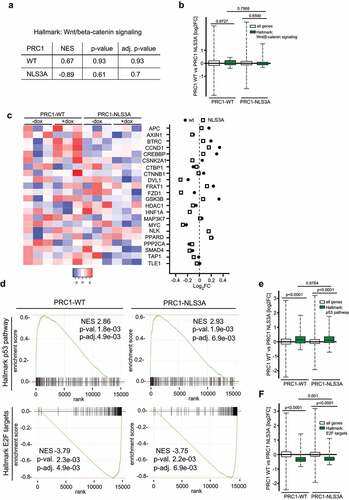
PRC1 has been linked to the Wnt signaling pathway in hepatocellular carcinoma and lung adenocarcinoma [Citation17,Citation18,]. To analyze possible changes in expression of Wnt signaling pathway genes by PRC1, gene set enrichment analysis with FGSEA (fast preranked gene set enrichment analysis) was performed by using the human Wnt signaling hallmark gene sets from MSigDB (Molecular Signatures Database) and the RNA-seq data for PRC1-WT and PRC1-NLS3A. FGSEA analysis revealed that Wnt/β- catenin signaling was not significantly altered by PRC1-WT or PRC1-NLS3A (). Further, analysis of the Wnt/β-catenin signaling gene group showed no significant differences between all expressed genes and Wnt/β-catenin signaling genes by either PRC1-WT or PRC1-NLS3A (). When we plotted the expression of 22 Wnt signaling pathway genes, no specific pattern of differently expressed Wnt signaling genes were detectable upon PRC1-WT or PRC1-NLS3A expression (). Next, we performed a FGSEA analysis of the top enriched and down regulated hallmark gene sets. Similar to gene ontology analysis, the top enriched hallmark gene set was the p53 pathway. PRC1-WT and PRC1-NLS3A showed a comparable normalized enrichment score (NES) of 2.86 (WT) and 2.93 (NLS3A) indicating a similar effect on the p53 pathway (). The top downregulated hallmark gene set upon PRC1 expression was the E2F target gene set which showed a negative and comparable NES of −3.79 for wildtype PRC1 and −3.75 for PRC1-NLS3A (). Next, we further compared the effect of PRC1-WT and PRC1-NLS3A on the p53 and E2F pathways by plotting differences in expression relative to all expressed genes by PRC1-WT and PRC1-NLS3A. In comparison to all expressed genes, the p53 pathway gene set was significantly upregulated by PRC1-WT and PRC1-NLS3A (). However, the induction of p53 pathway genes was not significantly different when we compared PRC1-WT and PRC1-NLS3A. Similarly, E2F target genes were significantly down-regulated in comparison to all genes by PRC1-WT or PRC1-NLS3A expression (), although expression of wildtype PRC1 resulted in slightly stronger downregulation of E2F targets with a median log2 fold change (FC) of −0.36 compared to PRC1-NLS3A with a median log2 FC of −0.31.
Figure 3. PRC1 does not regulate Wnt/β-catenin pathway genes in A549 cells. a) FGSEA analysis of RNA-seq data using the human hallmark gene sets from MSigDB. Ranked lists of differently expressed genes after PRC1-WT or PRC1-NLS3A expression were used. NES, normalized enrichment score (b) Boxplots showing log2 fold changes comparing differences in gene expression of the Wnt/β-catenin pathway gene set upon PRC1-WT and PRC1-NLS3A expression. All genes: n = 14.880, Wnt/β-catenin signaling: n = 36. p-values were calculated with a two-tailed Wilcoxon rank sum test (unpaired samples). c) Heatmap and Log 2-fold expression of 22 Wnt signaling pathway genes after expression of PRC1-WT or PRC1-NLS3A. d) FGSEA analysis was performed using the human hallmark gene sets from MSigDB and ranked lists of differently expressed genes after PRC1-WT or PRC1- NLS3A expression. Enrichment plots of hallmark p53 pathway and E2F targets are shown. NES, normalized enrichment score E) F) Boxplots comparing Log2 fold changes (FC) in p53 pathway (e) and E2F target (f) gene expression between PRC1-WT and PRC1-NLS3A. All genes: n = 14.880, p53 pathway: n = 176, E2F targets: n = 195. p-values were calculated with a two-tailed Wilcoxon rank sum test.
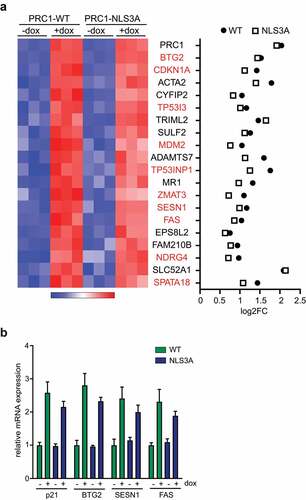
We next investigated the top 20 differentially expressed genes upon expression of PRC1-WT and PRC1-NLS3A. The top hit was PRC1 itself, confirming the induction of PRC1. Interestingly, 10 out of the 20 top genes are bona-fide p53-target genes (, highlighted in red). Examples for induced p53-target genes are the antiproliferative protein BTG2, the cyclin-dependent kinase inhibitor CDKN1A (p21), the E3 ubiquitin ligase MDM2, the proapoptotic receptor FAS and SESN1, which mediates p53 inhibition of cell growth. Analysis of the log2 fold changes of the top 20 differently expressed genes showed slightly higher values for most genes after PRC1-WT expression in comparison to PRC1-NLS3A expression (). Because the p53 pathway was the most strongly enriched pathway upon expression of PRC1 and PRC1-NLS3A, we independently confirmed activation of p53-target genes by PRC1-WT and PRC1-NLS3A by RT-qPCR (). The p53-target genes BTG2, SESN1, CDKN1A (p21) and FAS, which were randomly selected, were all activated after induction of wildtype PRC1 or PRC1-NLS3A. Taken together, the genome-wide expression analysis indicates that both wildtype PRC1 and PRC1-NLS3A lead to activation of the p53 pathway and to inhibition of the pro-proliferative E2F pathway.
Figure 4. Activation of p53-target genes by PRC1 a) Heatmap and Log2-fold changes of the top 20 differentially expressed genes. 10 out of 20 genes are bona-fide p53-target genes and are highlighted in red. b) Validation of activation of p53-target genes by PRC1. PRC1 was induced by the addition of doxycycline. Expression of the indicated genes was analyzed by RT-qPCR.
Expression of PRC1 or PRC1-NLS3A results in multinucleation
We next explored the possible cause of p53 pathway activation by PRC1. By microscopy, we observed that expression of PRC1-WT and PRC1-NLS3A resulted in an increase in cell size compared to non-induced cells (). Quantification showed that cell size increased significantly from around 30 µm to over 90 µm by wildtype PRC1 or PRC1-NLS3A ().
Figure 5. Expression of PRC1 results in cell size increase and in multinucleation. A) Following expression of the indicated PRC1 constructs, cells were fixed and immunostained for flag (green), Hoechst (blue) and tubulin (red) and investigated by fluorescence microscopy. The diameter of cells was measured. Bar: 25 μm. B) Quantification of the cell sizes from the experiment in (A). Each symbol represents one independent experiment. n = 3 biological replicates. Student’s t-test. *p < 0.05; ***p < 0.0001. Dox: doxycycline. C) Scheme of PRC1-∆N78 mutant. D) Expression of PRC1-∆N78 was induced with doxycycline. Cells were fixed and immunostained for flag (green), Hoechst (blue) and tubulin (red) and investigated by fluorescence microscopy. Examples of cells in interphase and cytokinesis are shown. White bar: 25 μm; Magenta. Bar: 5 μm. E) PRC1-WT, PRC1-NLS3A or PRC1-ΔN78 were induced with doxycycline (Dox). Subsequently, cells were fixed and immunostained for flag (green), tubulin (red), and Hoechst (blue) and investigated by fluorescence microscopy revealing multinucleated cells. Bar: 25 μm. F) PRC1-WT, PRC1-NLS3A or PRC1-ΔN78 were induced with doxycycline (Dox) for 1, 2, 3 and 4 days. The percentage of mono-, bi- and multi-nucleated cells was determined. Shown is the mean and SD of n = 2 independent replicates. G) PRC1-WT, PRC1-NLS3A or PRC1-ΔN78 were induced with doxycycline. p53, p21, cleaved-caspase-3 and cleaved PARP were analyzed by immunoblotting. β-actin was used as a loading control. H) Cells were treated as in G) qRT-PCR indicating that the p53-target gene p21 is induced by PRC1 and PRC1-NLS3A, but not by PRC1-∆N78.
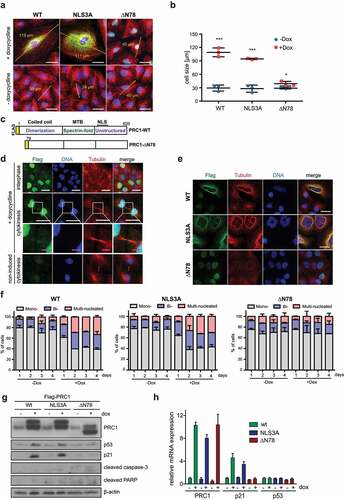
To directly test whether the cell size increase is related to the functions of PRC1 in mitosis and cytokinesis, we generated a cell line expressing a variant of PRC1 that lacks part of the N-terminal dimerization domain (PRC1-∆N78) (). The N-terminal domain has been shown to be essential for the function of PRC1 in mitosis and cytokinesis [Citation8,Citation14]. PRC1-∆N78 was absent from the midbody but localized to the nuclei of interphase cells (). PRC1-∆N78 only slightly increased cell size and this effect was not significant (). In addition to an increase in cell size, we observed multinucleation in cells expressing PRC1-WT or PRC1-NLS3A (). To better understand the relationship between PRC1 expression and multinucleation, we performed a time course of PRC1 induction and determined the fraction of mono-, bi- and multinucleated cells by immunostaining (). Bi- and multinucleation was already observed after expression of PRC1 for one day and further increased on day two. Longer induction up to 4 days did not further increase the fraction of bi- and multinucleated cells. A similar kinetics of bi- and multinucleation was also observed in cells expressing PCR1-NLS3A. Importantly, PRC1-∆N78 did not result in any bi- and multinucleation, indicating that the ability to induce multinucleation depends on the localization of PRC1 to the spindle midzone in mitosis. Furthermore, while PRC1-WT and PRC1-NLS3A resulted in robust activation of p53 and of the p53-target gene p21 as demonstrated by immunoblotting and RT-qPCR, PRC1-∆N78 failed to activate p53 and p21 (). In conclusion, PRC1-WT and PRC1-NLS3A lead to cell enlargement and multi-nucleation, which likely is the underlying cause of p53-pathway activation. To determine how expression of PRC1 affects the subcellular localization of p53, we performed immunostaining for p53 before and after induction of PRC1. As shown in Supplemental Figure S1, p53 was undetectable in uninduced cells. Strong p53 nuclear expression was detected after induction of PRC1 or PRC1-NLS3A, whereas no p53 expression could be detected following expression of PRC1-∆N78. siRNA mediated depletion of p53 before induction of PRC1 or PRC1-NLS3A confirmed that bi- and multinucleation as well cell size enlargement are not dependent on the presence of p53, placing the activation of p53 downstream to the effects of PRC1 on cytokinesis (Supplemental Figure S2A-D).
Expression of PRC1 leads to p53-dependent cellular senescence
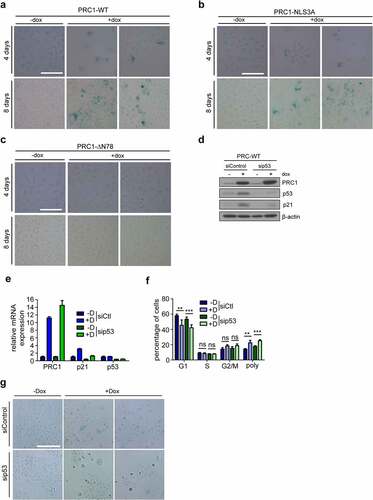
Because it been demonstrated to p53 activation due to cleavage failure can result in senescence or apoptosis, we next performed immunoblotting for cleaved PARP and cleaved caspase-3, markers for apoptotic cells. No cleaved PARP or cleaved caspase-3 were detected upon expression of PRC1, indicating that expression of PRC1 does not result in apoptosis (). Next, to test whether expression of PRC1 results in senescence, we induced PRC1-WT or PRC1-NLS3A for four and eight days and then stained cells for ß-galactosidase, a marker for senescent cells. PRC1 or PRC1-NLS3A, but not PRC1-∆N78 resulted in cells that stained positive for β-galactosidase, indicating that they became senescent (). Treatment with Nutlin-3, which inhibits the MDM2-p53 interaction and thus stabilizes p53, also resulted in activation of p21, proliferation arrest and senescence but not apoptosis of A549 cells, indicating that the p53-pathway is functional in these cells (Supplemental Figure S3A-E). However, different from PRC1, p53 stabilization by Nutlin-3 resulted in G1 cell cycle arrest and not in polyploidization (Supplemental Figure S3E). To directly test whether p53 is required for induction of p21 and for senescence following expression of PRC1, we depleted p53 by RNA interference and then investigated p21 expression and senescence. Depletion of p53 reduced the induction of p21 by PRC1 on mRNA and protein level without affecting the increase in polyploidy following PRC1 induction (). Importantly, depletion of p53 also reduced senescence upon PRC1 expression (). Similar to PRC1 overexpression, depletion of PRC1 in A549 cells also lead to stabilization of p53 and senescence [Citation20]. Thus, PRC1 levels have to be tightly regulated and only small deviations from normal PRC1 expression can be tolerated without affecting normal cell division.
Figure 6. Expression of PRC1 results in p53-dependent senescence but not in apoptosis A) -C) Expression of PRC1-WT (A), PRC1-NLS3A (B) or PRC1-∆N78 (D) was induced for 4 days or 8 days and senescent cells were detected by staining for ß-galactosidase. Bar: 100 μm. D) and E) Immunoblot and RT-qPCR analysis of p53 and p21 in cells transfected with a siRNA specific for p53 or with a control siRNA transfection and after induction of PRC1 with doxycycline. F) Flow cytometry analysis of the fraction of cells in different cell cycle phases. n = 3 biological replicates. **p < 0.001; ***p < 0.0001; ns: not significant. G) Cells were treated as in D. Senescent cells were detected by staining for ß-galactosidase. Bar: 200 μm.
Discussion
The functions of PRC1 in mitosis and cytokinesis are well established. In this study, we investigated whether PRC1 has additional functions besides its role as a microtubule-binding protein during cell division which could be important for better understanding its role in carcinogenesis and as a possible therapeutic target for cancer. Previous studies have shown that PRC1 is expressed during interphase before mitosis and is localized in the nucleus, which led to the hypothesis that PRC1 has nuclear specific functions in cancer cells that are independent from its role in cytokinesis [Citation7] [Citation17,Citation21]. Furthermore, the ability of the kinase CDK16 to promote proliferation of cancer cells has been linked to the phosphorylation of PRC1 in the nuclear localization signal (NLS), suggesting that regulated nuclear localization of PRC1 is relevant for cell cycle regulation [Citation19]. To uncover possible additional novel nuclear functions of PRC1, we determined the genome-wide expression changes upon expression of PRC1 by RNA-seq. Notably, we find that both wildtype PRC1 and PRC1-NLS3A, which is unable to enter the nucleus, result in highly comparable expression changes. There were no gene sets specific to wildtype PRC1 and unlike previous studies we did not find any indication of regulation of the Wnt-signaling pathway by PRC1. Instead, both wildtype PRC1 and PRC1-NLS3A resulted in activation of the p53 pathway, one of the most important tumor suppressors pathways which is activated upon cellular stress such as DNA damage, oxidative stress or oncogenic stress.
The induction of p53 is likely a direct consequence of overexpressed PRC1 to interfere with the normal function of PRC1 during cytokinesis ultimately leading to multinucleation. Abnormal mitosis and tetraploidization is known to trigger p53-stabilization and activation of p21 resulting in a tetraploid G1 state [Citation3,Citation22–24,]. The ΔN78 mutant of PRC1, which fails to bind the midzone and does not interfere with cytokinesis, does not result in multinucleation. This explains the absence of p53-activation and senescence upon expression of this mutant.
In addition to upregulation of p53 target genes we observed downregulation of the E2F-dependent transcriptional program by PRC1 which is consistent with indirect repression of pro-proliferative E2F-regulated cell cycle genes by p53 through the MuvB complex. Dependent on its interactions with different binding partners, MuvB an either repress or activate transcription [Citation25,Citation26,]. Specifically, when the MuvB core interacts with the p130 retinoblastoma protein paralog, and with E2F4 and DP1, it forms the DREAM complex, which represses E2F-dependent gene expression in quiescent cells and in early G1. Upon cell cycle entry, p130, E2F4, and DP1 dissociate from the complex and the MuvB core associates with the transcription factors B-MYB to form the Myb-MuvB (MMB) complex that activates genes with key functions in mitosis and cytokinesis. p53 indirectly inhibits cell cycle gene expression by induction of the cyclin-dependent kinase inhibitor p21 which lead to dephosphorylation of p130 and a switch from the activating MMB to the DREAM repressor complex that binds to and inhibits the promoters of cell cycle genes [Citation27–29,].
In many cancers, PRC1 is expressed at very high levels [Citation5], which may appear inconsistent with induction of the p53-pathway and inhibition of the E2F-dependent transcriptional program. Similar to what we observed here, high PRC1 expression in cancer may initially interfere with the normal function of PRC1 resulting in cytokinesis failure and CIN, the main source of tumor heterogeneity [Citation30]. This may not only drive tumor evolution but also lead to tumor cells tolerating elevated PRC1 levels and escaping the p53-mediated growth arrest. Of note similar to overexpression, depletion of PRC1 can also cause cytokinesis failure resulting in growth arrest [Citation714Citation814Citation1414Citation2014Citation3114Citation32,,,,]. Thus, levels of PRC1 have to be tightly regulated and only small deviations from normal PRC1 expression can be tolerated without affecting normal cell proliferation. Targeting the expression or function of PRC1 could therefore create a therapeutic vulnerability for the treatment of cancer. A better understanding of the mechanisms and pathways that provide tolerance of cancer cells to PRC1 expression may contribute to improved anti-cancer therapies.
Materials and methods
Cell culture
A549 were cultured in RPMI (Thermo Fisher Scientific) medium containing 10% FBS (Thermo Fisher Scientific) and 1% Penicillin-Streptomycin (Thermo Fisher Scientific) and were cultured at 37°C with 5% CO2. PRC1 expression was induced with 0.25 µg/ml of doxycycline (Sigma Aldrich) for 48 hours unless otherwise stated in the figure legends.
Antibodies
The following primary antibodies were used: PRC1 (H70): sc-8356 (Santa Cruz Biotechnology). Beta-Actin (C4): sc -47,778 (Santa Cruz Biotechnology). p53 (DO-1): sc-126 (Santa Cruz Biotechnology). p21 (clone EA10): OP64 (Calbiochem). Cleaved PARP (Asp214): 9541 (Cell Signaling Technology). Alpha-Tubulin (B-5-1-2): sc -23,948 (Santa Cruz Biotechnology). Anti-Flag M2: F3165 (Sigma Aldrich). Anti-Flag: F7425 (Sigma-Aldrich)
Generation of stable cell lines
The lentiviral pINDUCER system was used to generate cell lines stably expressing inducible flag-tagged PRC1 [Citation33]. Primers for cloning of PRC1 constructs are listed in Supplemental Table S1. Lentiviral particles were produced as described previously [Citation34]. Briefly, pINDUCER20 constructs were transfected together with psPAX2 and VSVg plasmid into 293T cells. After 24 hours, medium replaced by fresh medium. 48- and 72 hours post-transfection virus-containing medium was collected and used to infect cell lines. Cells were selected with 600–800 µg/ml neomycin.
Immunoblotting
Cells were lysed in TNN [50 mM Tris (pH 7.5), 120 mM NaCl, 5 mM EDTA, 0.5% NP40, 10 mM Na4P2O7, 2 mM Na3VO4, 100 mM NaF, 10 mg/mL phenylmethylsulfonyl fluoride, protease inhibitors (Sigma)]. Proteins were separated by SDS-PAGE, transferred to PVDF membrane and detected by immunoblotting.
Immunostaining
Cells were fixed in 3% paraformaldehyde, 2% sucrose in PBS, permeabilized with 0.2% Triton X-100 and blocked with 3% BSA for 30 minutes. Coverslips were incubated for 1 hour at room temperature with first antibodies followed by incubation with secondary antibodies diluted 1:500 in blocking solution for 30 minutes at room temperature. Cells were counterstained with 4ʹ,6-diamidino-2-phenylindole (Hoechst; Sigma) and mounted in IMMU-MOUNT (Thermo Fisher Scientific). Cells were investigated by fluorescence microscopy (Leica DMI 6000B). Images have been taken at the same exposure settings. Fluorescence signals were analyzed by Image J.
Flow cytometry
For flow cytometry, samples were washed once with ice cold PBS and then fixed in 80% ice cold ethanol. Then, cells were washed with ice cold PBS and resuspended with 38 mM sodium citrate with 500 µg/ml RNase A for 30 min at 37°C. Before cells were analyzed on a Beckman Coulter Fc500, 43 mM propidium iodide was added.
Senescence-Associated β-galactosidase assay
Senescence-associated ß-galactosidase activity was detected as described [Citation35]. Briefly, cells were fixed with 3.7% formaldehyde in PBS for 5 min and washed twice with PBS. X-gal staining solution [1 mg/ml X-Gal, 40 mM citric acid/sodium phosphate buffer (dibasic, each 200 mM), 5 mM potassium ferrocyanide (K4Fe(CN)6), 5 mM potassium ferricyanide (K3Fe(CN)6), 150 mM NaCl, 2 mM MgCl2] was added to the cells. Cells were incubated at 37°C and 5% CO2 for 16 h protected from light and then washed twice with PBS. The results were documented by microscopy.
siRNA transfection
A siRNA targeting p53 (GAGGUUGGCUCUGACUGUATdT) or a non-targeting control siRNA (UGGUUUACAUGUCGACUAA) was transfected with Lipofectamine RNAiMAX according to the manufacturer’s protocol (Thermo Fisher Scientific).
RNA isolation, reverse transcription, and quantitative real-time PCR
Isolation and quantification of RNA was performed as described previously [Citation36]. Briefly, total RNA was isolated with Total RNA Isolation Reagent (Thermo Fisher Scientific). 2 µg RNA was transcribed using 125 units MMuLv (Thermo Fisher Scientific). Quantitative real – time PCR reagents were from Thermo Scientific and real-time PCR was performed using the M×3000 (Agilent) detection system. Expression differences were calculated as described before [Citation37]. Primer sequences are listed in Supplemental Table S1.
RNA-Seq
Total RNA was isolated by using the RNeasy Mini Kit (Qiagen). RNA concentration and quality were measured by RNA analyzer (Advanced Analytical Technologies). mRNA was isolated by using NEBNext Poly(A) mRNA Magnetic Isolation Module (New England Biolabs). cDNA libraries were generated with 1 µg of purified mRNA by using NEBNext Ultra II RNA Library Prep Kit for Illumina (New England Biolabs). The quality of the cDNA library was determined by RNA analyzer (Advanced Analytical Technologies). Libraries were sequenced on the HiSeq500 platform (Illumina). Galaxy was used to analyze RNA-seq data (https://usegalaxy.org). HISAT2 was used to align RNA-seq reads against hg19 [Citation38]. FeatureCounts and limma were used to analyze differential expression [Citation39–41,,]. Metascape was used for identification of enriched pathways [Citation42]. Gene Set Enrichment Analysis (GSEA) [Citation43] and FGSEA [Citation44] was used to determine whether a set of genes is enriched or downregulated in a list of differentially expressed genes (ranked list of genes). The molecular signatures database (MSigDB) was used to download gene set collections for FGSEA or gene group analysis.
Statistical analysis
Statistical analyses were performed using Prism 9 (GraphPad Software). Statistical significance was determined using Student’s t-test. p values <0.05 were considered statistically significant.
Author contributions
S.G. and S.H. planned the study. S.G. and S.H. designed the experiments and analyzed the data. S.H., D.G. and W.J.S. conducted the experiments. C.P.A performed the next-generation sequencing. S.G. and SH analyzed the RNA-seq data. S.G. and S.H. wrote the manuscript.
Data availability
RNA-sequencing datasets are available at the NCBI’s Gene Expression Omnibus under the accession number GEO: GSE137940.
Acknowledgements
We thank Svenja Meierjohann and Markus Diefenbacher for reagents. We thank Susanne Spahr for her help with immunostaining experiments and Ryan Ramjan for measurements of RNA quality and cDNA library for RNA-seq.
Disclosure statement
No potential conflict of interest was reported by the authors.
Additional information
Funding
References
- Lens SMA, Medema RH. Cytokinesis defects and cancer. Nat Rev Cancer. 2019;19(1):32–45.
- Sansregret L, Swanton C. The role of aneuploidy in cancer evolution. Cold Spring Harb Perspect Med. 2017;7(1):a028373.
- Storchova Z, Kuffer C. The consequences of tetraploidy and aneuploidy. J Cell Sci. 2008;121(23):3859–3866.
- Carter SL, Eklund AC, Kohane IS, et al. A signature of chromosomal instability inferred from gene expression profiles predicts clinical outcome in multiple human cancers. Nat Genet. 2006;38:1043–1048.
- Li J, Dallmayer M, Kirchner T, et al. PRC1: linking cytokinesis, chromosomal instability, and cancer evolution. Trends Cancer. 2018;4(1):59–73.
- Bieling P, Telley IA, Surrey T. A minimal midzone protein module controls formation and length of antiparallel microtubule overlaps. Cell. 2010;142:420–432.
- Jiang W, Jimenez G, Wells NJ, et al. PRC1: a human mitotic spindle-associated CDK substrate protein required for cytokinesis. Mol Cell. 1998;2(6):877–885.
- Mollinari C, Kleman J-P, Jiang W, et al. PRC1 is a microtubule binding and bundling protein essential to maintain the mitotic spindle midzone. J Cell Biol. 2002;157(7):1175–1186.
- Subramanian R, Wilson-Kubalek EM, Arthur CP, et al. Insights into antiparallel microtubule crosslinking by PRC1, a conserved nonmotor microtubule binding protein. Cell. 2010;142(3):433–443.
- Zhu C, Jiang W. Cell cycle-dependent translocation of PRC1 on the spindle by Kif4 is essential for midzone formation and cytokinesis. Proc Natl Acad Sci USA. 2005; 102(2):343–348.
- Kellogg EH, Howes S, Ti S-C, et al. Near-Atomic cryo-EM structure of PRC1 bound to the microtubule. Proc Natl Acad Sci USA. 2016; 113(34):9430–9439.
- Hu C-K, Coughlin M, Mitchison TJ. Midbody assembly and its regulation during cytokinesis. Mol Biol Cell. 2012;23(6):1024–1034.
- Neef R, Grüneberg U, Kopajtich R, et al. Choice of Plk1 docking partners during mitosis and cytokinesis is controlled by the activation state of Cdk1. Nat Cell Biol. 2007;9(4):436–444.
- Kurasawa Y, Earnshaw WC, Mochizuki Y, et al. Essential roles of KIF4 and its binding partner PRC1 in organized central spindle midzone formation. Embo J. 2004;23(16):3237–3248.
- Zhu C, Zhao J, Bibikova M, et al. Functional analysis of human microtubule-based motor proteins, the kinesins and dyneins, in mitosis/cytokinesis using RNA interference. Mol Biol Cell. 2005;16(7):3187–3199.
- Bakhoum SF, Compton DA. Chromosomal instability and cancer: a complex relationship with therapeutic potential. J Clin Invest. 2012;122(4):1138–1143.
- Chen J, Rajasekaran M, Xia H, et al. The microtubule-associated protein PRC1 promotes early recurrence of hepatocellular carcinoma in association with the Wnt/β-catenin signalling pathway. Gut. 2016;65(9):1522–1534.
- Zhan P, Zhang B, Xi G-M, et al. PRC1 contributes to tumorigenesis of lung adenocarcinoma in association with the Wnt/β-catenin signaling pathway. Mol Cancer. 2017;16(1):108.
- Hernández-Ortega S, Sánchez-Botet A, Quandt E, et al. Phosphoregulation of the oncogenic protein regulator of cytokinesis 1 (PRC1) by the atypical CDK16/CCNY complex. Exp Mol Med. 2019;51(4):17–44.
- Hanselmann S, Wolter P, Malkmus J, et al. The microtubule-associated protein PRC1 is a potential therapeutic target for lung cancer. Oncotarget. 2018;9(4):4985–4997.
- Mollinari C, Kleman J-P, Saoudi Y, et al. Ablation of PRC1 by small interfering RNA demonstrates that cytokinetic abscission requires a central spindle bundle in mammalian cells, whereas completion of furrowing does not. Mol Biol Cell. 2005;16(3):1043–1055.
- Andreassen PR, Lohez OD, Lacroix FB, et al. Tetraploid state induces p53-dependent arrest of nontransformed mammalian cells in G1. Mol Biol Cell. 2001;12:1315–1328.
- Kuffer C, Kuznetsova AY, Storchova Z. Abnormal mitosis triggers p53-dependent cell cycle arrest in human tetraploid cells. Chromosoma. 2013;122(4):305–318.
- Margolis RL, Lohez OD, Andreassen PR. G1 tetraploidy checkpoint and the suppression of tumorigenesis. J Cell Biochem. 2003;88(4):673–683.
- Fischer M, Müller GA. Cell cycle transcription control: dREAM/MuvB and RB-E2F complexes. Crit Rev Biochem Mol Biol. 2017;52:1–25.
- Walston H, Iness AN, Litovchick L. DREAM on: cell cycle control in development and disease. Annu Rev Genet. 2021;55(1):1–21.
- Fischer M, Quaas M, Nickel A, et al. Indirect p53-dependent transcriptional repression of Survivin, CDC25C, and PLK1 genes requires the cyclin-dependent kinase inhibitor p21/cdkn1a and CDE/CHR promoter sites binding the DREAM complex. Oncotarget. 2015;6(39):41402–41417.
- Fischer M, Steiner L, Engeland K. The transcription factor p53: not a repressor, solely an activator. Cell cycle (Georgetown, Tex. 2014;13(19):3037–3058. DOI:10.4161/15384101.2014.949083.
- Mannefeld M, Klassen E, Gaubatz S. B-MYB iS required for recovery from the DNA damage–Induced G2 checkpoint in p53 mutant cells. Cancer Res. 2009;69(9):4073–4080.
- Potapova TA, Zhu J, Li R. Aneuploidy and chromosomal instability: a vicious cycle driving cellular evolution and cancer genome chaos. Cancer Metastasis Rev. 2013;32:377–389.
- Maton G, Edwards F, Lacroix B, et al. Kinetochore components are required for central spindle assembly. Nat Cell Biol. 2015;17(5):697–705.
- Zhu C, Lau E, Schwarzenbacher R, et al. Spatiotemporal control of spindle midzone formation by PRC1 in human cells. Proc Natl Acad Sci USA. 2006;103:6196–6201.
- Meerbrey KL, Hu G, Kessler JD, et al. The pINDUCER lentiviral toolkit for inducible RNA interference in vitro and in vivo. Proc Natl Acad Sci USA. 2011;108:3665–3670.
- Tiscornia G, Singer O, Verma IM. Production and purification of lentiviral vectors. Nat Protoc. 2006;1(1):241–245.
- Dimri GP, Lee X, Basile G, et al. A biomarker that identifies senescent human cells in culture and in aging skin in vivo. Proc Natl Acad Sci USA. 1995;92:9363–9367.
- Reichert N, Wurster S, Ulrich T, et al. Lin9, a subunit of the mammalian DREAM complex, is essential for embryonic development, for survival of adult mice, and for tumor suppression. Mol Cell Biol. 2010;30(12):2896–2908.
- Osterloh L, von EB, Schmit F, et al. The human synMuv-like protein LIN-9 is required for transcription of G2/M genes and for entry into mitosis. Embo J. 2007;26(1):144–157.
- Kim D, Langmead B, Salzberg SL. HISAT: a fast spliced aligner with low memory requirements. Nat Methods. 2015;12(4):357–360.
- Law CW, Chen Y, Shi W, et al. Voom: precision weights unlock linear model analysis tools for RNA-seq read counts. Genome Biol. 2014;15(2):17–29.
- Liao Y, Smyth GK, Shi W. featureCounts: an efficient general purpose program for assigning sequence reads to genomic features. Bioinformatics (Oxford, England. Bioinformatics. 2014;30(7):923–930.
- Liu R, Holik AZ, Su S, et al. Why weight? Modelling sample and observational level variability improves power in RNA-seq analyses. Nucleic Acids Res. 2015;43(15):e97.
- Zhou Y, Zhou B, Pache L, et al. Metascape provides a biologist-oriented resource for the analysis of systems-level datasets. Nat Commun. 2019;10(1):1523.
- Subramanian A, Tamayo P, Mootha VK, et al. Gene set enrichment analysis: a knowledge-based approach for interpreting genome-wide expression profiles. Proc Natl Acad Sci USA. 2005;102:15545–15550.
- Korotkevich G, Sukhov V, Budin N, et al. Fast gene set enrichment analysis. bioRxiv. 2021;060012. DOI:10.1101/060012