
ABSTRACT
The limitation of human dental pulp stem cells (DPSCs), which have potential application value in regenerative medicine, is that they are prone to age in vitro. Studies have shown adrenomedullin (ADM) is believed to promote the proliferation of human DPSCs, but whether it can also affect aging remains to be investigated. A lentivirus vector was used to construct human DPSCs overexpressing ADM. Senescence tests were carried out on cells of the 7th and 15th passage. Transcriptome analysis was conducted to analyze microRNA expression regulation changes after human DPSCs overexpressed ADM. H2O2 induced the aging model of human DPSCs, and we examined the mechanism of recovery of aging through transfection experiments with miR-152 mimic, pCDH-CCNA2, and CCNA2 siRNA. Overexpression of ADM significantly upregulated the G2/M phase ratio of human DPSCs in natural passage culture (P = 0.001) and inhibited the expression of p53 (P = 0.014), P21 WAF1 (P = 0.015), and P16 INK4A (P = 0.001). Decreased ROS accumulation was observed in human DPSCs during long-term natural passage (P = 0.022). Transcriptome analysis showed that miR-152 was significantly upregulated during human DPSC senescence (P = 0.001) and could induce cell senescence by directly targeting CCNA2. Transfection with miR-152 mimic significantly reversed the inhibitory effect of ADM overexpression on p53 (P = 0.006), P21 WAF1 (P = 0.012), and P16 INK4A (P = 0.01) proteins in human DPSCs (H2O2-induced). In contrast, pCDH-CCNA2 weakened the effect of the miR-152 mimic, thus promoting cell proliferation and antiaging. ADM-overexpressing human DPSCs promote cell cycle progression and resist cellular senescence through CCNA2 expression promotion by inhibiting miR-152.
1. Introduction
Human dental pulp stem cells (hDPSCs) are a heterogeneous population of cells isolated from human permanent third molar pulp. In recent years, these ready-made stem cells have been found to have important applications in dentistry and other fields [Citation1]. Extensive expansion of human DPSCs in vitro is a prerequisite for basic research and clinical development. However, in practice, human DPSCs often suffer from cell senescence in vitro [Citation2], which is accompanied by cell growth arrest, DNA damage, and senescence associated with galactosidase expression. Aging human DPSCS are unable to proliferate further and lose their differentiation potential, resulting in an insufficient number of cells available for further study. Prior to clinical application, the senescence levels of stem cells need to be determined and the percentage of senescent cells needs to be minimized [Citation2–4]. Therefore, how to maintain the long-term proliferation of human DPSCs during amplification to prevent their differentiation and senescence has become one of the research hotspots in this field.
Adrenomedullin (ADM), originally isolated from human brain pheochromocytoma, is a blood pressure-lowering peptide consisting of 52 amino acids [Citation5], and it has been reported to be involved in embryonic development and cell proliferation, differentiation, and migration [Citation5,Citation6]. Subsequent studies have found that ADM is also involved in vasodilation, cell growth, regulation of hormone secretion, and antibacterial effects [Citation7–9]. ADM plays an important role in mammalian development [Citation10] and is highly expressed in tooth tissues at key time points in tooth development. In our previous study, it was demonstrated that ADM promotes the proliferation of human DPSCs by activating the JNK/C-Jun pathway and inhibits the apoptosis of human DPSCs by activating the Src/SK-3b pathway. Overexpression of ADM promoted the cell cycle transition of dental pulp stem cells from G0/G1 phase to G2/M phase, suggesting that ADM overexpression may also delay senescence by delaying cell growth arrest [Citation10].
miRNAs are small noncoding RNAs (18–25 nucleotides) that negatively regulate gene expression by base-pairing with complementary sequences in the 3“-untranslated region (3”-UTR) of target mRNAs [Citation11]. miRNA-related regulation involves specific processes associated with cell aging, such as DNA damage and changes in genomic stability due to telomere shortening, epigenetic changes, cell aging, and stem cell depletion [Citation12]. Therefore, we speculate that the overexpression of ADM in hDPSCs may affect the expression levels of specific miRNAs, which in turn regulate target genes. On this basis, DPSCs overexpressing ADM were constructed first. Then, normal human DPSCs and ADM-overexpressing DPSCs were cultured, and the relationship between passage number and senescence level was observed. The gene network regulated by ADM overexpression was then analyzed in conjunction with transcriptome data to identify the specific mechanisms by which ADM affects the aging process.
2. Methods
2.1 Primary cell culture of human dental pulp
Human DPSCs (Cat No. 1047D) were purchased from Beijing SH Biotechnology Co., Ltd. and cultured in low-sugar Dulbecco’s modified Eagle’s medium (DMEM, GIBCO, Grand Island, NY, USA) containing 10% fetal bovine serum (FBS, GIBCO) and incubated in a constant temperature incubator containing 5% CO2 at 37°C. When a T25 culture flask was filled with cells (cell confluence was 90–100%), the culture was carried out at a ratio of 1:2. Human DPSCs at early passages (1–2) were used for the following experiments. For purchased dental pulp stem cells, we identified the surface markers CD73 and CD90 and the hematopoietic stem cell surface marker CD34 by western blot assay (shown in the results in supplement 1).
2.2 Construction of ADM and CCNA2 overexpression plasmids
First, the CDS of ADM (NM_001124.3) was searched using NCBI, and primers were designed for the entire sequence. The 5“end of the forward primer was introduced into the EcoRI restriction site, and the 3” end of the reverse primer was introduced into the BamHI restriction site. hDPSC (p3) RNA was extracted by the TRIzol method, and the RNA was reverse transcribed into cDNA using a reverse transcription kit (Novoprotein, Suzhou, China). The ADM gene was amplified by KOF High-fidelity DNA Polymerase (cat no. E003, Novoprotein) (the PCR product size was 558 bp). The PCR product and the pCDH-CMV-GFP-puro vector (Addgene, USA) were double digested with EcoRI and BamHI (NEB, USA) and ligated with T4 DNA ligase (Takara, Japan) at 16°C overnight [linearized plasmids (200 ng): PCR amplification product (75 ng) = 1:5, molar ratio]. DH5α (Sangon Biotech, Shanghai, China) competent cells were transformed and coated on agarose plates, and monoclonal cells were selected and sequenced. After the recombinant plasmid pCDH-ADM was successfully constructed, the plasmid was extracted using a plasmid extraction kit (Simgen, Hangzhou, China). The amplified primer sequences were as follows: ADM-EcoRI-F 5`-ATA GAA TTC CAG CCG GGA TGA AGC TGG T-3` and ADM-BamHI-R 5`-AGT GGA TCC CTA AAG AAA GTG GGG AGC AC-3`. The PCR system is detailed in the instructions of KOF high-fidelity DNA Polymerase, in which the total amount of cDNA template is 1 μg. PCR procedure: I. 94°C, 10 min; II. 30 cycles of 94 °C,30 s→60°C, 20 s→72 °C,40 s; III、72 °C,5 min.
2.3 DPSC infection with recombinant lentivirus
293T cells were prepared, and the pCDH-ADM (or control plasmid pCDH-CMV-GFP-puro), Δ8.91, and pVSV-G (mass ratio 10:10:1) were cotransfected with X-TremeGENE HP DNA transfection reagent (Roche). After 72 h, the recombinant lentivirus suspension was collected and filtered with a 0.45 µm filter. Polybrene was added to the collection at a final concentration of 2 µg/mL to infect target cells. Twenty-four hours after infection, a large amount of fluorescence was observed under the microscope, and it was determined preliminarily that the virus had successfully infected the cells. Culture medium containing 1 μg/mL puromycin was used to replace the standard culture medium for resistance screening, and the cells were grown for 7–9 days to remove uninfected cells. After cell selection was maintained for 7–9 days, the medium was changed to complete medium without puromycin. The stably expressing cells were detected by qPCR and western blotting, which confirmed that ADM was overexpressed in human DPSCs.
2.4 Induction of cell senescence
To induce cellular senescence, ADM-overexpressing human DPSCs (ADM-DPSCs) and control cells (human DPSCs) were subjected to successive passages for up to 15 generations to induce the natural senescence process.
2.5 β-galactosidase staining
Human DPSCs and ADM-DPSCs passaged to 7 and 15 generations were inoculated into 6-well plates at a density of 5000 cells/cm2 and cultured for 24 h. Cells were fixed using 1 mL of cell fixative (1.8% formaldehyde and 0.05% glutaraldehyde in PBS) for 5 min. Then, dropwise additions of 1 mL staining solution were added to the cells, and they were incubated in a thermostatic incubator at 37°C for 12 h. The staining results were photographed by inverted microscopy. The percentage of positive β-galactosidase-stained (blue) cells was calculated. The staining solution was PBS containing 5 mmol/L potassium ferricyanide, 5 mmol/L potassium ferricyanide, and 2 mmol/L MgCl2. A final concentration of 1 mg/mL X-gal was added at the time of use.
2.6 Cell cycle
Cell cycle analysis by propidium iodide (PI) staining was performed on human DPSCs and ADM-DPSCs passaged for 7 and 15 generations. Before resuspension with 300 µL PBS, the cells were washed twice with precooled PBS and centrifuged at 500 g. Cells were fixed at 4°C for 1 h by adding 700 µL anhydrous ethanol (prechilled at −20 °C) dropwise slowly under a turbine oscillator. A total of 1 × 10⁶ cells were incubated with 0.5 mL staining solution (10 μL of 2 mg/mL PI, 1 μL of 50 mg/mL RNase, and 489 μL of 1×BD buffer) for 30 min at room temperature and protected from light. Before flow cytometry, the cell suspension was first passed through a 200-mesh cell filter to remove adherent multicellular cells. Cell cycle detection was performed by flow cytometry (Life Attune, ABI). Target cells were selected by FSC-H and SSC-H channel voltage regulation (cells with small cell size and abundant voltage signals were excluded, which might be signals of cell fragments). When the signal was detected, the excitation wavelength was 488 nm, and the detection fluorescence was red. The results of the cell cycle assays were analyzed using FlowJo V10 (BD Biosciences).
2.7 Determination of reactive oxygen species (ros) by flow cytometry
The DCFH-DA probe was used to detect the level of ROS by flow cytometry in human DPSCs and ADM-DPSCs at passages 7 and 15. The cell suspension (5 × 10⁵) was incubated with 1 µg/mL DCFH-DA working buffer at 37°C for 30 min, and then the cells were washed and centrifuged, and the supernatant was taken. The cells were resuspended in 100 µL of PBS, and the fluorescence intensity was detected by a flow cytometer tuned to NxT (Life Technologies) at an excitation wavelength of 488 nm and analyzed by FlowJo V10. Additional DCFH-DA-stained cell suspensions were added to slides and observed under a fluorescence microscope (Leica, DM500).
2.8 Real-time quantitative PCR (Rt‒qpcr)
There were three parallel culture samples for each group of cells. Total cell RNA (2 × 10⁶) was extracted by the TRIzol (Invitrogen, USA) method. A NanoDrop One machine (Thermo, USA) was used to detect the absorbance of the extracted RNA at 260/280 nm (1.8–2.0 was RNA with qualified purity) and to determine the concentration and purity of RNA. First-strand cDNA was synthesized from 2 µg RNA using a cDNA reverse transcription kit (All-in-one 1st Strand cDNA Synthesis SuperMix, gDNA Purge, cat no. E044-01A, Novoprotein). For miRNA detection, the instructions of the miRNA cDNA Kit (KR211, Tiangen, China) were followed to obtain cDNA. cDNA (100 ng) was used as a template for qPCR detection, and NTC was used as a negative blank control (without template). qPCR was performed on the ABI 7500 system (Applied Biosystems) using SYBR Green PCR Master Mix (cat no. E168-01A, Novoprotein). The qPCR program was as follows: predenaturation at 95°C for 5 min; then 40 cycles of denaturation at 95°C for 15 s followed by extension at 60°C for 20 s; and a final extension at 72°C for 10 min. GAPDH and U6 were used as internal reference genes for normalization. The primers used for qPCR were purchased from Genwiz (Jiangsu, China). The comparative 2−ΔΔCt method was used to calculate relative gene expression levels, where ΔCt = target Ct – internal reference Ct, and ΔΔCt = ΔCt target - ΔCt calibrator. When the cDNA of each group of 3 samples was detected by qPCR, 3 parallel samples were set for detection. Details of the qPCR primer sequences are shown in .
Table 1. The qPCR primer sequences.
2.9 Western blotting
A total of 2 × 10⁶ cells were collected, lysed with RIPA buffer at 4°C for 10 min, and centrifuged at 10,000 × g for 15 min at 4°C. Five microliters of the supernatant was taken for protein concentration detection using the BCA kit, and the remaining supernatant was transferred, mixed, and boiled in sample buffer. The proteins were separated by SDS‒PAGE and transferred to PVDF membranes (Bio-Rad, USA). Then, the membranes were blocked with 5% skim milk for 1 h at room temperature. Rabbit anti-ADM (polyclonal, Cat no. ER65486), anti-CCNA2 (monoclonal, Cat no. ET1612–26), anti-p53 (monoclonal, Cat no. ET1601–13), anti-p21WAF1 (CDKN1A, polyclonal, Cat no. ER1906–07), anti-p16INK4A (CDKN2A, monoclonal, Cat no. ET1608–62), and the internal reference antibody GAPDH (monoclonal, Cat no. ET1601–4) were purchased from Hangzhou HuaAn Biotechnology Co., LTD and incubated overnight at 4°C. The membranes were rinsed in TBST buffer and incubated with HRP-conjugated goat anti-rabbit IgG antibody (polyclonal, cat no. HA1001) for 1 h. After TBST washing, the strips were exposed to ECL luminescent solution for exposure and photography by UVP instrumentation. The results of western blot detection were statistically quantified by ImageJ v1.8.0 (NIH, USA) software and normalized to GAPDH as an internal reference protein.
2.10 Transcriptome sequencing and analysis
The total RNA of human DPSCs and ADM-DPSCs was extracted by the TRIzol method, and the cells were screened for passage to the seventh passage. Then, transcriptomic analysis results are presented as mean values, the differential expression levels of genes and the changes in GO terms and KEGG pathways were analyzed by transcriptomic analysis. Age- and cycle-related genetic data were obtained from the GeneCard website. Target gene prediction was performed on the hsa-miR-152-3p sequence using miRDB (http://mirdb.org). To identify target genes, the obtained disease-related genes and KEGG senescence-related pathway altered genes were intersected with the hsa-miR-152-3p target gene CCNA2.
2.11 Double luciferase reporter activity assay
The partial sequences containing wild-type and mutant miR-152 binding sites in CCNA2-3‘UTR were cloned into the pISO luciferase vector (Promega, Madison, USA) to generate CCNA2-WT and CCNA2-MUT, respectively. pRL-TK was used as an internal reference plasmid. When 293T cells were 60% to 80% confluent, they were transfected with Lipo 2000, and 2.5 µL miR-152 mimic and NC mimic (negative control) synthesized by Genwiz Company at a final concentration of 100 nM were used. Relative luciferase activity, expressed as the ratio of firefly luciferase activity to Renilla luciferase activity, was determined using Promega GloMax in combination with Promega’s Dual Luciferase Reporter System.
The wild-type CCNA2 amplification primer sequences were as follows: ScaI-forward −5“-AAA AGT ACT GCT TTT TCT TGT TTT GCA C-3” and XbaI-reverse-5“-TGC TCT AGA AGG ACC TAA ATC TAT AAT A-3”. The amplification primer sequence of mutant CCNA2 was as follows: ScaI-forward-5 “-AAA AGT ACT GGT TTA AGT ACA GTA CGT GAC G-3” and XbaI-reverse-5“-TGC TCT AGA AGG ACC TAA ATC TAT AAT A-3”. The product size was 187 bp.
2.12 Construction of CCNA2-overexpressing cells
First, the CDSs of the CCNA2 gene (NM_001237.5) were downloaded from NCBI. The CCNA2 overexpression plasmid was constructed according to Section 2.2. XbaI (NEB) was introduced into the 5“end of the upstream primer of CCNA2, and EcoRI was introduced into the 3” end of the downstream primer. The PCR product size of the CCNA2 target band was 1260 bp. When T4 ligase was used, the molar ratio of linearized plasmids (200 ng) to PCR amplification product (170 ng) was 1:5. The same cloning scheme successfully constructed the plasmid pCDH-CCNA2 as pCDH-ADM, except it had different restriction sites. CCNA2-overexpressing hDPSCs were built according to Section 2.3.
The amplified primer sequences were as follows: CCNA2- XbaI-F 5`-CTA GTC TAG AAT GTT GGG CAA CTC TGC GC-3` and CCNA2- EcoRI-R 5`-ATA GAA TTC TTA CAG ATT TAG TGT CTC T-3`. The PCR system is detailed in the instructions of KOF high-fidelity DNA Polymerase, in which the total amount of cDNA template is 1 μg. PCR procedure: I. 94°C, 10 min; II. 30 cycles of 94 °C,30 s→60°C, 20 s→72 °C,90 s; III、72 °C,5 min.
2.13 H2O2 induction in a premature aging model of human DPSCs
DPSCs and ADM-DPSCs passaged to passage 3 after transfection were incubated for 16 h and then treated with 400 nM H2O2 [Citation13,Citation14]. Experiments were performed after 24 h of incubation.
2.14 Cell transfection
DPSCs and ADM-DPSCs (transfected and subcultured to the third generation) were divided into six groups: 1. DPSC group; 2. DPSC+Model group; 3. ADM-model group; 4. miR-152 group; 5. si-CCNA2 group; 6. miR-152+CCNA2 group. Two micrograms CCNA2, si-CCDA2 (100 nM) or miR-152 mimic (100 nM) was transfected into cells using Lipofectamine RNAiMAX (Thermo Fisher Scientific) at a concentration of 70–90%, and the cells were incubated in a 37°C CO2 incubator for 24 h. Groups 2–6 were treated with 400 nM H2O2 for 24 h. Senescent cells were stained with β-galactosidase after 48 h. The expression levels of cellular senescence-related genes and proteins were detected by qPCR and WB. In addition, as described above, 293T cells were transfected with miR-152 mimic and miR-NC to verify the regulation of CCNA2 gene levels.
2.15 Statistical methods
Statistics were performed using SPSS 22.0 statistical software. All experiments were repeated three times independently. One-way ANOVA was used for comparisons between multiple groups, and the LSD-t test was used for pairwise comparisons. *P < 0.05, indicated a statistically significant difference.
3. Results
3.1 Overexpression of ADM in dental pulp stem cells
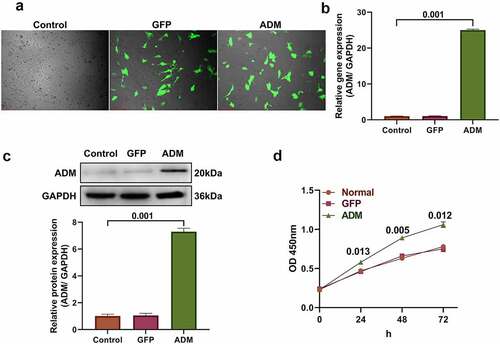
Human DPSCs infected with lentivirus showed green fluorescence under a fluorescence microscope (). qPCR detection showed that the relative expression level of the ADM gene in the ADM group was significantly higher than that in the control and GFP groups (P < 0.01, ). The western blotting results indicated that the ADM protein expression level in the ADM group was significantly higher than that in the control and GFP groups (), and the difference was statistically significant (P < 0.01). Then, cell proliferation was tested by the MTT assay, and the ADM-DPSC group grew significantly faster than the control and GFP groups (P < 0.05, ).
Figure 1. Construction of ADM-overexpressing dental pulp stem cells.
3.2 Effect of overexpression of ADM on the aging of human DPSCs
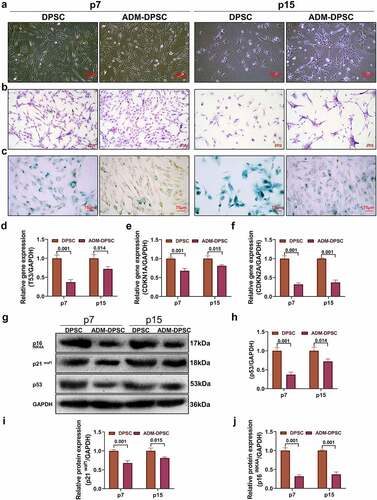
According to the results of phase contrast microscopy () and HE staining (), when the cells were cultured to p15, the hDPSCs became flat, the cytoplasm diffused, and the number of cells decreased significantly, presenting typical morphological changes of cell senescence [Citation15]. In the ADM-DPSC group, the number of cells decreased, but the cell morphology did not change significantly. The proportion of senescent cells was detected by β-galactosidase staining (), the results showed that the positive degree of β-galactosidase in the ADM-DPSCs group (the blue part in the figure) was lower than that in the DPSCs group at the 7th and 15th passages. The relative expression levels of the senescence-related genes TP53, CDKN1A, and CDKN2A were detected by qPCR (). The expression levels of TP53, CDKN1A, and CDKN2A in the ADM-DPSC group at the p7 and p15 generations were significantly lower than those in the DPSC group during the same period. The difference between groups was statistically significant (P < 0.05). Western blotting of the senescence-related proteins p53, p21WAF1, and p16INK4A (). showed that their levels were significantly lower in the ADM-DPSC group than those in the DPSC group at both passages 7 and 15. The differences between groups were statistically significant (P < 0.05).
Figure 2. Effect of ADM overexpression on DPSC senescence.
3.3 Effects of ADM overexpression on the DPSC cell cycle and proliferation level
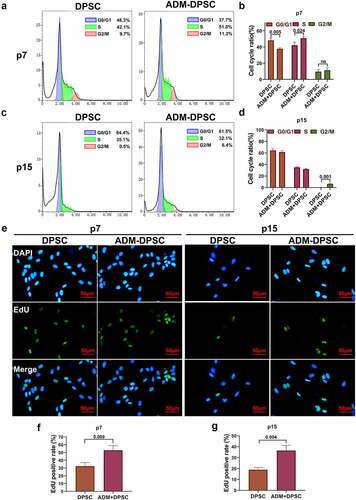
The cell cycle levels in each group were detected by flow cytometry (). The results showed that the percentage of cells in the G2/M phase in the DPSC group decreased significantly when the cells were passaged to passage 15, and there were basically no cells in the G2/M phase at passage 15 (only 0.5%). In contrast, the percentage of cells in the G2/M phase in the ADM-DPSC group was 6.4%. The difference between the two groups was statistically significant. The results of edU detection showed that the positive level of EdU in the ADM-DPSC group was significantly higher than that in the DPSC group at passages 7 and 15, and the difference between the groups was statistically significant (P < 0.05, ).
Figure 3. Effect of ADM overexpression on the human DPSC cell cycle and proliferation level.
3.4 Effect of ADM overexpression on the oxidative stress level of hDpscs
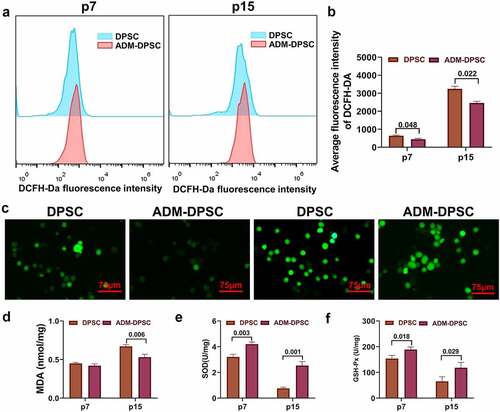
ROS accumulation in the ADM-DPSC group was significantly lower than that in the DPSC group, as shown by flow cytometry (P < 0.05,). Cellular ROS staining intensity by fluorescence microscopy after a flow cytometry assay () showed that the accumulation of ROS in the DPSC and ADM-DPSC groups was stronger at 15 generations than at 7 generations. At 15 generations, the fluorescence binding intensity of the DCFH-Da probe in the DPSC group was stronger than that in the ADM-DPSC group, which was consistent with the results of the flow cytometry assay. The detection of the oxidative stress indicators MDA, SOD, and GSH-Px () suggested that the MDA levels in the DPSC and ADM-DPSC groups were significantly higher at 15 generations, and the MDA levels in the DPSC group were significantly higher than those in the ADM-DPSC group (P < 0.05). The SOD and GSH-Px activities of both groups showed a decreasing trend from the 7th generation to the 15th generation, and the enzyme activity was significantly lower in the DPSC group than in the ADM-DPSC group (P < 0.05).
Figure 4. Effect of ADM overexpression on the oxidative stress level of human DPSCs.
3.5 Effect of ADM overexpression in DPSCs on the regulation of aging-related gene networks
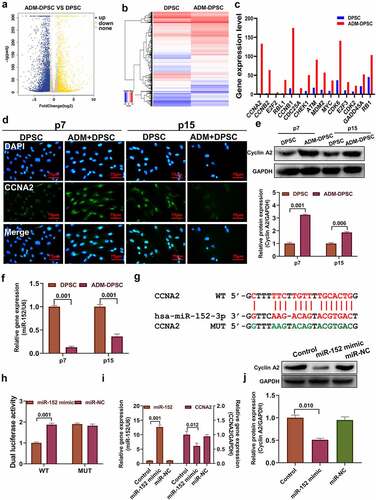
A comparison of the transcriptomes of the DPSC group and ADM-DPSC group cells at the 7-generation phase () showed that 6545 genes were upregulated and 2198 genes were downregulated after overexpression of ADM. A total of 15 genes coassociated with aging in the same cycle were screened from the top 100 genes significantly upregulated by KEGG and GO analysis, and the expression levels of these 15 genes in the transcriptome are shown in . CCNA2 had the greatest difference in gene expression regulation by immunofluorescence (). It was confirmed that CCNA2 is upregulated after overexpression of ADM, and the protein is mainly located in the nucleus. The results of Western blotting () showed that the CCNA2 protein expression level was significantly increased after overexpression of ADM, and the difference was statistically significant compared with that in the DPSC group (P < 0.05). The expression level of the miR-152 gene detected by qPCR () showed that overexpression of ADM could significantly inhibit the expression level of the miR-152 gene compared with the control group, and the difference was statistically significant (P < 0.01). It showed the targeted binding sites (red) and mutation sequences (green) of miR-152-3p and CCNA2 3’ UTR sequences (). Double luciferase activity assay showed the targeted binding relationship between miR-152-3p and the CCNA2 3`UTR, and miR-152 mimic significantly inhibited the fluorescence reporter activity of wild-type CCNA2 plasmid but not the fluorescence intensity of the mutant plasmid. The miR-152 gene expression level of 293T cells was significantly increased after transfection with miR-152 mimic, while the CCNA2 gene expression level was significantly inhibited (P < 0.05, ). The level of CCNA2 protein expression was significantly inhibited in 293T cells after transfection with miR-152 mimic, as confirmed by the western blot results.
Figure 5. Effect of ADM overexpression in human DPSCs on the regulation of aging-related gene networks.
3.6 ADM affects cell senescence and the cell cycle by regulating the DPSC miR-152/CCNA2 axis
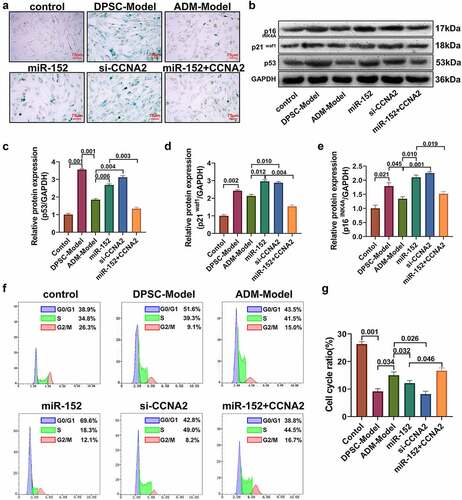
The results of the β-galactosidase assay showed () that β-galactosidase levels were increased in human DPSCs treated with 400 nM H2O2. Overexpression of ADM effectively reduced the level of β-galactosidase positive staining associated with cellular senescence. After transfection of miR-152 mimic and CCNA2 siRNA, the positive level of β-galactosidase staining in human DPSCs increased, and overexpression of the CCNA2 gene effectively reversed the β-galactosidase staining caused by transfection of miR-152 mimic. After miR-152 mimic and CCNA2 siRNA transfection, the protein expression levels of p53, p21WAF1 and p16INK4A were significantly upregulated (). Compared with the ADM-model group, the difference was statistically significant (P < 0.05). Overexpression of the CCNA2 gene effectively reversed the effect of miR-152 mimic transfection resulting in increased aging-related protein levels, and the difference between the two groups was statistically significant (P < 0.05). The results showed that compared with the ADM-model group, transfection of miR-152 mimic or CCNA2 siRNA reduced the proportion of human DPSCs in G2/M phase (P < 0.05). Overexpression of CCNA2 effectively reversed the reduction effect of the miR-152 mimic on the G2/M phase (P < 0.05).
Figure 6. ADM affects cell senescence and the cell cycle by regulating the human DPSC miR-152/CCNA2 axis.
4. Discussion
Cell senescence is an inevitable biological phenomenon associated with age or prolonged in vitro culture. It is characterized by a general deterioration of physiological functions. Stem cell senescence is considered to be the main cause of tissue and organ function decline and may affect the efficacy of stem cell therapy [Citation16].
In our previous study [Citation10], it was demonstrated that overexpression of ADM promotes the percentage of G2/M phase cells in human DPSCs, which suggests that overexpression of ADM enables human DPSCs to acquire a more sustained proliferative division capacity. The cell cycle is a coordinated series of events leading to cell division and is critical to the development and viability of multicellular organisms. Stable cell cycle arrest, which marks the inability of cells to continue dividing, is one of the indispensable features of senescent cells [Citation17]. Therefore, we hypothesized that ADM overexpression might facilitate cell proliferation and even delay the onset of premature cellular senescence during prolonged in vitro cultivation. In this study, cellular senescence was examined in normal human DPSCs and ADM-overexpressing human DPSCs by successive passages for 15 generations.
First, during long-term culture, human DPSCs exhibited morphologically typical senescent morphology, including enlarged and flattened shapes after natural passage for 15 passages [Citation18,Citation19]. The senescence-associated proteins p53/p21WAF1/CIP1 and p16INK4A were examined at the protein level, and the p53/p21WAF1 and p16INK4A pathways were found to be significantly upregulated in senescent human DPSCs, while ADM overexpression effectively suppressed the increase in senescent protein expression. Notably, cell cycle arrest in senescence is mainly mediated by activation of one or both of the p53/p21WAF1 and p16INK4A/pRB tumor suppressor pathways [Citation20–22]. Studies have also confirmed the presence of significant cell cycle arrest in 15 generation stage human DPSCs with the proportion of cells in the G2/M phase almost converging to zero.
Furthermore, at the molecular level, a major determinant of aging is the intracellular accumulation of ROS-induced oxidative damage [Citation23,Citation24]. Oxygen radicals produced by mitochondria lead to extensive oxidative damage and eventually senescence [Citation25]. One of the roles of ROS is to promote senescence, induce cytotoxicity and enter a feed-forward cycle: ROS cause damage to mitochondrial components, which in turn produces more ROS [Citation26]. Thus, oxidative stress levels are often present as a vicious cycle during aging [Citation27]. ADM can alleviate oxidative stress levels in human DPSCs and further mitigate the cellular senescence process through the detection of oxidative stress levels. Studies have demonstrated that ADM Leydig cells protect against lipopolysaccharide-induced oxidative stress and inflammatory responses via the MAPK/NF-κB signaling pathway [Citation28] and reduce doxorubicin-induced cardiac oxidative stress injury in rats. This further confirms that ADM delays the premature failure of human DPSCs.
Given the above observed alleviating effects of ADM on senescence and cycle arrest, we determined gene regulatory changes by transcriptome assay in human DPSCs after overexpression of ADM. The results suggested that most of the significantly differentially expressed genes associated with the cell cycle and senescence were upregulated after ADM overexpression. CCNA2 scored the highest among the many differentially regulated genes. Meanwhile, miR-152 was significantly downregulated in the transcriptome data. A targeted regulatory relationship between miR-152-3p and the CCNA2 3`UTR was predicted through the miRDB website. Therefore, we speculate that ADM overexpression may have suppressed the expression level of the miR-152 gene, which in turn deregulated the targeting effect of miR-152 on the CCNA2 gene, causing CCNA2 gene expression.
miR-152 belongs to the miR-148/152 family, whose members share the same seed sequence and act as tumor suppressors in many cancers [Citation29]. In human lung fibroblasts and human skin fibroblasts, miR-152 is significantly upregulated during replicative senescence, while transfection with miR-152 mimic is able to significantly upregulate the expression of senescence marker proteins p53 and p16INK4A and increase the number of cells positive for SA-β-galactosidase staining [Citation30]. In contrast, in a study by Gu et al., miR-152 was demonstrated to be upregulated during dental pulp stem cell senescence and to induce senescence in human dental pulp stem cells by inhibiting SIRT7 expression [Citation31]. Cell cycle protein A2 (CCNA2) plays a key role in controlling the G1/S transition by binding and activating Cdk2 [Citation32], and deletion of CCNA2 and Cdk2 significantly impairs cell proliferation [Citation33]. Xu et al [Citation34]. suggested that the p53/miRNA/CCNA2 pathway could act as a novel regulator of cellular senescence: a complement to the classical p53/p21 pathway. It was suggested that the upregulation of p53 during senescence may further promote the transcription of miRNAs targeting the CCNA2 gene and that inhibition of CCNA2 can accelerate the cellular senescence process. Therefore, we speculate that decreased miR-152 gene levels and high expression of CCNA2 may be closely associated with the alleviation of senescence after overexpression of ADM.
Through the late double luciferase reporter and miR-152 mimic regulatory level study, we confirmed the target binding relationship between miR-152-3p and CCNA2. Moreover, the detection of senescence-related proteins and β-galactosidase both confirmed that CCNA2 knockdown and miR-152 overexpression could eliminate the delaying effect of ADM overexpression on cellular senescence. Meanwhile, overexpression of CCNA2 also attenuated the accelerating effect of the miR-152 mimic on cellular senescence.
5. Conclusion
The present study suggests that overexpression of ADM may exert senescence resistance in human DPSCs by regulating the miR-152/CCNA2 axis. This finding could provide a research basis for solving the problem of poor therapeutic effects of stem cells due to susceptibility to senescence in dental pulp stem cell transplantation therapy.
Author contributions
W D and J X performed the examination, and was responsible for the conception and design of the work, and writing of the first draft. J C, J Z, and Z X were responsible for data acquisition, analysis, and interpretation of data. Z W was responsible acquisition, analysis, interpretation of data for the work, and verifying the final draft. Q Z carried out the final check for all the data and the final approval of the version to be published. All authors read and approved the final manuscript.
Availability of data and materials
The datasets used and analyzed during the current study are available from the corresponding author on reasonable request.
Disclosure statement
No potential conflict of interest was reported by the author(s).
Additional information
Funding
References
- Siddiqui Z, Acevedo-Jake AM, Griffith A, et al. Cells and material-based strategies for regenerative endodontics[J]. Bioactive Materials. 2022.
- Morsczeck C. Cellular senescence in dental pulp stem cells. Arch Oral Biol. 2019;99:150–155.
- Rodier F, Campisi J. Four faces of cellular senescence. J Cell Biol. 2011;192(4):547–556.
- Yi Q, Liu O, Yan F, et al. Analysis of senescence-related differentiation potentials and gene expression profiles in human dental pulp stem cells. Cells Tissues Organs. 2017;203(1):1–11. DOI:10.1159/000448026
- Kitamura K, Kangawa K, Kawamoto M, et al. Adrenomedullin: a novel hypotensive peptide isolated from human pheochromocytoma. Biochem Biophys Res Commun. 1993;425(3):548–555. 2012: 10.1016/j.bbrc.2012.08.022.
- Garayoa M, Bodegas E, Cuttitta F, et al. Adrenomedullin in mammalian embryogenesis. Microsc Res Tech. 2002;57(1):40–54.
- Bełtowski J, Jamroz A. Adrenomedullin–what do we know 10 years since its discovery. Pol J Pharmacol. 2004;56(1):5–27.
- Martínez A, Elsasser TH, Muro-Cacho C, et al. Expression of adrenomedullin and its receptor in normal and malignant human skin: a potential pluripotent role in the integument. Endocrinology. 1997;138(12):5597–5604. DOI:10.1210/endo.138.12.5622
- Zudaire E, Cuttitta F, Martínez A. Regulation of pancreatic physiology by adrenomedullin and its binding protein. Regul Pept. 2003;112(1–3):121–130.
- Zhu Q, Tian G, Tang Z, et al. Adrenomedullin promotes the proliferation and inhibits apoptosis of dental pulp stem cells involved in divergence pathways. J Endod. 2016;42(9):1347–1354.
- Shukla GC, Singh J, Barik S. MicroRnas: processing, Maturation, Target Recognition and Regulatory Functions. Mol Cell Pharmacol. 2011;3(3):83–92.
- Harries LW. MicroRnas as mediators of the ageing process. Genes (Basel). 2014;5(3):656–670.
- Chang YO, Park S, Jang HO, et al. FK866 protects human dental pulp cells against oxidative stress-induced cellular senescence. Antioxidants. 2021;10(2):271.
- Park S, Bak KJ, Chang YO, et al. Melatonin rescues human dental pulp cells from premature senescence induced by HO. 2017.
- Beck J, Horikawa I, Harris C. Cellular senescence: mechanisms, morphology, and mouse models. Vet Pathol. 2020;57(6):747–757.
- Sahin E, Depinho RA. Linking functional decline of telomeres, mitochondria and stem cells during ageing. Nature. 2010;464(7288):520–528.
- Kumari R, Jat P. Mechanisms of cellular senescence: cell cycle arrest and senescence associated secretory phenotype. Front Cell Dev Biol. 2021;9:645593.
- Rossi M, Abdelmohsen K. The emergence of senescent surface biomarkers as senotherapeutic targets. Cells. 2021;10(7):1740.
- Zheng Y, Hu CJ, Zhuo RH, et al. Inhibition of autophagy alleviates the senescent state of rat mesenchymal stem cells during long-term culture. Mol Med Rep. 2014;10(6):3003–3008.
- Kamal S, Junaid M, Ejaz A, et al. The secrets of telomerase: retrospective analysis and future prospects. Life Sci. 2020;257:118115.
- Liu X, Wan M. A tale of the good and bad: cell senescence in bone homeostasis and disease. Int Rev Cell Mol Biol. 2019;346:97–128.
- Rovillain E, Mansfield L, Lord CJ, et al. An RNA interference screen for identifying downstream effectors of the p53 and pRB tumour suppressor pathways involved in senescence. BMC Genomics. 2011;12(1):355.
- Jenkins NC, Liu T, Cassidy P, et al. The p16(ink4a) tumor suppressor regulates cellular oxidative stress. Oncogene. 2011;30(3):265–274. DOI:10.1038/onc.2010.419
- Magenta A, Cencioni C, Fasanaro P, et al. miR-200c is upregulated by oxidative stress and induces endothelial cell apoptosis and senescence via ZEB1 inhibition. Cell Death Differ. 2011;18(10):1628–1639. DOI:10.1038/cdd.2011.42
- Chistiakov DA, Sobenin IA, Revin VV, et al. Mitochondrial aging and age-related dysfunction of mitochondria. Biomed Res Int. 2014;2014:238463.
- De Gaetano A, Gibellini L, Zanini G, et al. Mitophagy and oxidative stress: the role of aging. Antioxidants (Basel). 2021;10(5):794.
- Liguori I, Russo G, Curcio F, et al. Oxidative stress, aging, and diseases. Clin Interv Aging. 2018;13:757–772.
- Hu W, Shi L, Li MY, et al. Adrenomedullin protects Leydig cells against lipopolysaccharide-induced oxidative stress and inflammatory reaction via MAPK/NF-κB signalling pathways. Sci Rep. 2017;7(1):16479. DOI:10.1038/s41598-017-16008-x
- Huang J, Wang Y, Guo Y, et al. Down-regulated microRNA-152 induces aberrant DNA methylation in hepatitis B virus-related hepatocellular carcinoma by targeting DNA methyltransferase 1. Hepatology. 2010;52(1):60–70.
- Mancini M, Saintigny G, Mahé C, et al. MicroRNA-152 and -181a participate in human dermal fibroblasts senescence acting on cell adhesion and remodeling of the extra-cellular matrix. Aging (Albany NY). 2012;4(11):843–853.
- Gu S, Ran S, Liu B, et al. miR-152 induces human dental pulp stem cell senescence by inhibiting SIRT7 expression. FEBS Lett. 2016;590(8):1123–1131.
- Blanchard JM. Cyclin A2 transcriptional regulation: modulation of cell cycle control at the G1/S transition by peripheral cues. Biochem Pharmacol. 2000;60(8):1179–1184.
- Gopinathan L, Tan SL, Padmakumar VC, et al. Loss of Cdk2 and cyclin A2 impairs cell proliferation and tumorigenesis. Cancer Res. 2014;74(14):3870–3879.
- Xu S, Wu W, Huang H, et al. The p53/miRnas/Ccna2 pathway serves as a novel regulator of cellular senescence: complement of the canonical p53/p21 pathway. Aging Cell. 2019;18(3):e12918. DOI:10.1111/acel.12918