
ABSTRACT
FADD, a classical apoptotic signaling adaptor, has recently been reported to exhibit a series of non-apoptotic functions. Here, we report that FADD may play a critical role in the development of renal fibrosis. Neutrophil infiltration in the renal interstitial part, glomerular mesangial cell proliferation, and base-membrane thickening were observed in FADD-D mice by H&E, PAS, and PASM staining. Immunofluorescence analysis revealed that macrophage infiltration was significantly enhanced in FADD-D mice. Renal fibrosis might be induced by IgA nephritis in FADD-D mice as evidenced by increased Ki67 and type IV collagen. Additionally, the levels of α-SMA, Fibronectin, and Vimentin were also found to be elevated. Mechanism study indicated that the TLR4/myD88/NF-κB signaling pathway was activated in FADD-D mice. Moreover, FADD phosphorylation activated the mTOR and TGF-β/Smad pathway and accelerated the process of epithelial mesenchymal transition. Further studies indicated that the TGF-β1 pathway was also activated and the process of EMT was accelerated in both FADD-disrupted HEK293 cells and FADD-deficient MES cells. Thus, we concluded that FADD phosphorylation could lead to IgA nephritis and eventually result in renal fibrosis. Taken together, our study provides evidence, for the first time, that FADD, especially in its phosphorylated form, has an effect on the development of renal fibrosis.
Abbreviations: FADD: FAS-associated protein with death domain; DED: death effector domain; DD: death domain; CKD: chronic kidney disease; ECM: extracellular matrix; ESRD: end-stage renal disease; RRT: renal replacement therapy; H&E: hematoxylin and eosin; PASM: periodic acid silver methenamine
Introduction
In 1995, FADD (FAS-associated protein with death domain) protein was originally identified as a ligand protein of Fas-induced apoptosis. It is a 23 kDa protein, containing the N-terminal death effector domain (DED) and the C-terminal death domain (DD) [Citation1–3]. Functionally, apart from its critical role in apoptosis, FADD also participates in many non-apoptotic activities, such as inflammation [Citation4,Citation5], autophagy [Citation6,Citation7], lymphocyte development and proliferation [Citation8], cell cycle progression [Citation9,Citation10], embryonic development [Citation11], tumorigenesis [Citation12,Citation13], glucose metabolism [Citation14,Citation15], and innate natural immunity [Citation16,Citation17]. Further studies have indicated that the non-apoptotic function of FADD may be related to its phosphorylation [Citation18]. The phosphorylation site (serine 191 in mice and serine 194 in humans) of FADD protein is outside of the apoptotic domains. FADD-D mice (Asp mutation in the serine 191 of FADD), mimicking constitutive phosphorylation at serine 191, were used to investigate the physiological functions of FADD phosphorylation in our previous studies [Citation9,Citation19–21]. In this study, the relationship between FADD phosphorylation and renal fibrosis was also investigated in FADD-D mice.
In previous studies, Welz et al [Citation4]. found that mice with intestinal epithelial cell (IEC)-specific knockout of FADD (FADDIEC-KO) spontaneously developed enteritis colitis and demonstrated that FADD might be involved in intestinal inflammation through RIP3-dependent death. Similar observations were also noted in the skin. Marion C. Bonnet et al [Citation5]. showed that epidermal keratinocyte-specific deletion of FADD triggered a severe inflammatory skin disease in mice, and genetic evidence revealed that the necrotic death of FADD-deficient keratinocytes was also RIP3-dependent. Suruchi N. Schock et al [Citation22]. reported that mice with myeloid cells deficient for FADD (mFADD−/−) showed systemic inflammation with increased levels of inflammatory cytokines and elevated levels of myeloid and B cell populations. This mFADD−/− systemic inflammation was observed to be RIP3-dependent and MyD88-dependent. These findings suggest that FADD may be closely associated with inflammation response.
One of the omen of chronic kidney disease (CKD) is renal fibrosis in which normal tissue architecture was disrupted due to the accumulation of the extracellular matrix (ECM), leading to progressive renal dysfunction and end-stage renal disease (ESRD), necessitating renal replacement therapy (RRT) [Citation23–25]. The progression of renal fibrosis usually occurs in three steps: infiltration of monocytes/macrophages and other inflammatory cells; upregulation of fibrogenic cytokine; and the increase of matrix protein synthesis and inhibition of matrix degradation [Citation26,Citation27]. Renal fibrosis accompanies a variety of primary or secondary continuous progression of kidney diseases, and finally, normal kidney tissue structure is replaced by ECM, resulting in irreversible damage of renal function. Previous study has revealed that FADD plays an important role in dermatitis and enteritis [Citation4]. However, it has not been reported whether FADD is associated with nephritis and renal fibrosis.
In this study, we found that FADD phosphorylation had an impact on renal function. With investigations on the renal function of FADD-D mice, the non-apoptotic functions of FADD and its phosphorylation were then expanded, providing a further understanding and insight into renal fibrosis.
Material and methods
Ethics statement
The animal experiments involving mice performed in this study were authorized by Nanjing University Animal Care and Use Committee.
Animals
Animals were raised in specific pathogen-free animal facility at an ambient temperature of 21°C with a 12-h light-dark cycle. They were free to intake water and food. Mice aged 8–10 weeks were used for the experiments. FADD-D mice were generated according to all the protocols which have been described previously [Citation9].
Renal function analysis
Mice were weighed, euthanized, and dissected before weighing both kidneys. Mice were enclosed in metabolic cages to collect 24 h-urine output. The levels of 24 h urinary protein in urine, the levels of creatinine, blood urea nitrogen, and uric acid in serum were determined using the according assay kits (Nanjing Jiancheng Bioengineering Institute, Nanjing, China). The Giemsa staining kit (Nanjing Jiancheng Bioengineering Institute, Nanjing, China) was used to observe the profiles of blood cells under a microscope.
Histology
Fixed kidney tissue was embedded in paraffin and sectioned at 5 μm, followed by hematoxylin and eosin (H&E) staining, periodic acid silver methenamine (PASM) staining, and Masson staining. H&E staining was used to observe the renal interstitial and glomerular tissues. PASM staining to detect collagen-stained areas and Masson staining to detect fibrotic areas in the kidney were performed using the specific kits (Wuhan Google Biological Technology Co., LTD, Wuhan, China). The staining was then observed under a B×43F microscope (Olympus, Tokyo, Japan) and the images were then analyzed with the Image pro-plus 6.0 software. Carnoy solution (60% ethanol, 30% chloroform, and 10% glacial acetic acid) was used to fix the kidney samples. For glycogen detection, fixed sample was stained with the Periodic Acid-Schiff (PAS) Kit (Sigma Aldrich, St. Louis, MO).
For immunohistochemical staining, the kidney sections were stained with specific antibodies against CD31, Ki67 and type IV collagen (Cell Signaling Technology, Beverly, MA) and visualized with DAB (Shenzhen Fumax Technology Co. Limited, Shenzhen, China).
For immunofluorescence staining, the expression profiles of FADD were analyzed in the kidney to help explain the phenotypes. The positive expression levels of EMT markers, such as anti-ɑ-SMA (Boster, Wuhan, China), anti-Fibronectin (BD Biosciences, Franklin Lakes, NJ), and anti-Vimentin (BD Biosciences, Franklin Lakes, NJ) were detected. The immunofluorescence assay was also used to detect the inflammation infiltration with anti-F4/80 antibody (Cell Signaling Technology, Beverly, MA, USA) and IgA deposition with anti-IgA antibody (BD Biosciences, Franklin Lakes, NJ). The Alexa Fluor 488-conjugated anti-rabbit IgG antibody or anti-mouse IgG antibody (Invitrogen, Carlsbad, CA) was used as the secondary antibody. 4,6-diamidino-2-phenylindole (DAPI) was used to stain nuclear DNA. Images were then obtained using an Axiophot2 microscope (Zeiss, Jena, Germany).
Cell culture
HEK293 cells were cultured in Dulbecco’s modified Eagle medium (DMEM) (Hyclone, Logan, UT) supplemented with 10% fetal bovine serum (FBS) (Gibco BRL, USA). The mouse glomerular mesangial cell line MES-13 (abbreviated as MES in this study) cells were a kind gift from Xuzhou Medical University and these cells were cultured in RPMI 1640 supplemented with 10% FBS.
SiRNA transfection
siRNA oligonucleotides against FADD-targeted sequence siFADD-F: 5’-GCGGGUGGCAUUUGACAUUTT-3’, siFADD-R: 5’-AAUGUCAAAUGCCACCCGCTT-3’ were designed and synthesized by GenePharma (Shanghai GenePharma Co., Ltd, Shanghai, China). HEK293 cells were transiently transfected with human FADD specific and nonspecific siRNAs (400 nmol/L) using Lipofectamine 2000 transfection reagent (Invitrogen, USA) in reduced-serum Opti-MEM (Gibco BRL, USA) according to the manufacturer’s instructions with minor modifications.
Plasmid transfection
Briefly, FADD CRISPR interference cDNAs were obtained by PCR, as previously described [Citation28], and then subcloned into the p×330 vector. The CRISPR interference primers used were as follows: mfadd-Sacas9-F: 5’- CACCGTACCCCCGAAGTCTGAGTGA-3’, mfadd-Sacas9-R:5’- AAACTCACTCAGACTTCGGGGGTAC-3’, re-FADD-SaCas9-F: 5’- CACCGTGCCCGACAGGCTGCCGGACA-3’, re-FADD-SaCas9-R: 5’- AAACTGTCCGGCAGCCTGTCGGGCAC-3’. The p×330 CRISPR interference plasmids were transiently transfected into MES cells using Lipofectamine 2000 (Invitrogen, USA) in reduced-serum Opti-MEM medium (Gibco BRL, USA) according to the manufacturer’s instructions with minor modifications. An FADD interference stable cell line was then constructed.
Western blotting
Kidney tissue was collected from sacrificed mice and homogenized in lysis buffer for 30 min. After centrifugation for 10 min at 10,000 × g, the supernatant was collected, and protein concentration was quantified by the BCA protein concentration determination kit (Beyotime Institute of Biotechnology, Shanghai, China). The cells were subjected to the same treatment as the tissue. For western blotting, total protein (50 μg) were segregated using 8–12% SDS-PAGE and then transferred onto the PVDF membrane. Blots were incubated using antibodies against TLR4, myD88, NF-κB (Santa Cruz Biotechnology, Inc., Santa Cruz, CA), Smad2, Smad3, Vimentin, Snail, Smad2/3, mTOR, phospho-mTOR (Ser2448), 70S6K, phospho-70S6K (Thr389), Akt, phospho-Akt (Ser473) (Cell Signaling Technology, Beverly, MA, USA), N-cadherin, E-cadherin, Fibronectin (BD Biosciences, Franklin Lakes, NJ), GAPDH (Bioworld Technology, Inc., MN), β-tubulin (Bioss, Beijing Biosynthesis Biotechnology, Inc., Beijing, China), α-SMA (Boster, Wuhan, China), TGF-β, and FADD (Abcam Inc., Cambridge, MA). Bound antibodies were then visualized with ECL plus western blotting detection reagents (GE Healthcare).
RNA extraction and quantitative real-time PCR
Cell was scratched and suspended in TRIzol (Invitrogen, Carlsbad, CA) for 5 min. The procedure for total RNA extraction followed the manufacturer’s instructions. cDNA was obtained using the PrimeScript RT reagent kit (Toyobo, Osaka, Japan). Quantitative real-time PCR (qRT-PCR) was performed on an ABI system (Applied Biosystems, Foster City. CA) using the primers listed in Supplementary Table S1. All data were normalized with those of GAPDH and presented as means of fold change of triplicate analyses.
Two-photon images
Mice were anesthetized with 1.5% pentobarbital sodium. Control mice and FADD-D mice were injected with FITC (Sigma Aldrich, St. Louis, MO) by tail vein. Mice were dissected and their kidneys were observed under a microscope; the samples were maintained in PBS to prevent them from drying. Alteration in capillaries was observed under a two-photon fluorescence microscope (Olympus I×71).
Protein extraction for proteomics analysis
Proteins were extracted from fresh kidneys after draining out the blood. Briefly, the hepatic portal vein was exposed by carefully moving the viscera to the right, outside of the abdominal cavity, and an 18-gauge angiocath was inserted into the hepatic portal vein. The perfusate tubing was connected to the needle and in situ infusion with pre-warmed (37 °C) D-hank’s solution (5 ml) with 1000 U heparin was initiated at a low flow rate (10 ml/min). When performed properly, the kidney immediately began to blanch. Once successful cannulation was confirmed, a cut was made at inferior vena cava (IVC) to allow efflux. Two kidney samples from each group were randomly selected for homogenizing in lysis buffer containing 1% protease inhibitor cocktail (Thermo Fisher Scientific, United States). Total proteins were extracted from cell lysis by ultrasonic. Supernatant was collected from suspension after centrifuging at 14,000 × g for 45 min at 4°C. Protein concentration was determined by the bicinchoninic acid (BCA) assay method. Protein (200 µg) was reduced with 100 mM dithiothreitol (DTT) at 100°C for 5 min, and then alkylated using 50 mM iodoacetamide (IAA) for 30 min in darkness. All samples were digested into fragment using trypsin (Promega, United States) at 37°C for 18 h and then reconstituted by 40 µl dissolution buffer. The iTRAQ reagent kit (AB SCIEX, United States) was next used to label the sample following the manufacturer’s protocol. Then labeled samples were injected into high-performance liquid chromatography (HPLC) system (Thermo DINOEX Ultimate 3000 BioRS) with a Durashell C18 (5 μm, 100 Å, 4.6 × 250 mm).
LC-MS/MS analysis
Data were collected by a Triple TOF 5600 System (AB SCIEX, Concord, ON). Samples were directly injected into a 20 μm PicoFrit emitter (New Objective) packed to 12 cm with Magic C18 AQ 3 μm 120 Å stationary phase, and then chromatographed using a 90 min gradient from 2% to 30% (mobile phase A 0.1% (v/v) formic acid, 5% (v/v) acetonitrile; mobile phase B 0.1% (v/v) formic acid, 95% (v/v) acetonitrile). MS1 spectra were performed in the range 350–1,500 m/z for 250 ms. The 20 most intense precursors with charge state 2–5 were chosen for fragmentation, and MS2 spectra were collected in the range 50–2,000 m/z for 100 ms; precursor ions were excluded from reselection for 15 s.
Bioinformatics analysis
Proteins, with the fold change more than 1.2 (≥1.2 or ≤0.83) and p value less than 0.05 based on Student’s t-test, between the groups, were regarded as differentially expressed. The proteome data set was further analyzed by MetaCoreTM version 5.4 (GeneGo, St. Joseph, MI), an integrated software suite for pathway analysis of experimental data. The methods employed have been described in previous literature [Citation15]. The networks are based on a proprietary manually curated database of protein-DNA, protein-compound, and protein–protein interactions, metabolic and signaling pathways, and the effects of bioactive molecules in gene expression, which can be visualized graphically as edges (the relationship between proteins) and nodes (proteins) with the empirical expression pattern. Differentially expressed proteins obtained were expressed as protein IDs and submitted to MetaCoreTM for analysis. For enrichment analysis, gene IDs of the uploaded files were matched with gene IDs from GeneGo ontologies in MetaCoreTM including GeneGo Pathway Maps.
ELISA assay
The levels of IgA, IgM, IgG, C3, and C1q in the kidney and serum were detected by ELISA assay kits (Beijing Winter Song Boye Biotechnology Co. Ltd., Beijing, China) according to the manufacturer’s instructions.
Statistical analysis
Data were presented as mean ± SEM. The difference between the two genotype groups was analyzed by a two-tailed Student’s t test using Prism software (GraphPad, San Diego, CA). Values were considered statistically significant at p < 0.05.
Results
Renal function of FADD-D mice
FADD-D mice used in this study were generated and confirmed as described previously in our published paper [Citation9]. After being observed externally, mice were then anatomized to weigh both kidneys. The results showed that the wet renal weight from FADD-D mice was slightly reduced as compared to that from control mice (); however, the relative weight increased significantly when adjusted for body weight (). A matched set of wild-type (WT) and FADD-D mice were next placed in metabolic cages to collect 24 h-urine volume, and it was observed that the urine volume of FADD-D mice was reduced significantly as compared with that of WT mice (). In addition, the levels of urine creatinine, blood urea nitrogen, uric acid in serum, and 24 h urinary protein were markedly elevated in FADD-D mice (). Giemsa staining of urine smears further displayed the number of blood cells under the microscope (). The expression of FADD was analyzed by immunofluorescence assay on kidney sections and the results showed that FADD was expressed in renal tubules and glomeruli of kidney tissue (Figure S1). Based on the index of measured renal function, we thus speculated that the renal glomerular filtration and reabsorption might be reduced in FADD-D mice, indicating abnormal renal function due to FADD phosphorylation.
Figure 1. Determination of the renal function in FADD-D and control mice. A, the humid weight of the kidney from FADD-D and control mice. B, the kidney/body weight ratio. C-G, the levels of 24-h urine volume (C), urine creatinine (D), urea nitrogen (E), urinary protein/24 h (F), and uric acid (G) of the serum in mice by using assay kits (n = 6, male mice aged 8 weeks). H, the number of blood cells were counted under microscopic by Giemsa staining of urine smears (n = 6, male mice aged 8 weeks). Data are presented as mean ± SEM of three independent experiments; *p <0.05, **p <0.01, ***p <0.001 compared with respective control.
Increased inflammation and enhanced macrophage infiltration in the kidney of FADD-D mice
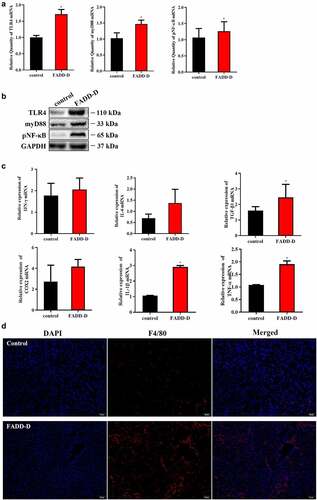
The disordered renal function of FADD-D mice may be caused by the stimulation of inflammation factors. Therefore, we next performed examinations on FADD-D mice in this context. The results indicated that the TLR4/NF-κB/myD88 signaling pathway was activated in FADD-D mice. Both mRNA levels and protein levels of TLR4, myD88, and NF-κB detected by qPCR and western blotting analyses were significantly upregulated in the kidney of FADD-D mice ( and Supplementary Fig. S2). In addition, the mRNA levels of some inflammatory cytokines, including TNF-α, IL-6, and TGF-β1, which are the downstream genes of transcription factor NF-κB, were all found to be elevated significantly in the kidney of FADD-D mice as detected by qPCR analysis (). Immunofluorescence experiment also displayed higher macrophage infiltration in the kidney of FADD-D mice as compared with the control mice ( and Figure S3). In addition, H&E staining showed that a small amount of inflammatory cells was observed in renal tissue, as shown in red arrows (). Glomerular fibrosis (black arrow) was also observed in glomerular tissue ().
Figure 2. Increased inflammation in the kidney of FADD-D mice. A, the mRNA expression levels of TLR4, myD88, and NF-κB. B, the protein expression level of TLR4/pNF-κB/myD88 signaling pathway. C, the mRNA expression levels of the inflammatory cytokines including IFN-γ, IL-6, TGF-β1, COX2, IL-1β and TNF-α measured by qPCR assay. D, the macrophage infiltration in the kidney (n = 6, male mice aged 8 weeks). Scale bar 50 μm. Data are presented as mean ± SEM, *p <0.05 compared with respective control.
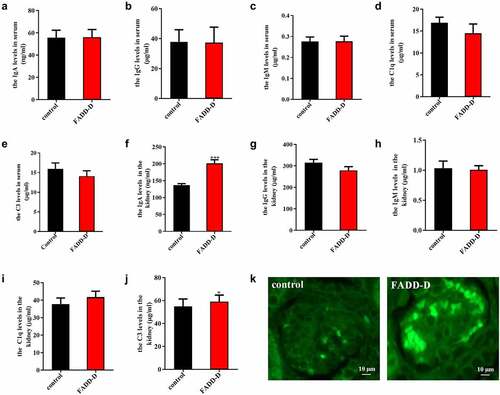
IgA nephropathy is characterized by recurrent gross or microscopic hematuria, proliferation of glomerular mesangial cell, and increased matrix. In our study, ELISA assay was used to measure the levels of IgA, IgG, IgM, C1q and C3 in both serum and kidney from the control and FADD-D mice. The results indicated that there was no significant change in serum levels of IgA, IgG, IgM, C1q and C3 (); however, significant changes were observed in the kidney tissue from FADD-D mice (). The levels of IgA and C3 were markedly upregulated in FADD-D mice as compared to the WT control ( F and J). The level of C1q was also increased slightly; however, the difference was not significant (). Furthermore, compared to the control group, significant IgA deposition was also observed in the kidney of FADD-D mice as detected by the immunofluorescence assay ( and Figure S4). IgA nephropathy is one of the most common primary glomerular diseases, where the mesangial areas of the kidney are predominantly deposited with IgA. In combination with hematuria and increased content of renal IgA by ELISA in FADD-D mice, we therefore speculated that renal fibrosis was probably induced by IgA nephritis in FADD-D mice.
Figure 3. FADD-D mice might spontaneously develop IgA nephritis. A-J, Detection of IgA, IgG, IgM, C1q and C3 in serum (A-E) and kidney (F-J) of the mice. K, the profile of IgA deposition in the kidney detected by immunofluorescence (n = 6, male mice aged 8 weeks). Scale bar 10 μm. Data are presented as mean ± SEM, *p < 0.05, ***p < 0.001 compared with respective control.
LC-MS/MS based proteomics analysis
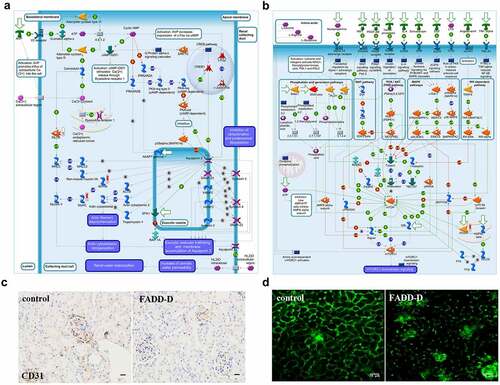
To further explore the specific role of FADD and its phosphorylation on renal function, we employed high throughput proteomics approach to compare protein expression levels between renal tissue from WT and FADD-D mice. Totally 3691 mouse proteins were specifically identified using proteomics analysis (Supplementary File 2). A t-test identified 446 differentially expressed proteins. 132 proteins were upregulated and 314 proteins were downregulated in the FADD-D group in comparison with the WT group. We then performed MetaCoreTM pathway enrichment analysis on proteomics data and obtained 50 enrichment pathways in the DEGs (Figure S5). Among them, the role of AVP in the regulation of aquaporin and renal water reabsorption (P = 7.83E–3) had strong positive-correlation with FADD phosphorylation ( and Figure S5). In addition, adiponectin in pathogenesis of type 2 diabetes (P = 1.66E–3), PPAR regulation of lipid metabolism (P = 1.66E–3) have also been clustered from DEGs results (Supplementary Fig. S6), which is consistent with our previous findings [Citation15,Citation29]. Furthermore, GeneGo Pathway Maps analysis revealed that mTOR signaling pathway was shown to have a high significance in the pathway maps in FADD-D kidneys (, Figure S7 and Supplementary Fig. S8). Moreover, GeneGo Diseases (by biomarkers) analysis revealed that the differentially expressed proteins induced by FADD phosphorylation were enriched in disease categories including kidney neoplasms and kidney diseases (Supplementary Fig. S9). The endothelial marker CD31(PECAM-1) is expressed by the endothelium of blood vessel. Immunohistochemical analysis showed that the expression of CD31 in FADD-D mice was lower than that in the control mice ( and Figure S10). Two-photon images further showed that capillaries surrounding kidney tissue were lost gradually in FADD-D mice as compared with the control mice ().
Figure 4. Proteomics analysis and Two-photon images. A-B, GeneGO pathway map showing changes in expression of proteins involved in the role of AVP in regulation of Aquaporin 2 and renal water reabsorption (A) and mTOR signaling pathway (B) upon FADD phosphorylation. The various proteins on this map are represented by different symbols (representing the functional class of the protein). Thermometers with blue or red shading next to symbols depict proteins identified in the present study: blue color represents proteins that were down-regulated in FADD-D renal tissue relative to control group; red color represents proteins that were up-regulated in FADD-D renal tissue relative to control group. C, Immunohistochemical analysis of CD31. Scale bar 50 μm. D, the state of glomerular capillaries after FITC injection under two-photon microscope (×400). Scale bar 75 μm.
The effect of FADD phosphorylation on renal fibrosis
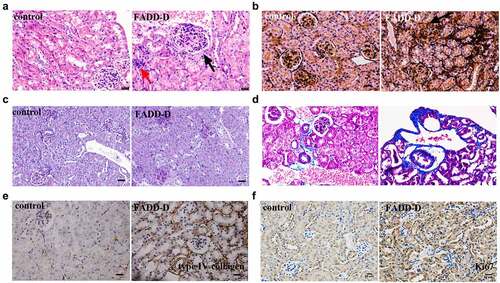
Renal fibrosis usually represents the final stage of most chronic kidney diseases, such as IgA nephropathy. Therefore, we used FADD-D mice to observe the kidney pathology by a variety of staining approaches. According to H&E staining, a small amount of inflammatory cells (red arrow) and glomerular fibrosis (black arrow) were observed in FADD-D renal tissue (). By PASM staining, we next found that half of glomerular endothelial cells appeared to be diffusing proliferative in FADD-D mice with apparent mesangial proliferation. Renal capsule got reduced, and even disappeared, in FADD-D mice (). Basement membrane was also observed to be thicker in FADD-D mice, as shown by PAS staining ( and Supplementary Fig. S11A). Masson staining further revealed obvious renal fibrosis and thickening of the basement membrane in FADD-D mice kidneys ( and Supplementary Fig. S11B). In order to further check the degree of fibrosis, immunohistochemical analysis of the kidney tissue was performed to assess the levels of type IV collagen and Ki67, which were also found to be elevated significantly in FADD-D mice ( and Figure S11C-D).
Figure 5. The effect of FADD phosphorylation on renal fibrosis in mice. A, H&E staining of mice kidney morphology. B, PASM staining. C, PAS staining. D, Masson staining. E-F, Immunohistochemical analysis of type IV collagen (E) and Ki67 (F). Scale bar 50 μm.
Increased expression of pro-fibrogenic factors and elevated EMT in the kidney of FADD-D mice
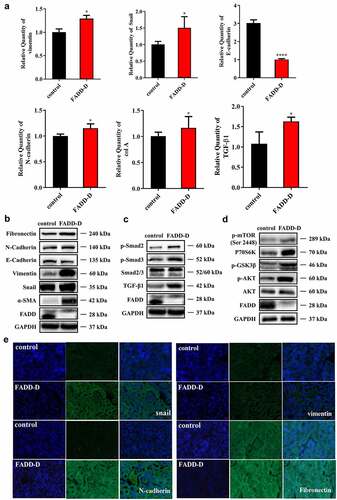
Several signaling cascades, including TGF-β and receptor tyrosine kinase, are known to contribute to the induction of EMT [Citation25]. To elucidate the potential mechanism by which FADD regulates renal fibrosis, qPCR and western blotting analyses were performed to examine the effects of FADD phosphorylation on the TGF-β/Smad signaling pathway. Firstly, qPCR assay showed that renal mRNA expression levels of TGF-β1, Vimentin, and col A were greater in FADD-D mice as compared to those in control mice, while the expression of E-cadherin was markedly downregulated (). However, renal mRNA expression levels of Snail and N-cadherin were not significantly different between FADD-D and control mice. Furthermore, western blotting revealed that the expression levels of mesenchymal markers, such as Fibronectin, Vimentin, and α-SMA were all significantly upregulated, while that of the epithelial marker, E-cadherin, was drastically declined in FADD-D mice as compared to the control mice ( and Figure S12), indicating that EMT process and renal fibrosis were obviously induced in FADD-D mice. The expression level of TGF-β1 and the phosphorylation level of Smad2/3 were also elevated in FADD-D mice ( and Figure S13). PI3K/Akt/mTOR signaling pathway is one of the major pathway axis regulating fibrosis. Our proteomics data also suggested that the mTOR pathway might be activated due to FADD phosphorylation ( and Figure S7). Therefore, we next examined this pathway and found that the protein level of P70S6K and the phosphorylation levels of mTOR, GSK3β, and AKT were all significantly increased in FADD-D mice ( and Figure S14). Furthermore, the immunofluorescence staining revealed that the expression levels of myofibroblast markers, such as Snail, N-cadherin, Vimentin, and Fibronectin were all significantly upregulated as compared to the control mice (). These results suggested that FADD phosphorylation might trigger EMT induction via the AKT-regulated and GSK3β signaling cascades.
Figure 6. FADD phosphorylation accelerated EMT process by activating mTOR and TGF-β/Smad pathway. A, the mRNA levels of Vimentin, Snail, E-cadherin, N-cadherin, col a and TGF-β1. B, the protein expression levels of EMT markers (Fibronectin, N-cadherin, E-cadherin, Vimentin, Snail and ɑ-SMA). C, the expression levels of proteins (p-Smad2, p-Smad3, Smad2/3 and TGF-β1) involved in TGF-β/Smad signaling pathway. (Notice: The experiment in Fig. 6B was performed in the same experiment with Fig. 6C.) D, the expression levels of proteins (p-mTOR, P70S6K, p-GSK3β, p-AKT and AKT) involved in mTOR signaling pathway. E, the positive expression of Snail, N-cadherin, Vimentin, and Fibronectin were shown by immunofluorescence experiments. Scale bar 20 μm. Data are presented as mean ± SEM, *p <0.05 compared with respective control.
FADD knockdown or deficiency accelerates EMT in HEK293 and MES cells
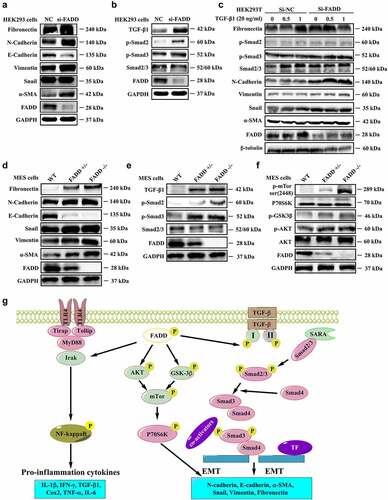
Our previous studies indicated that FADD deficiency usually exhibits similar effects or phenotypes as FADD-D mutation [Citation29]. Thus, we subsequently examined the effects of FADD deficiency or knockdown on EMT and renal fibrosis. The results showed that, by interfering with the expression of FADD in HEK293 cells, the TGF-β1 pathway was activated and the process of EMT was accelerated, as evidenced by an increase in expression levels of Fibronectin, N-cadherin, Vimentin, α-SMA, TGF-β1, and p-Smad2/3, and decreased expression of E-cadherin ( and Figure S15-S16). Furthermore, this effect was enhanced in TGF-β1-treated HEK293 cells; transfection of FADD siRNA significantly enhanced the protein levels of Fibronectin, Vimentin, α-SMA, and Snail, and reduced E-cadherin level as compared with the control group ( and Figure S17). Similar effects were also observed in FADD-deficient MES cells, as reflected by and Figure S18-S19, in which the expression levels of Fibronectin, Vimentin, α-SMA, Snail, TGF-β, and p-Smad2/3 were upregulated, while the level of E-cadherin was downregulated. In addition, the expression of P70S6K and phosphorylation levels of mTOR, GSK3β, and AKT were also significantly increased in FADD-deficient MES cells ( and Figure S20), suggesting that the mTOR and TGF-β/Smad signaling pathway was activated in response to FADD deletion. Additionally, to better illustrate the role of FADD in the development of renal fibrosis, we further performed the western blotting analysis on the human proximal tubule epithelial cell line (HK2). We found that knockdown of FADD or overexpression of FADD-D significantly activated the TGF-β1 pathway and accelerated the process of EMT. As shown in Figure S21A, the expression levels of Fibronectin, N-cadherin, Vimentin, α-SMA, TGF-β, and p-Smad2/3 were upregulated accompanied by downregulation of E-Cadherin expression levels in FADD knockdown HK2 cells. Moreover, the same phenomenon was also observed in HK2 cells after transfection of pcDNA3.1-FADD-D (Figure S21B). Furthermore, the results showed that, by interfering with the expression of FADD in HEK293 cells, the morphological changes of HEK293 cells were observed (Figure S22A). The similar results were also found in FADD-deficient MES cells (Figure S22B). Therefore, we conclude that FADD knockdown or deficiency exhibits similar effects as FADD phosphorylation, promoting TGF-β1-induced EMT and renal fibrosis.
Figure 7. FADD knockdown or deficiency accelerated EMT process. A-B, After interfering with the expression of FADD in HEK293 cells, the expression level of EMT markers (A) and the expression level of proteins involved in TGF-β/Smad signaling pathway (B). (Notice: The experiment in Fig. 7A was performed in the same experiment with Fig. 7B.) C, After TGF-β1 stimulation (20 ng/ml), the activation degree of TGF-β pathway was investigated in HEK293 cells transfected with FADD siRNA. D-F, the expression level of EMT markers (D), proteins involved in TGF-β/Smad signaling pathway (E), and mTOR pathway (F) were also investigated by WB analysis using indicated antibodies in FADD-deficient MES cells. (Notice: The experiment in Fig. 7D was performed in the same experiment with Fig. 7E.) G, Schematic illustration of the potential mechanisms by which FADD phosphorylation promotes the development of renal fibrosis.
Discussion
FADD is recognized as an important adaptor in the death receptor-induced apoptotic signaling pathway. Recently, FADD was revealed to be a multifunctional protein that also participates in several non-apoptotic pathways, which are assumed to be regulated by its phosphorylation [Citation19–21,Citation30]. Interestingly, in the current research, we discovered an extraordinary function of FADD in renal fibrosis, which might be also under the regulation of its phosphorylation. We provided the first evidence that FADD phosphorylation or deficiency effectively promoted TGF-β1-mediated EMT and renal fibrosis in mice in vitro and in vivo, suggesting that multi-target therapy using different inhibitors of FADD phosphorylation could be a potential therapeutic strategy for renal fibrosis.
Previous research by Patrick-Simon Welz and his colleagues [Citation4] has uncovered a novel role of FADD in protecting epithelial cells from RIP3-dependent necrosis and preventing intestinal inflammation in vivo. In rheumatoid arthritis (RA) patients, TLR4 ligands, such as extra domain A fibronectin, heat shock protein 60 (HSP60), and hyaluronic acid, are expressed in the joints [Citation31]. The interaction of Fas-FasL between macrophages with both molecules frequently occurs in the synovial tissue, triggering chronic inflammation by sequestering FADD from MyD88 [Citation32]. In addition, FADD has been reported to play dual roles in the NF-κB pathway. The function of FADD has been discussed as a NF-κB activator [Citation32]; however, FADD could also serve as a NF-κB signaling inhibitor [Citation33]. Actually, the role of FADD to either trigger or suppress NF-κB activation depends on the stimulated upstream receptor, or possibly on other factors like cell types. In our study, the TLR4/myD88/NF-κB, mTOR, and TGF-β/Smad signaling pathway were activated by FADD phosphorylation. And renal fibrosis is a developmental process in which FADD phosphorylation may be involved. FADD phosphorylation might lead to IgA nephritis and eventually result in renal fibrosis, which has an effect on kidney function.
Our previous studies have shown that FADD-D mice displayed a reduction in islet area, and the glucose-stimulated insulin secretion (GSIS) of FADD-D mice was also impaired [Citation14]. It has also shown that glycolysis, gluconeogenesis, and glycogen synthesis were dysregulated due to FADD phosphorylation, both in MEFs and liver tissue from FADD-D mice [Citation15]. Abnormal glucose metabolism in the kidney was also observed in this study using proteomics analysis. It has been reported that abnormal glucose metabolism can cause kidney damage [Citation34]. Therefore, the abnormal glucose metabolism might also be a possible cause of kidney disease in FADD-D mice.
In the present study, mice with FADD-D mutation spontaneously developed severe renal fibrosis. Although the mechanisms inducing renal fibrosis in FADD-D mice remain unclear at present, it is tempting to speculate that pathways linked to both nephritis and fibrosis might be implicated in triggering macrophage infiltration, damage of epithelial cells, glomerular capillary loss, renal pathology, and renal epithelial-mesenchymal transformation in these mice. Accumulating evidence has demonstrated that EMT in renal tubular epithelial cells plays a key role in accumulating renal matrix protein and is a critical event in triggering organ fibrosis, such as renal fibrosis. Extensive research has concluded that TGF-β1, one of the most prominent inducers of EMT process, triggers the process of EMT, and finally, promotes the development of renal fibrosis [Citation35]. Our study revealed that the protein levels of mesenchymal marker, α-SMA, and myofibroblast marker, Fibronectin, were significantly upregulated, while that of epithelial marker, E-cadherin, were markedly decreased in TGF-β1-stimulated HEK293 cells transfected with FADD siRNA or FADD-deficient MES cells, and the renal cortex of FADD-D mice. In addition, the similar phenomenon was also observed in HK2, the human renal tubular epithelial cells. After transfected with FADD siRNA or FADD-D plasmid, the expression levels of α-SMA and TGF-β1 were significantly upregulated accompanied by down-regulation of E-Cadherin expression levels. These results indicated that knockdown or overexpression FADD-D significantly activated the TGF-β1 pathway and accelerated the process of EMT. Furthermore, Masson staining also revealed apparent renal fibrosis in FADD-D mouse renal cortex. These data indicated that EMT and renal fibrosis were induced in FADD-D mice and TGF-β1-stimulated MES cells with FADD deficiency.
Our findings demonstrated, for the first time, that FADD, particularly its phosphorylated form, has an impact on renal fibrosis, exhibiting another non-apoptotic function similar to what has been mentioned in previous reports. We provided the first evidence that FADD-D mutation might affect the level of proteins related to nephritis and renal fibrosis, and the underlying mechanism might be related to changes in TGF-β1 pathway, TLR4/myD88/NF-κB pathway, and mTOR pathway (), providing feasible therapeutic strategies for preventing renal fibrosis. These data suggested that developing small molecular inhibitors of FADD phosphorylation may help prevent renal fibrosis. At the same time, we also need to remind that the current paper still has some shortcomings. Adult mice were selected to study inflammation and fibrosis without considering the growth stage, since we need to rule out the effects of FADD-D mutation on mice development. In addition, the data obtained in this study might not fully assess the animal model of IgA nephropathy. More work will be needed in our future research.
In conclusion, our study provides evidence that FADD, particularly its phosphorylated form, affects renal function and fibrosis. With investigations on the renal function in FADD-D mice, we have expanded the non-apoptotic functions of FADD and its phosphorylated form, providing a further understanding and insight into renal fibrosis.
Author contributions
Z.C.H., H.Z. and X.Y. conceived study design and experiments; Y.L. and H.Z. wrote the manuscript. Y.L. and F.C. performed the most experiments in this study and prepared the figures. C.Y. and Y.Y. performed the experiments with the animals. X.W. and Y.R. helped with WB analysis.
Supplemental Material
Download Zip (5.2 MB)Disclosure statement
No potential conflict of interest was reported by the author(s).
Data availability statement
All data generated or analyzed during this study are included in this article.
Supplemental material
Supplemental data for this article can be accessed online at https://doi.org/10.1080/15384101.2022.2136463
Additional information
Funding
Related Research Data
References
- Chinnaiyan AM, O’Rourke K, Tewari M, et al. FADD, a novel death domain-containing protein, interacts with the death domain of fas and initiates apoptosis. Cell. 1995;81:505–512.
- Zhang J, Winoto A. A mouse fas-associated protein with homology to the human mort1/FADD protein is essential for fas-induced apoptosis. Mol Cell Biol. 1996;16:2756–2763.
- Lee EW, Seo J, Jeong M, et al. The roles of FADD in extrinsic apoptosis and necroptosis. BMB Rep. 2012;45:496–508.
- Welz PS, Wullaert A, Vlantis K, et al. FADD prevents RIP3-mediated epithelial cell necrosis and chronic intestinal inflammation. Nature. 2011;477:330–334. DOI:10.1038/nature10273.
- Bonnet MC, Preukschat D, Welz PS, et al. The adaptor protein FADD protects epidermal keratinocytes from necroptosis in vivo and prevents skin inflammation. Immunity. 2011;35:572–582. DOI:10.1016/j.immuni.2011.08.014.
- Pyo JO, Jang MH, Kwon YK, et al. Essential roles of Atg5 and FADD in autophagic cell death: dissection of autophagic cell death into vacuole formation and cell death. J Biol Chem. 2005;280:20722–20729. DOI:10.1074/jbc.M413934200.
- He L, Ren Y, Zheng Q, et al. Fas-associated protein with death domain (FADD) regulates autophagy through promoting the expression of ras homolog enriched in brain (Rheb) in human breast adenocarcinoma cells. Oncotarget. 2016;7:24572–24584. DOI:10.18632/oncotarget.8249.
- Kabra NH, Kang C, Hsing LC, et al. T cell-specific FADD-deficient mice: fADD is required for early T cell development. Proc Natl Acad Sci U S A. 2001;98:6307–6312.
- Hua ZC, Sohn SJ, Kang C, et al. A function of fas-associated death domain protein in cell cycle progression localized to a single amino acid at its C-terminal region. Immunity. 2003;18:513–521.
- Matsuyoshi S, Shimada K, Nakamura M, et al. FADD phosphorylation is critical for cell cycle regulation in breast cancer cells. Br J Cancer. 2006;94:532–539.
- Imtiyaz HZ, Zhou X, Zhuang H, et al. The death domain of FADD is essential for embryogenesis, lymphocyte development, and proliferation. J Biol Chem. 2009;284:9917–9926. DOI:10.1074/jbc.M900249200.
- Thomas LR, Henson A, Reed JC, et al. Direct binding of fas-associated death domain (FADD) to the tumor necrosis factor-related apoptosis-inducing ligand receptor DR5 is regulated by the death effector domain of FADD. J Biol Chem. 2004;279:32780–32785.
- Shimada K, Nakamura M, Ishida E, et al. Molecular roles of MAP kinases and FADD phosphorylation in prostate cancer. Histol Histopathol. 2006;21:415–422.
- Yao C, Zhuang H, Cheng W, et al. FADD phosphorylation impaired islet morphology and function. J Cell Physiol. 2015;230:1448–1456. DOI:10.1002/jcp.24885.
- Yao C, Zhuang H, Du P, et al. Role of fas-associated death domain-containing protein (FADD) phosphorylation in regulating glucose homeostasis: from proteomic discovery to physiological validation. Mol Cell Proteomics. 2013;12:2689–2700. DOI:10.1074/mcp.M113.029306.
- Balachandran S, Thomas E, Barber GN. A FADD-dependent innate immune mechanism in mammalian cells. Nature. 2004;432:401–405.
- Balachandran S, Venkataraman T, Fisher PB, et al. Fas-associated death domain-containing protein-mediated antiviral innate immune signaling involves the regulation of Irf7. J Immunol. 2007;178:2429–2439.
- Tourneur L, Chiocchia G. FADD: a regulator of life and death. Trends Immunol. 2010;31:260–269.
- Drakos E, Leventaki V, Atsaves V, et al. Expression of serine 194-phosphorylated fas-associated death domain protein correlates with proliferation in B-cell non-Hodgkin lymphomas. Hum Pathol. 2011;42:1117–1124. DOI:10.1016/j.humpath.2010.11.002.
- Alappat EC, Feig C, Boyerinas B, et al. Phosphorylation of FADD at serine 194 by CKIalpha regulates its nonapoptotic activities. Mol Cell. 2005;19:321–332. DOI:10.1016/j.molcel.2005.06.024.
- Ramos-Miguel A, Garcia-Fuster MJ, Callado LF, et al. Phosphorylation of FADD (Fas-associated death domain protein) at serine 194 is increased in the prefrontal cortex of opiate abusers: relation to mitogen activated protein kinase, phosphoprotein enriched in astrocytes of 15 kDa, and Akt signaling pathways involved in neuroplasticity. Neuroscience. 2009;161:23–38. DOI:10.1016/j.neuroscience.2009.03.028.
- Schock SN, Young JA, He TH, et al. Deletion of FADD in macrophages and granulocytes results in RIP3- and MyD88-dependent systemic inflammation. PLoS One. 2015;10:e0124391.
- Grgic I, Campanholle G, Bijol V, et al. Targeted proximal tubule injury triggers interstitial fibrosis and glomerulosclerosis. Kidney Int. 2012;82:172–183. DOI:10.1038/ki.2012.20.
- Thiery JP, Acloque H, Huang RY, et al. Epithelial-mesenchymal transitions in development and disease. Cell. 2009;139:871–890.
- Cannito S, Novo E, di Bonzo LV, et al. Epithelial-mesenchymal transition: from molecular mechanisms, redox regulation to implications in human health and disease. Antioxid Redox Signal. 2010;12:1383–1430. DOI:10.1089/ars.2009.2737.
- Huen SC, Cantley LG. Macrophages in renal injury and repair. Annu Rev Physiol. 2017;79:449–469.
- Ferenbach D, Kluth DC, Hughes J. Inflammatory cells in renal injury and repair. Seminars in nephrology. Semin Nephrol. 2007;27:250–259.
- Damian M, Porteus MH. A crisper look at genome editing: rNA-guided genome modification. Mol Ther. 2013;21:720–722.
- Zhuang H, Wang X, Zha D, et al. FADD is a key regulator of lipid metabolism. EMBO Mol Med. 2016;8:895–918. DOI:10.15252/emmm.201505924.
- Scaffidi C, Volkland J, Blomberg I, et al. Phosphorylation of FADD/MORT1 at serine 194 and association with a 70-kDa cell cycle-regulated protein kinase. J Immunol. 2000;164:1236–1242. DOI:10.4049/jimmunol.164.3.1236.
- Ma Y, Liu H, Tu-Rapp H, et al. Fas ligation on macrophages enhances IL-1R1-toll-like receptor 4 signaling and promotes chronic inflammation. Nat Immunol. 2004;5:380–387. DOI:10.1038/ni1054.
- Bannerman DD, Tupper JC, Kelly JD, et al. The fas-associated death domain protein suppresses activation of NF-kappa B by LPS and IL-1 beta. J Clin Invest. 2002;109:419–425.
- Ranjan K, Pathak C. FADD regulates NF-kappaB activation and promotes ubiquitination of cFLIPL to induce apoptosis. Sci Rep. 2016;6:22787.
- Eid S, Maalouf R, Jaffa AA, et al. 20-HETE and EETs in diabetic nephropathy: a novel mechanistic pathway. PLoS One. 2013;8:e70029. DOI:10.1371/journal.pone.0070029.
- Nieto MA. Epithelial-mesenchymal transitions in development and disease: old views and new perspectives. Int J Dev Biol. 2009;53:1541–1547.