
ABSTRACT
This study is designed to explore the role of long non-coding RNAs (lncRNAs) NCK1-AS1 in proliferative and invasive activities of esophageal squamous cell carcinoma (ESCC) cells by binding to microRNA-133b (miR-133b) to regulate ENPEP. Differentially expressed lncRNAs, miRs, genes and their targeting relationships were screened on ESCC-related gene expression datasets GSE17351 and GSE6188. The targeting relationships among NCK1-AS1, miR-133b, and ENPEP were verified using functional assays. Loss- and gain- of function assays were carried out to examine the roles of NCK1-AS1, miR-133b, and ENPEP in ESCC cell proliferative, invasive, migrative and apoptotic abilities as well as tumorigenesis in vivo. Elevated NCK1-AS1 and ENPEP but reduced miR-133b expression were found in ESCC. NCK1-AS1 knockdown or miR-133b overexpression inhibited the malignant properties of ESCC cells as well as tumorigenesis in vivo. NCK1-AS1 regulated the ENPEP expression by competitively binding to miR-133b. ENPEP overexpression reversed inhibition of NCK1-AS1 knockdown on the function of ESCC cells. This study provides evidence that silencing NCK1-AS1 inhibits expression of ENPEP by sponging miR-133b, thereby suppressing ESCC.
Introduction
Esophageal squamous cell carcinoma (ESCC), a histological subtype of esophageal cancer, is a widespread disease in Asia [Citation1]. Every year, about 90% of the 456,000 esophageal cancers worldwide is diagnosed as ESCC, with men (69%) being more susceptible than women (31%) [Citation2]. In addition, about 80% of ESCC cases occurs in developing countries, with dismal long-term survival [Citation3]. ESCC is commonly diagnosed in individuals over than 40 years of age with mostly advanced metastatic disease [Citation4]. Therefore, the identification of new molecular targets for monitoring ESCC progression and for the development of improved treatments is necessary for obtaining better survival rate.
Long noncoding RNAs (lncRNAs) are non-protein-coding RNA molecules ≥200 nucleotides and their dysfunction in various cancers implies a potential as tumor suppressor RNAs [Citation5]. A number of lncRNAs act as tumor or oncogenes suppressors in ESCC, including HOTAIR, CCAT1, MALAT1, HNF1A-AS1 and AFAP1-AS1 [Citation6]. Based on the bioinformatic analysis in the current study, NCK1-AS expression was the most differentially expressed in the GSE17351 dataset. Elevation of NCK1-AS occurs in nasopharyngeal carcinoma, and gastric cancer and exerts tumor-promoting effects on cancer cells [Citation7,Citation8]. MicroRNAs (miRNAs), small non-coding RNAs of about 22 nucleotides length which are produced by 2 RNase III proteins, act as guide molecules in RNA knock-out, and their dysregulation occurs in various human diseases, particularly in cancers [Citation9]. The lncRNAs function as competing endogenous RNAs (ceRNA) by adsorbing miRNA to regulate target mRNA expression [Citation10,Citation11]. The miR-133b has been considered as a tumor suppressor in many human cancers by regulating epidermal growth factor receptor (EGFR), and overexpression of miR-133b could suppress proliferation, migration and invasion of ESCC cells by inhibiting MAPK/ERK and PI3K/AKT signaling pathways through targeting EGFR [Citation12–15]. ENPEP has been proved as a potential predictor of immune checkpoint inhibitor efficacy [Citation16]. ENPEP was overexpressed in breast cancer, leukemia and other malignancies [Citation17].
Moreover, NCK1-AS1 has been reported to exert function on tumor progression by competitively binding to miRNA in glioma and gastric cancer [Citation8,Citation18,Citation19]. In addition, abnormal expression of miRNAs occurs in ESCC, including 27 over-expressed and 16 poorly expressed miRNAs [Citation20]. Furthermore, miRNAs are potential targets of lncRNAs owing to their similarity in structure [Citation6]. As stated by Feliciano et al., the enzyme glutamyl aminopeptidase (ENPEP) was overexpressed and directly targeted by miR-125b in breast cancer, such that ENPEP knockdown significantly reduced breast tumor cell proliferation [Citation17] However, the influence of NCK1-AS1 and miR-133b/ENPEP axis in ESCC remains undocumented. Therefore, the objective of the present study is to elucidate whether downregulated NCK1-AS1 inhibits cell invasive ability in ESCC in regulation of miR-133b/ENPEP axis.
Materials and methods
Bioinformatics screening
ESCC gene expression datasets GSE17351 and GSE6188 were obtained from the Gene Expression Omnibus (GEO) database (https://www.ncbi.nlm.nih.gov/geo/). The dataset GSE17351 contained the gene expression data of 5 pairs of ESCC tumor tissues and normal tissues. We used the gene annotation platform GPL570 [HG-U133_Plus_2] Affymetrix Human Genome U133 Plus 2.0 Array to identify differentially expressed genes. The gene expression dataset GSE6188 contained miRNA expression data from 153 ESCC tumor tissues and 104 normal tissues, which was analyzed using the gene expression dataset annotation platform GPL4508 Tsinghua University mammalian 2k microRNA microarray. R language affy package (http://www.bioconductor.org/packages/release/bioc/html/affy.html) was used for background correction and normalized pretreatment of gene expression data, and Limma package (http://master.bioconductor.org/packages/release/bioc/html/limma.html), for differential gene/miRNA screening. The corrected p value was adj.P.Val, wherein the genes with |log2FC| > 1.5 and adj.P.Val <0.05 were identified as differentially expressed. The differential gene/miRNA expression heat map was plotted with the pheatmap package. Differential analysis on GSE17351 was performed to screen out the differential expression of NCK1-AS1 in ESCC. The LncATLAS database (https://lncatlas.crg.eu) was used for subcellular localization of long-chain non-coding RNA [Citation21], and the RNA22 database (https://cm.jefferson.edu/rna22/) was used to predict miRNA binding sites with target genes. The possible binding miRNA of NCK1-AS1 was predicted by DIANA-LncBase databse (http://carolina.imis.athena-innovation.gr/diana_tools/web/index.php?r=lncbasev2/index-predicted), and miRNA was screened by combining with the differential miRNA results. In addition, RNA22, mirDIP (http://ophid.utoronto.ca/mirDIP/), DIANA (http://diana.imis.athena-innovation.gr/DianaTools/index.php?r=microT_CDS/index), and miRWalk (http://mirwalk.umm.uni-heidelberg.de/) were applied to predict genes that might be modulated by differential miRNA. GEPIA (http://mirwalk.umm.uni-heidelberg.de/), a database for cancer-related gene expression analysis and interactive analysis [Citation22] was used to verify differential lncRNA and gene expression. Venn on-line analysis software (http://bioinformatics.psb.ugent.be/webtools/Venn/) was adopted compare and analyze on the data of different sets and Venn diagram was plotted.
Cell treatment
Both human esophageal epithelial cell line (HET-1A; BNCC337613) and human ESCC cell lines EC109 (BNCC342591), and EC9706 (BNCC339892) were obtained from BeNa Culture Collection (Beijing, China). ESCC cell lines. TE-10 (CL-0453) and KYSE-150 (CL-0638) were supplied by Procell Life Science & Technology Co., Ltd. (Wuhan, China). Cell cultures were developed in 90% DMEM-H or RPMI 1640 medium (Invitrogen, Carlsbad, USA) containing 10% fetal bovine serum (FBS; Gibco, Grand Island, USA), 100 U/mL penicillin, and 100 μg/mL streptomycin (Hyclone, Logan, Utah). Culture medium was renewed every 24 h-48 h. Cells were trypsinized, subcultured, and selected for subsequent experiment.
Cells at the 3rd passage were trypsinized and seeded into 24-well plates. Monolayer cells were transfected with siRNA (si)-negative control (NC), si-NCK1-AS1, mimic NC, miR-133b mimic, inhibitor NC, miR-133b inhibitor, pcDNA (pcDNA3.1 empty vector), and ENPEP (ENPEP overexpression vector on pcDNA3.1) (Supplementary Table S1). The above genes were obtained from GenePharma (Shanghai, China). Cells were seeded into a six-well plate 24 h before transfection. Upon 50% cell confluence, cells were transfected into human ESCC cell line by lipofectamine 2000 (Invitrogen) for 6 h and then the medium was renewed. Cells were collected after 48 h culture.
qRT-PCR
Total RNA was extracted from cells by RNA extraction kit (Invitrogen), and RNA was reversely transcribed into cDNA using Primescript RT kit. For miR detection, the cDNA was obtained by reverse transcription using the miRNA First Strand cDNA Synthesis (Tailing Reaction) kit. Fluorescent quantitative PCR was performed following instructions in the SYBR® Premix Ex TaqTM II kit. Fluorescence quantitative PCR was conducted in an ABI PRISM® 7300 system with U6 as internal reference for miR-133b, and glyceraldehyde-3-phosphate dehydrogenase (GAPDH) for NCK1-AS1 and ENPEP. Primers were designed and synthesized by Takara (Dalian, China) (Supplementary Table S2). The relative quantitative method and 2−ΔΔCt method [Citation23]. mRNA expression in ESCC cell lines was determined by the above-mentioned method.
Immunoblotting
ESCC cells were centrifuged and supernatant was discarded. Subsequently, cells were incubated with 100 μL lysis buffer and 1 μL phosphatase inhibitor (Roche, Basel, Switzerland) for 30 min. Samples were transferred onto a PVDF membrane after 10% SDS-PAGE gel electrophoresis and blocked for 1 h with 5% skim milk powder. The membrane was probed with the primary antibody, rabbit anti-ENPEP (1: 500 ab170772, Abcam, Cambridge, UK), and then re-probed with secondary antibody, horseradish peroxidase-labeled goat anti-rabbit antibody to IgG (1:5000, Boster, Wuhan, Hubei, China) for 1 h, and developed by the ECL kit (10001, Keyu Shenlan, Beijing, China). Gel imaging analysis system (GelDoc XR, Bio-Rad Laboratories, Shanghai, China) was applied for gray values analysis. Relative content of the sample protein = average gray value of the sample/average gray value of corresponding internal reference.
Dual luciferase reporter gene assay
The pmirGLO Dual-Luciferase miRNA Target Expression Vector (Promega) was adopted to construct the wild-type (WT) pmirGLO-NCK1-AS1 and mutated (MUT) pmirGLO-NCK1-AS1, which were synthesized and cloned into the pMIR-GLO TM luciferase vector (Promega). The target fragment was inserted into the pMIR-reporter plasmid by restriction enzymes digestion and T4 DNA ligase. Then the correctly sequenced luciferase reporter plasmids WT and MUT were co-transfected with miR-133b mimic or NC mimic into cells. Following 48-h culture, luciferase activities were determined using the Dual Luciferase Detection kit (D0010, Solarbio, Beijing, China). A Glomax 20/20 luminometer fluorescence detector (Promega) was adopted to detect fluorescence intensity.
Fluorescence in situ hybridization (FISH)
FISH was conducted to identify subcellular localization of NCK1-AS1 using RiboTM lncRNA FISH Probe Mix (Red) kit (RiboBio, Guangdong, China). Upon 80% cell confluence, cells were fixed with 1 mL of 4% paraformaldehyde at ambient temperature, and permeabilized with 0.2% Triton-X-100 for 20 min. Following treatment with proteinase K (2 μg/mL), glycine, and acetylating agent, cells were incubated with 250 μL pre-hybridization solution at 42°C for 1 h. The pre-hybridization solution was aspirated, and then 250 μL of hybridization solution containing probe (300 ng/mL) was added, followed by hybridization overnight at 42°C. PBST-diluted 6-diamidino-2-phenylindole (DAPI) was added to a 24-well culture plate to stain nuclei (5 min). Finally, cover glasses were mounted with an anti-fluorescence quencher, five randomly selected fields were selected and observed under a fluorescence microscope (Olympus, Tokyo, Japan).
RNA binding protein immunoprecipitation (RIP) assay
Lysis buffer (25 mM Tris-HCl pH7.4, 150 mM NaCl, 0.5% NP-40, 2 mM ethylenediaminetetraacetic acid [EDTA], 1 mM NaF, and 0.5 mM disulfide) containing a mixture of RNasin (R8060T; Solarbio) and a protease inhibitor was adopted for cell lysis. The lysate was centrifuged (12,000 g for 20 min), and the supernatant was taken. Then, anti-Ago-2 magnetic beads were added, and anti-IgG magnetic beads were added as control. Following 4-h incubation at 4°C, the beads were washed with washing buffer (three times; 50 mM Tris-HCl, 300 mM NaCl pH 7.4, 1 mM MgCl 2, 0.1% NP-40).
RNA pull-down assay
NCK1-AS1-WT, NCK1-AS1-MUT, or NCK1-AS1-NC were synthesized by Sangon Biotech (Shanghai, China), and biotin-labeled RNA was synthesized using the T7 Megascript Kit (Thermo Fisher Scientific, San Jose, CA, USA). RNA was treated with RNase-free DNase I and purified with RNeasy Mini Kit (Qiagen, Valencia, CA). Cell lysates were incubated with purified biotinylated transcripts. Then, complexes were separated using streptavidin agarose beads (Sigma, St Louis, MO, USA). Finally, purified RNA was subjected to qRT-PCR.
Cell counting kit-8 (CCK-8) assay
Cell viability was assessed by CCK-8 (Beyotime, Jiangsu, China). In short, ESCC cells were seeded into 96-well plates (2000 cells/well) and cultured for 48 h, incubated with 10 μL CCK-8 solution (37°C; 2 h). Optical density (OD) at 450 nm was determined by microplate reader (Elx800; BioTek Inc, North Brunswick, NJ, USA). The OD correlated positively with cell viability.
Transwell assay
ESCC cells were digested and re-suspended with 150 μL serum-free RPMI-1640 medium. Cells (1 × 10⁴ cells/well) were added to the up-compartment coated with diluted matrigel gel (1 : 5; BD Biosciences, Sparks, MD, USA), and 600 μL RPMI-1640 medium containing 10% FBS was added to the sub-compartment and cultured at 37°C for 24 h. Cells were then fixed with 4% paraformaldehyde for 15 min and stained with 0.3% crystalline violet for 15 min. The unpenetrated cells were removed with a cotton swab, and cells were photographed in ten randomly selected fields of view with a light microscope (Nikon, Tokyo, Japan).
Scratch test
Cells (2.5 × 10⁴ cells/cm2) were seeded into six-well plates for 24 h. Medium was aspirated, and a wound was scratched using a 10 µL pipette tip, whereupon medium containing 5% FBS was added for further culture. The wounds were photographed at 0 and 24 h, and their width analyzed using ImageJ software to assess cell migration, where the wound-healing rate = (0 h width of scratch −24 h width of scratch)/0 h width of scratch × 100%.
Flow cytometry
Following 48-h transfection, cells were trypsinized in the absence of EDTA. Supernatant was discarded following centrifugation. Apoptosis was detected using the FITC/PI apoptosis detection kit (CA1020, Solarbio). Cells were washed using binding buffer, suspended and mixed. Following incubation, cells were added with the mixture of Annexin-V-FITC and Binding buffer (1 : 40).
In vivo animal experiments
Twenty-four SPF grade BALB/c male nude mice (age: 6 weeks old; weight: 15–18 g; Shanghai SLAC Laboratory Animal Co., Ltd., Shanghai, China) were assigned to the sh-NC and sh-NCK1-AS1 groups (n = 12 mice/group). EC109 cell lines stably transfected with sh-NC and sh-NCK1-AS1 were selected, and a stable EC109 cell suspension (2 × 10⁶ cells/mL) was injected subcutaneously to establish a subcutaneous xenograft model. After the inoculation, the tumor growth was observed and recorded. On the 30th day of injection, nude mice were euthanized by anesthesia overdose and tumors excised, weighed and photographed. All animal protocols were reviewed and granted by the animal ethics committee in accordance with standard of the Guide for the Care and Use of Laboratory animals published by the National Institutes of Health.
Statistical analysis
All experimental data, summarized by mean ± standard deviation, were processed using SPSS 18.0 statistical software, with p < 0.05 as statistical significance. The normal distribution of pairwise comparison was tested by independent sample t-test, while the comparison of which among multiple groups was assessed by one-way analysis of variance (ANOVA), with Tukey’s post hoc testing. The data at different time points among multiple groups were compared using repeated measures ANOVA, followed by Bonferroni’s post hoc test.
Results
NCK1-AS1 expression is predicted to be elevated in ESCC
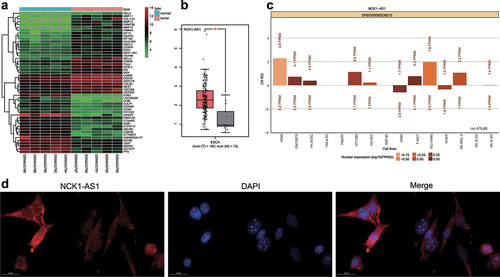
The differential genes were screened on the ESCC gene expression dataset GSE17351 from the GEO database with screening threshold of differential genes/miRNA set as |log2FC| > 1.5 and adj.P.Val <0.05, and expression heat maps of the top 50 differential genes were drawn () and NCK1-AS1 was the mostly differentially expressed gene, and the abnormally elevation of NCK1-AS1 in ESCC occurred based on the GEPIA database (). LncATLAS subcellular localization analysis of NCK1-AS1 and FISH showed that NCK1-AS1 was mainly expressed in cytoplasm (), as further confirmed by FISH results ().
Figure 1. The differential expression of lncRNA in ESCC. A, Expression heat map of the first 50 differentially expressed genes in the ESCC gene expression dataset GSE17351. The x-axis indicates the sample number, and the y-axis indicates the gene name, the histogram in the right upper indicates color gradation, and each rectangle in the diagram corresponds to one sample expression value. B, GEPIA database verifies the high expression of NCK1-AS1 in esophageal carcinoma (the red box indicates ESCC tissues, while the gray represents normal tissues). C, NCK1-AS1 subcellular localization data in LncATLAS. D, NCK1-AS1 cellular localization determined by the FISH assay. * p <0.05.
NCK1-AS1 inhibition represses aggressive tumor biology of ESCC cells
qRT-PCR displayed that elevation of NCK1-AS1 occurred in the ESCC cell lines (EC109, EC9706, TE-10, and KYSE-150) (). We then silenced NCK1-AS1 by constructing specific siRNA and transfected it into ESCC cells. qRT-PCR results () further validated that NCK1-AS1-1 expression was repressed in EC109 and EC 9706 cells after si-NCK1-AS1-1 and si-NCK1-AS1-2 transfection (silenced efficiency >70%).
Figure 2. Silencing of NCK1-AS1 represses cell proliferation, migration and invasion, but enhances apoptosis of ESCC cells. Cells were transfected with si-NCK1-AS1 in Panel D-F. A, the expression of NCK1-AS1 in esophageal epithelial cell line (HET-1A) and human ESCC cell line (EC109, EC9706) determined by qRT-PCR. * p <0.05 vs. HET-1A cells. B, the silencing efficiency of si-NCK1-AS1 assessed using qRT-PCR. C, ESCC cell proliferation determined by CCK-8. D, the migration of ESCC cells determined by scratch test. E, the invasion of ESCC cells determined by transwell assay. F, the apoptosis of ESCC cells determined by flow cytometry. * p <0.05 vs. si-NC. The measurement data were expressed by mean ± standard deviation, pairwise comparison was analyzed by independent sample t-test, while the comparison of which among multiple groups was assessed by one-way ANOVA with Tukey’s posttest. The experiment was repeated three times.
CCK-8, scratch test, transwell assay, and flow cytometry results (, Supplementary Figure S1) revealed markedly repressed proliferative, migrated and invasive abilities, but enhanced apoptotic capability of ESCC cells after silencing of NCK1-AS1 relative to si-NC transfection.
NCK1-AS1 could bind to miR-133b
DIANA-LncBase tool was utilized to predict possible binding miRNA of NCK1-AS1, which identified 586 miRNAs. In addition, seven miRNAs with significant differential expression were screened by differential analysis of the miRNA expression dataset. Venn analysis () identified only one intersection miRNA hsa-miR-133b. Moreover, NCK1-AS1 elevation was witnessed in ESCC samples from GSE6188 dataset. Further correlation analysis on NCK1-AS1 and miR-133b in the GSE6188 dataset revealed correlation Coefficient >0.99 and p < 0.05, which suggested strong correlation between NCK1-AS1 and miR-133b (Supplementary Figure S2). Afterwards, we plotted the differential expression heat map of miRNA on gene expression dataset GSE6188 (), and found the downregulation of miR-133b in ESCC. miR-133b expression was further validated in ESCC cell lines HET-1A, EC109, EC9706, TE-10 and KYSE-150. Relative to HET-1A cells, miR-133b level showed a significant decline in ESCC cell lines ().
Figure 3. miR-133b expression is regulated by NCK1-AS1. A, Venn plot of the intersected miRs targeted by NCK1-AS1 via DIANA-LncBase prediction and the differentially expressed miRnas from gene expression dataset GSE17351. B, the heat map of expression of differentially expressed miRs from gene expression dataset GSE6188 of ESCC, the x-axis indicates the sample number, the y-axis indicates the gene name, the histogram in the right upper indicates is color gradation, and each rectangle in the diagram corresponded to one sample expression value. C, the expression of miR-133b in cell line HET-1A, EC109 and EC9706 examined by qRT-PCR assay, * p <0.05 vs. HET-1A cells. D, Schematic diagram of targeted binding sites and mutation sites of miR-133b and NCK1-AS1. E, the binding relationship between miR-133b and NCK1-AS1 validated by dual luciferase reporter gene assay. * p <0.05 vs. cells transfected with mimic NC. F, the binding relationship between miR-133b and NCK1-AS1 verified by RIP. * p <0.05 vs. IgG. G, the interaction between miR-133b and NCK1-AS1 verified by RNA pull-down. * p <0.05 vs. NCK1-AS1-NC. H, the expression of miR-133b in NCK1-AS1 silenced ESCC cells determined using qRT-PCR. * p <0.05 vs. si-NC. I, the expression of NCK1-AS1 in miR-133b overexpressed ESCC cells determined using qRT-PCR. * p <0.05 vs. miR-NC. The measurement data were expressed by mean ± standard deviation, pairwise comparison was analyzed by independent sample t-test. The experiment was repeated three times.
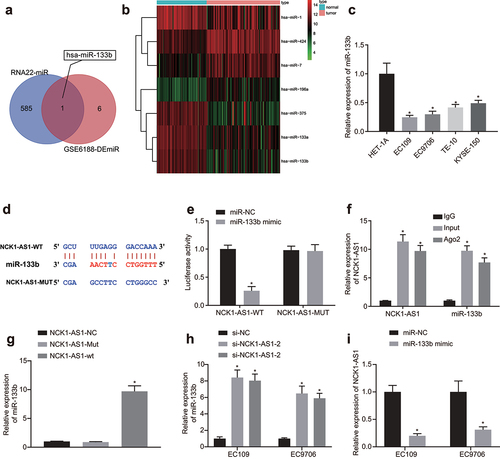
As predicted by the on-line analysis software, a specific binding region between NCK1-AS1 and hsa-miR-133b sequences was found, indicating that NCK1-AS1 may regulate miR-133b in ESCC (). Dual luciferase reporter gene assay results revealed that in comparison with mimic NC-transfected cells, luciferase signal of NCK1-AS1-WT was reduced in cells transfected with miR-133b mimic (). RIP results revealed that Ago2 bound NCK1-AS1 and miR-133b was strongly increased relative to IgG (). As reflected by RNA pull-down, compared to NCK1-AS1-NC, miR-133b expression was remarkably elevated in NCK1-AS1-WT-transfected cells, while miR-133b expression exhibited no marked change in response to NCK1-AS1-MUT (). To further investigate the regulatory effect between NCK1-AS1 and miR-133b, we altered their expression in ESCC cells We found that miR-133b expression was increased after NCK1-AS1 was silenced (), and when miR-133b was overexpressed, NCK1-AS1 expression was decreased ().
NCK1-AS1 silencing represses oncogenic phenotype of ESCC cells by upregulating miR-133b expression
qRT-PCR revealed that NCK1-AS1 expression was markedly reduced, while miR-133b expression was potently enhanced after si-NCK1-AS1 treatment alone, while opposite results were witnessed in cells transfected with miR-133b inhibitor alone; NCK1-AS1 and miR-133b expression in cells transfected with si-NCK1-AS1 in combination with miR-133b inhibitor restored to expression of that after si-NC and inhibitor NC transfection ().
Figure 4. NCK1-AS1 inhibition represses cell proliferation, migration and invasion, but enhances apoptosis of ESCC cells by elevating miR-133b expression. Cells were transfected with plasmids containing si-NC + inhibitor NC, si-NCK1-AS1 + inhibitor NC, si-NC + miR-133b inhibitor or si-NCK1-AS1 + miR-133b inhibitor. A, The expression of NCK1-AS1 assessed by qRT-PCR. B, The expression of miR-133b assessed by qRT-PCR assay. C, ESCC cell proliferation determined by CCK-8. D, The migration of ESCC cells determined by scratch test. E, The invasion of ESCC cells determined by transwell assay. F, The apoptosis of ESCC cells determined by flow cytometry. * p < 0.05vs. si-NC + inhibitor NC; # p < 0.05vs. si-NC + miR-133b inhibitor. The measurement data were expressed by mean ± standard deviation, pairwise comparison was analyzed by independent sample t-test. Comparison of which among multiple groups was assessed by one-way ANOVA and Tukey’s post-test. The experiment was repeated three times.
CCK-8, scratch test, transwell assay, and flow cytometry results (, Supplementary Figure S3) revealed markedly repressed cell proliferative, migrative and invasive abilities, but enhanced apoptotic ability of ESCC cells in response to si-NCK1-AS1 treatment alone, while opposite results were observed after miR-133b inhibitor treatment alone. si-NCK1-AS1 in combination with miR-133b inhibitor restored these trends to that of si-NC and inhibitor NC transfection.
NCK1-AS1 upregulates ENPEP expression by competitively binding to miR-133b
We obtained 7473, 928, 308 and 11,200 target genes of miR-133b by the RNA22, mirDIP, DIANA, and miRWALK databases, respectively, and obtained the only intersecting gene, ENPEP (). The ENPEP expression profile in GSE17351 dataset showed that ENPEP was highly expressed in ESCC (). In addition, high expression of ENPEP in esophageal carcinoma was also reported in the GEPIA database (). qRT-PCR and Immunoblotting revealed that relative to HET-1A cells, ENPEP expression was substantially elevated in EC109 and EC9706 cells (; Supplementary Figure S4A).
Figure 5. NCK1-AS1 competitively binds to miR-133b by upregulating expression of ENPEP. A, the Venn plot of intersection predicated by RNA22, mirDIP, DIANA and miRWALK. B, Expression of ENPEP in ESCC-related dataset GSE17351. C, Expression of ENPEP from GEPIA database in esophageal carcinoma. D, mRNA expression of ENPEP in EC109 and EC9706 cells examined by qRT-PCR. E, Protein expression of ENPEP in ESCC cells analyzed by immunoblotting assay. F, Schematic diagram of targeted binding sites and mutation sites between miR-133b and ENPEP assessed by bioinformatic analysis. G, the binding relationship between miR-133b and ENPEP determined by dual luciferase reporter gene assay. H, the correlation of expression of NCK1-AS1 and ENPEP in the GSE17351 dataset. The x-axis represents the expression of NCK1-AS1, the y-axis represents the expression of ENPEP, each point in the figure represents a sample, and the upper part represents the correlation coefficient and p value. I, the expression of ENPEP protein determined by immunoblotting. * p <0.05 vs. HET-1A cells, mimic NC, or si-NC + inhibitor NC. The measurement data were expressed by mean ± standard deviation, pairwise comparison was analyzed by independent sample t-test. Comparison of which among multiple groups was assessed by one-way ANOVA Tukey’s posttest.
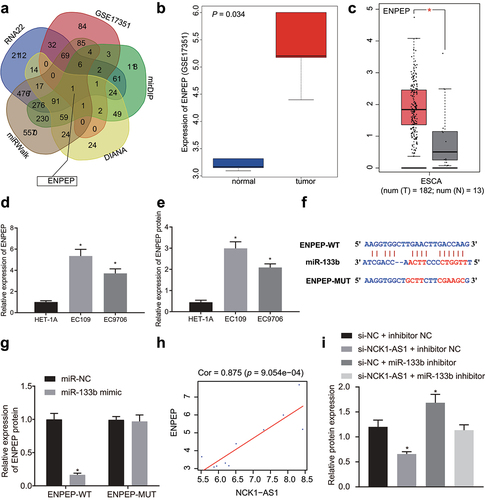
The binding site of miR-133b and ENPEP was obtained through bioinformatics analysis (), and then ENPEP-WT and ENPEP-MUT were constructed at the binding site region. Dual luciferase reporter gene assay displayed reduced fluorescence intensity of the ENPEP-WT in response to miR-133b-mimic relative to mimic NC, but no such significant difference in the ENPEP-MUT (). A significant positive correlation was noted between NCK1-AS1 and ENPEP based on GSE17351 dataset (). Immunoblotting results revealed NCK1-AS1 knockdown repressed ENPEP protein level, but opposite effects were observed after miR-133b inhibitor treatment alone. ENPEP expression in cells transfected with si-NCK1-AS1 in combination with miR-133b inhibitor was recovered to the level after si-NC and inhibitor NC transfection (; Supplementary Figure S4B). In conclusion, NCK1-AS1 competitively bound to miR-133b to upregulate ENPEP expression.
ENPEP overexpression reverses inhibitory role of NCK1-AS1 silencing in proliferative, migrative, invasive, and apoptotic abilities of ESCC cells
To understand better the effect of ENPEP on NCK1-AS1, we adopted qRT-PCR and immunoblotting to determine ENPEP expression, and found that expression of ENPEP was repressed in response to si-NCK1-AS1 relative to si-NC in the presence of pcDNA, with opposite effect was witnessed after ENPEP overexpression. Furthermore, ENPEP overexpression increased ENPEP expression in cells transfected with si-NCK1-AS1 (; Supplementary Figure S4C).
Figure 6. ENPEP overexpression reversed effects of NCK1-AS1 knockdown on the proliferation, migration invasion and apoptosis of ESCC cells. Cells were transfected with si-NC + pcDNA, si-NCK1-AS1 + pcDNA, si-NC+ ENPEP or si-NCK1-AS1 + ENPEP. A, The mRNA expression of ENPEP assessed by qRT-PCR. B, The protein expression of ENPEP determined by immunoblotting. C, ESCC cell proliferation determined by CCK-8. D, The migration of ESCC cells determined by scratch test. E, The invasion of ESCC cells determined by transwell assay. F, The apoptosis of ESCC cells determined by flow cytometry. * p < 0.05 vs. si-NC + pcDNA; # p< 0.05 vs. si-NC + ENPEP. The measurement data were expressed by mean ± standard deviation and pairwise comparison was analyzed by independent sample t-test. Comparison of which among multiple groups was assessed by one-way ANOVA and Tukey’s post-test. The experiment was repeated three times.
CCK-8, scratch test, transwell assay, and flow cytometry (; Supplementary Figure S4D, Supplementary Figure S5A, B) revealed NCK1-AS1 knockdown markedly repressed cell proliferative, migrative and invasive abilities, but enhanced apoptotic capability of ESCC cells, while ENPEP overexpression triggered opposite effect. si-NCK1-AS1 in combination with ENPEP overexpression reversed the inhibitory effects of NCK1-AS1 knockdown on cell proliferative, invasive, migrative and apoptotic abilities of ESCC cells.
Silencing NCK1-AS1 suppresses tumor growth in nude mice
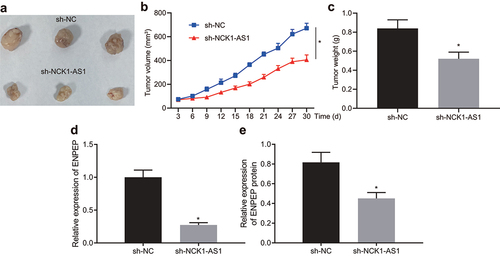
To validate further the effect of NCK1-AS1 on xenograft tumor formation, we injected the stably transfected ESCC cells expressing sh-NC and sh-NCK1-AS1 subcutaneously into nude mice. As shown in , tumor volume was increased in a time-dependent fashion, while NCK1-AS1 knockdown decreased the average tumor size and weight in the mice (). As demonstrated by qRT-PCR and immunoblotting, ENPEP expression was reduced after NCK1-AS1 knockdown in the dissected tumor from mice ().
Figure 7. Silencing NCK1-AS1 suppresses tumor growth in nude mice. To validate further the effect of NCK1-AS1 expression on xenograft tumor formation, we injected the stably transfected ESCC cells with sh-NC and sh-NCK1-AS1 subcutaneously into nude mice, and measured the tumor volume. A, Tumor images. B, The tumor size in the mice injected with sh-NCK1-AS1 treated cells and sh-NC treated cells. C, The tumor weight in the mice injected with sh-NCK1-AS1 treated cells and sh-NC treated cells. D, ENPEP mRNA expression determined with qRT-PCR after sh-NCK1-AS1 injection in the dissected tumor from nude mice. E, ENPEP protein expression determined with immunoblotting after sh-NCK1-AS1 injection in the dissected tumor from nude mice. * p < 0.05 compared with sh-NC. The measurement data were expressed by mean ± standard deviation and pairwise comparison was analyzed by independent sample t-test. n = 12.
Discussion
ESCC is one of the most common forms of fatal cancer worldwide, with about 250,000 confirmed cases in China every year. Several environmental factors are relevant to the morbidity of ESCC, including poor nutrition and alcohol consumption [Citation24]. LncRNAs may play vital roles in various biological processes via functional interactions with a wide range of RNA molecules by competitively binding to microRNA [Citation25]. Moreover, according to the study of Kano et al., a tumor-suppressive function has been identified in three miRNAs, including miR-133b, which inhibited cell invasion and proliferation in ESCC cells [Citation26]. Thus, this study verified that NCK1-AS1 upregulated ENPEP by binding to miR-133b and finally promoted proliferative, migrative, invasive and apoptotic capabilities of ESCC cells, which draws attention to potential pathways for new ESCC therapeutics.
Initially, we found that elevation of NCK1-AS1 occurred in ESCC cells, while the silencing of NCK1-AS1 inhibited proliferative and invasive abilities of ESCC cells. Oncogenic phenotype of EC cells were correlated to various members of the lncRNA family (H19, PEG10, HOTAIR, ESCCAL-1, UCA1, and TUG1) [Citation27]. Besides, certain lncRNAs (HOTAIR, CASC9, and FOXD2-AS1) played a vital role in ESCC and other malignant tumors [Citation28]. For instance, Ge et al. examined in detail the molecular mechanism of HOTAIR in ESCC cells, in which HOTAIR overexpression was associated with enhanced metastasis of ESCC cell lines [Citation29]. In accordance with present results, a previous study has demonstrated that NCK1-AK1 had aberrantly high expression in cervical cancer, as assessed by TCGA sequencing data sets [Citation30]. Elevation of NCK1-AS occurs in nasopharyngeal carcinoma, and gastric cancer and exerts tumor-promoting effects on cancer cells [Citation7,Citation8], although the expression of NCK1-AS has not been reported in ESCC.
Subsequently, miR-133b was regulated by NCK1-AS1 and miR-133b expression was strikingly downregulated in ESCC cells. Consistently, downregulation of miR-133b occurred in ESCC tissues based on bioinformatics analysis [Citation31]. Other reports have demonstrated that lncRNAs can drive a number of essential cancer phenotypes through various mechanisms, including miRNA sponging [Citation28]. Li et al. reported that NCK1-AS1 could act as a miRNA sponge to bind miR-6857 in cervical cancer [Citation30]. Moreover, lncRNA KCNQ1 promoted the development of ESCC by competitively binding to miR-133b [Citation14]. The similar mechanism of THAP9-AS1 and miR-133b has also been reported in ESCC [Citation32]. In the subsequent analysis, we also found that miR-133b elevation depressed the proliferative and invasive capabilities of ESCC cells. The depressed cell proliferation in ESCC cell lines was connected with the overexpression of miR-133b, while its low expression was a clinical pathological feature of patients with ESCC [Citation27].
In addition, miR-133b was found to inhibit cell invasion and proliferation in osteosarcoma by targeting Sirt1 [Citation33]. It is in line with our finding that ENPEP was a target gene of miR-133b, which can bind to NCK1-AS1 to regulate ENPEP expression. Our study has indicated that the expression of ENPEP was markedly boosted in ESCC cells. ENPEP, which is encoded by a single gene, is elevated in human small intestine-terminal ileum and kidney cortex cells [Citation34]. Remarkably, overexpression of ENPEP was discovered in a respectively high proportion of breast tumor tissues [Citation17], and other research shows that ENPEP is directly targeted by miR-125b, functioning as a tumor suppressor in breast cancer [Citation17]. In the current study, we also found that ENPEP could reverse the inhibitory effect of NCK1-AS1 and miR-133b on the proliferative and invasive abilities of ESCC cells.
Conclusion
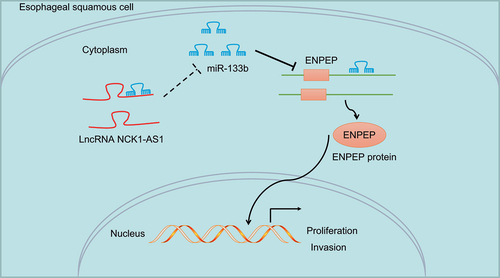
To sum up, we found that knockdown of NCK1-AS1 upregulates miR-133b to repress the proliferation, invasion, migration, but promotes apoptosis of ESCC cells through downregulation of ENPEP (). We note that further testing in vivo is essential to confirm our results and provide a better basis for planning future ESCC treatment strategies. Moreover, survival analysis would be performed on patients with ESCC in the future. Due to lack of research funding and the difficulty in collecting clinical samples, we have not been able to verify the difference of ENPEP protein between tumor tissues and normal tissues in clinical samples. We will improve and verify in future research.
Figure 8. The possible mechanism by which NCK1-AS1 regulates ENPEP expression in regulating the proliferation and invasion of ESCC by binding to miR-133b. In ESCC cells, NCK1-AS1 is highly expressed, and inhibits miR-133b expression. NCK1-AS1 inhibition repressed the expression of ENPEP by binding to miR-133b, thereby inhibiting proliferation and invasion of ESCC cells. Overexpression of ENPEP reversed the inhibition of NCK1-AS1 silencing on the functions of ESCC cells.
Supplemental Material
Download Zip (15.9 MB)Disclosure statement
No potential conflict of interest was reported by the author(s).
Data availability statement
Data generated and analyzed as part of this study are included in the manuscript or are available upon request from the corresponding author.
Supplementary material
Supplemental data for this article can be accessed online at https://doi.org/10.1080/15384101.2022.2138416
References
- Lin Y, Totsuka Y, He Y, et al. Epidemiology of esophageal cancer in Japan and China. J Epidemiol. 2013;23(4):233–242. DOI:10.2188/jea.JE20120162
- Abnet CC, Arnold M, Wei WQ. Epidemiology of esophageal squamous cell carcinoma. Gastroenterology. 2018;154(2):360–373.
- Ohashi S, Miyamoto S, Kikuchi O, et al. Recent advances from basic and clinical studies of esophageal squamous cell carcinoma. Gastroenterology. 2015;149(7):1700–1715. DOI:10.1053/j.gastro.2015.08.054
- Stoner GD, Wang LS, Chen T. Chemoprevention of esophageal squamous cell carcinoma. Toxicol Appl Pharmacol. 2007;224(3):337–349.
- Shi X, Sun M, Liu H, et al. Long non-coding RNAs: a new frontier in the study of human diseases. Cancer Lett. 2013;339(2):159–166. DOI:10.1016/j.canlet.2013.06.013
- Chen Z, Lin J, Wu S, et al. Up-regulated miR-548k promotes esophageal squamous cell carcinoma progression via targeting long noncoding RNA-LET. Exp Cell Res. 2018;362(1):90–101. DOI:10.1016/j.yexcr.2017.11.006
- Hu H, Li H, Feng X. Downregulation of lncRNA NCK1-AS1 inhibits cancer cell migration and invasion in nasopharyngeal carcinoma by upregulating miR-135a. Cancer Manag Res. 2019;11:10531–10537.
- Li W, Duan J, Shi W, et al. Long non-coding RNA NCK1-AS1 serves an oncogenic role in gastric cancer by regulating miR-137/NUP43 Axis. Onco Targets Ther. 2020;13:9929–9939.
- Ha M, Kim VN. Regulation of microRNA biogenesis. Nat Rev Mol Cell Biol. 2014;15(8):509–524.
- Ju Q, Zhao YJ, Ma S, et al. Genome-wide analysis of prognostic-related lncRnas, miRnas and mRnas forming a competing endogenous RNA network in lung squamous cell carcinoma. J Cancer Res Clin Oncol. 2020;146(7):1711–1723. DOI:10.1007/s00432-020-03224-8
- Tay Y, Rinn J, Pandolfi PP. The multilayered complexity of ceRNA crosstalk and competition. Nature. 2014;505(7483):344–352.
- Zhu JF, Liu Y, Huang H, et al. MicroRNA-133b/egfr axis regulates esophageal squamous cell carcinoma metastases by suppressing anoikis resistance and anchorage-independent growth. Cancer Cell Int. 2018;18(1):193. DOI:10.1186/s12935-018-0684-y
- Zeng W, Zhu JF, Liu JY, et al. miR-133b inhibits cell proliferation, migration and invasion of esophageal squamous cell carcinoma by targeting EGFR. Biomed Pharmacother. 2019;111:476–484.
- Xu H, Miao J, Liu S, et al. Long non-coding RNA KCNQ1 overlapping transcript 1 promotes the progression of esophageal squamous cell carcinoma by adsorbing microRNA-133b. Clinics (Sao Paulo). 2021;76:e2175.
- Chen G, Peng J, Zhu W, et al. Combined downregulation of microRNA-133a and microRNA-133b predicts chemosensitivity of patients with esophageal squamous cell carcinoma undergoing paclitaxel-based chemotherapy. Med Oncol. 2014;31(11):263. DOI:10.1007/s12032-014-0263-6
- Wang A, Chu H, Jin Z, et al. ENPEP as a potential predictor of immune checkpoint inhibitor efficacy. Cancer Med. 2021;11(3):880–887. DOI:10.1002/cam4.4475
- Feliciano A, Castellvi J, Artero-Castro A, et al. miR-125b acts as a tumor suppressor in breast tumorigenesis via its novel direct targets ENPEP, CK2-alpha, CCNJ, and MEGF9. PLoS One. 2013;8(10):e76247. DOI:10.1371/journal.pone.0076247
- Huang L, Li X, Ye H, et al. Long non-coding RNA NCK1-AS1 promotes the tumorigenesis of glioma through sponging microRNA-138-2-3p and activating the TRIM24/Wnt/beta-catenin axis. J Exp Clin Cancer Res. 2020;39(1):63. DOI:10.1186/s13046-020-01567-1
- Wang B, Wang K, Jin T, et al. NCK1-AS1 enhances glioma cell proliferation, radioresistance and chemoresistance via miR-22-3p/igf1r ceRNA pathway. Biomed Pharmacother. 2020;129:110395.
- Yao L, Zhang Y, Zhu Q, et al. Downregulation of microRNA-1 in esophageal squamous cell carcinoma correlates with an advanced clinical stage and its overexpression inhibits cell migration and invasion. Int J Mol Med. 2015;35(4):1033–1041. DOI:10.3892/ijmm.2015.2094
- Mas-Ponte D, Carlevaro-Fita J, Palumbo E, et al. LncATLAS database for subcellular localization of long noncoding RNAs. RNA. 2017;23(7):1080–1087. DOI:10.1261/rna.060814.117
- Tang Z, Li C, Kang B, et al. GEPIA: a web server for cancer and normal gene expression profiling and interactive analyses. Nucleic Acids Res. 2017;45(W1):W98–102. DOI:10.1093/nar/gkx247
- Ayuk SM, Abrahamse H, Houreld NN. The role of photobiomodulation on gene expression of cell adhesion molecules in diabetic wounded fibroblasts in vitro. J Photochem Photobiol B. 2016;161:368–374.
- Song C, Xing D, Tan W, et al. Methylenetetrahydrofolate reductase polymorphisms increase risk of esophageal squamous cell carcinoma in a Chinese population. Cancer Res. 2001;61(8):3272–3275.
- Chen G, Wang Z, Wang D, et al. LncRnadisease: a database for long-non-coding RNA-associated diseases. Nucleic Acids Res. 2013;41(Database issue):D983–986. DOI:10.1093/nar/gks1099
- Kano M, Seki N, Kikkawa N, et al. miR-145, miR-133a and miR-133b: tumor-suppressive miRnas target FSCN1 in esophageal squamous cell carcinoma. Int J Cancer. 2010;127(12):2804–2814. DOI:10.1002/ijc.25284
- Li S, Xu Y, Sun Z, et al. Identification of a lncRNA involved functional module for esophageal cancer subtypes. Mol Biosyst. 2016;12(11):3312–3323. DOI:10.1039/C6MB00101G
- Wang W, Wei C, Li P, et al. Integrative analysis of mRNA and lncRNA profiles identified pathogenetic lncRnas in esophageal squamous cell carcinoma. Gene. 2018;661:169–175.
- Ge XS, Ma HJ, Zheng XH, et al. HOTAIR, a prognostic factor in esophageal squamous cell carcinoma, inhibits WIF-1 expression and activates Wnt pathway. Cancer Sci. 2013;104(12):1675–1682. DOI:10.1111/cas.12296
- Li H, Jia Y, Cheng J, et al. LncRNA NCK1-AS1 promotes proliferation and induces cell cycle progression by crosstalk NCK1-AS1/miR-6857/CDK1 pathway. Cell Death Dis. 2018;9(2):198. DOI:10.1038/s41419-017-0249-3
- Wang Z, Li H, Li F, et al. Bioinformatics-Based identification of a circRNA-miRNA-mRNA axis in esophageal squamous cell carcinomas. J Oncol. 2020;2020:8813800.
- Cheng J, Ma H, Yan M, et al. THAP9-AS1/miR-133b/sox4 positive feedback loop facilitates the progression of esophageal squamous cell carcinoma. Cell Death Dis. 2021;12(4):401. DOI:10.1038/s41419-021-03690-z
- Ying S, Jianjun H, Xue Y, et al. MicroRNA-133b inhibits cell proliferation and invasion in osteosarcoma by targeting Sirt1. Oncol Res. 2017;25(9):1421–1430. DOI:10.3727/096504016X14826089198805
- Holmes RS, Spradling-Reeves KD, Cox LA. Mammalian Glutamyl aminopeptidase genes (ENPEP) and proteins: comparative studies of a major contributor to arterial hypertension. J Data Mining Genomics Proteomics. 2017;8(2):2.