
ABSTRACT
This study investigated the effects of ibandronate (IBN) on cardiomyopathy remodeling in diabetic rats. A rat model of diabetic cardiomyopathy (DCM) was established by supplementing them with a high-calorie diet combined with a low dose of streptozotocin (STZ). The diabetic rats received IBN (5 µg/kg per day) or normal saline subcutaneously for 16 weeks. The hematoxylin and eosin (H&E) and Masson’s trichrome staining were performed for evaluating the myocardial morphologies of the rats. Echocardiography and cardiac catheter were performed to assess their cardiac functional parameters. The protein levels of connective tissue growth factor (CTGF), farnesyl pyrophosphate synthase (FPPS), and mitogen-activated protein kinase (MAPK) were determined using Western blot analysis. RhoA activation was detected using a small GTP protease-linked immunosorbent assay (GLISA). The diabetic rats showed the development of moderate hyperglycemia, insulin resistance, hyperlipidemia, myocardial fibrosis, FPPS overexpression, cardiac systolic, and diastolic dysfunction. Inhibiting the FPPS could ameliorate myocardial hypertrophy and fibrosis. These anatomical findings were accompanied by a significant improvement in heart function. Furthermore, the inhibition of FPPS, the increased activation of RhoA, and phosphorylation of p38 and extracellular signal-regulated kinase (ERK)1/2 in DCM decreased significantly with the treatment of IBN. This study for the first time demonstrated that the upregulation of FPPS expression might be involved in diabetic myocardial remodeling in diabetes mellitus (DM). In addition, IBN might exert its inhibitory effects on myocardial tissue remodeling by suppressing the RhoA/ERK1/2 and RhoA/p38 MAPK pathways in DCM.
Introduction
Diabetic cardiomyopathy (DCM) was first proposed by Hamby in 1974. He identified DCM as an independent and long-term diabetic complication of extremely complicated myocardial damage and showed that DCM was different from ischemic cardiomyopathy, hypertrophic cardiomyopathy, hypertensive cardiomyopathy, valvular cardiomyopathy, and other types of cardiomyopathies [Citation1]. The pathology of DCM involves the disorders of blood glucose and lipid metabolism, myocardial tissue inflammation, myocardial microangiopathy, and extensive necrosis of myocardial cells, which eventually lead to arrhythmia, heart failure (HF), and even sudden cardiac death (SCD) [Citation2,Citation3]. However, the specific pathogenic mechanism of DCM has not been fully explored yet. Therefore, elucidating the pathophysiologic mechanism of DCM has become a research hotspot nowadays.
Farnesyl pyrophosphate synthase (FPPS) is a key enzyme for the synthesis of geraniol pyrophosphate (GGPP) and farnesyl pyrophosphate (FPP), which are important ingredients for the prenylation of small GTP proteins, such as Rho and Ras GTPases, thereby playing important roles in various biological processes [Citation4]. Our previous studies revealed that FPPS expression significantly increased in spontaneously hypertensive rats (SHR) and angiotensin II (Ang II)-mediated cardiac hypertrophy. Furthermore, the inhibition of FPPS attenuated cardiac hypertrophy and fibrosis, probably through the mitogen-activated protein kinase (MAPK) pathway [Citation5]. The MAPK protein family includes serine/threonine-protein kinase regulators, which are widely distributed in vertebrates. The activated MAPK signaling participates in a variety of physiological processes, such as cellular growth, proliferation, and division [Citation6]. Numerous studies confirmed that the activated MAPK could contribute to the development of cardiac fibrosis [Citation7,Citation8].
Blocking the activity of FPPS, which is critical for the post-translational farnesylation and geranylgeranylation of small GTPase signaling proteins, can prevent the biosynthesis of isoprenoid lipids (FPP and GGPP) [Citation4]. Although ibandronate (IBN) is currently used for the treatment of bone-related diseases, it is also related to the pathogenesis of various cardiovascular diseases. However, the role of FPPS in the development of DCM in diabetic rats remains unclear [Citation4,Citation9].
Therefore, the current study hypothesized that the activated FPPS might be involved in the pathophysiological process of DCM. In order to test this hypothesis, a type 2 DCM rat model was established and the correlations of FPPS expression with the cardiac remodeling and cardiac function were determined. To further clarify the role of FPPS in DCM, IBN was used to inhibit FPPS in-vivo, thereby showing its potential as a treatment target for DCM.
Study design and methods
Establishment of DCM rat models
After approving the study by the Animal Ethics Committee of Medical Sciences of Zhejiang Academy, a total of 32 healthy male clean-grade Sprague-Dawley (SD) rats (118 ± 16 g) were purchased from Medical Sciences of Zhejiang Academy (Hangzhou, Zhejiang Province, China). The DCM rat models were established by supplementing the rats with a high-calorie diet, consisting of 10% fat, 10% sugar, 2.5% cholesterol, 1.0% cholate, and 76.5% normal diet, combined with a low dose of streptozotocin (STZ) (Sigma, St. Louis) [Citation4], as described in our previous study. Briefly, after the intraperitoneal glucose tolerance test (IPGTT) and intraperitoneal insulin tolerance test (IPITT) were performed, the rats were randomly divided into three groups, including the control group (Control, n = 8), diabetes group (DM, n = 12) and IBN (Sigma, St. Louis, MO, USA) treatment group (subcutaneous injection of 5 µg/kg per day of DM+IBN, n = 12); the entire experimental period was 21 weeks, including the last 16 weeks of drug interventions. The control group rats were fed with normal chow, consisting of 20% crude protein, 4% crude fat, 5% crude fiber, and 74% other ingredients, including carbohydrates, microelements, etc. while the other group of rats received the high-calorie diet. After four weeks, the IPGTT and IPITT were again performed, and their blood samples were collected from their tail veins. Then, the model group rats were injected once with 30 mg/kg of STZ, while the control group rats received the same volume of citrate buffer at the same time. All the rats were fed with chow after this treatment. The insulin sensitivity index (ISI) was calculated based on fasting blood glucose (FBG) and insulin levels (ISI, ISI=In [FINS x FBG]−1). After one week of STZ administration, the rats with FBG >16.7 mmol/L, low ISI, polyuria, polydipsia, and polyphagia were considered as successfully established DCM rat models. The DM+IBN group rats were subcutaneously injected with 5 μg/kg of IBN into their backs (shoulders) at around 8:00 to 9:00 a.m., while the other two groups were injected with the same amount of normal saline at the same site. All the animal experiments were approved by the ethics committee of the Medical Sciences of Zhejiang Academy and performed according to the National Institutes of Health Guide for the Care and Use of Laboratory Animals.
IPGTT and IPITT
Glucose tolerance in each rat was assessed using IPGTT after 12 h of fasting. A bolus of glucose (1 g/kg) was intraperitoneally injected after measuring the FBG [Citation10]. The blood glucose levels were measured using the blood samples taken from tail veins at 0 min, 15 min, 30 min, 60 min, and 120 min of glucose injection. The area under the curve (AUC) was then calculated according to the following function: AUC = 0.5*(FBG 0 min + FBG 30 min)/2 + 0.5 * (FBG 30 min + FBG 60 min)/2 + l * (FBG 60 min + FBG 120 min)/2. On the other hand, the IPITT was also performed on each rat after 8 h of fasting. A bolus of insulin (1 unit/kg) was intraperitoneally injected after measuring the FBG. The blood glucose levels at each time point were measured as described above.
Blood analyses
After overnight fasting, the blood samples were taken from the tail veins of the rats. An automatic biochemical analyzer (AU5421, Olympus, Tokyo, Japan) was used for measuring the blood lipids, including total cholesterol (TC), high-density lipoprotein-cholesterol (HDL-C), low-density lipoprotein-cholesterol (LDL-C), and triglyceride (TG). FINS levels were measured using an automated immunoassay luminometer (e610, Roche Cobas, Basel, Switzerland). ISI values were calculated using Eq. (1).
Measurement of blood pressure
A noninvasive tail-cuff system (BP-98A, Softron, Tokyo, Japan) was used to measure systolic blood pressure (SBP), diastolic blood pressure (DBP), and heart rate (HR) as described in a previous study [Citation11].
Echocardiography assessment
Echocardiography was performed using a high-frequency ultrasound device (Vevo 2100, VisualSonics, Toronto, Canada). After anesthetizing using isoflurane (IsoFlo; Abbott Laboratories, Abbott Park, IL), the rats were laid in the supine position on the ultrasound examination table, and their chest hairs were removed. Then, a warm coupling agent was evenly applied to the precordial area. The ultrasound probe (MS550D, frequency 22~55 MHz) was adjusted in a suitable position to ensure the clear imaging of the thoracic cavity. All the measurements were recorded continuously for six consecutive cardiac cycles by the same researcher, who did not know about the purpose of the study. The cardiac wall thickness and left ventricle (LV) dimensions were obtained from the long-axis view at the level of chordae tendineae. The LV end-diastolic diameter (LVEDd), LV end-systolic diameter (LVESd), LV end-diastolic posterior wall diameter (LVPWd), and interventricular septum end-diastolic diameter (IVSd) were measured using the M-mode ultrasound echo as per the recommendations of the American Society of Echocardiography [Citation12]. Moreover, the LV ejection fraction (LVEF) and fractional shortening (FS) were automatically recorded based on these parameters using the ultrasound system.
Hemodynamic measurement
After the cardiac ultrasound measurements, the hemodynamic parameters were measured. After the rats were deeply anesthetized, they were fixed in the supine position, fully exposing their necks. After isolating the right common carotid artery, the distal end of it was ligated and the proximal end was clamped and fixed using an arterial clip. Then, a V-shaped incision was made in the common carotid artery using a pair of small ophthalmic scissors (Vannas Scissors, Suqian. China). Finally, when the aortic valve opened, a PE50 catheter (inner diameter of 1 mm, Smith Medical, Minneapolis, UK) was inserted into the left ventricle along the artery and connected to the Medlab biosignal acquisition and processing system (Mayi Technology, Nanjing, China) through a pressure transducer. The hemodynamic parameters, including LV systolic pressure (LVSP), LV end-diastolic pressure (LVEDP), maximum rate of LV pressure rise during isovolumic systole (+dp/dtmax), maximum rate of LV pressure drop during isovolumic diastole (-dp/dtmax), maximum ventricular pressure (MVP), least ventricular pressure (LVP), an interval of LV contraction to +dp/dtmax (t- dp/dtmax), maximum shortening speed of LV myocardial contractile component (Vpm), and shortening speed of LV myocardial contractile component at zero loads (Vmax), were recorded after the conditions were stable for about 15–20 min.
Histology and immunohistochemistry
The rats were euthanized after measuring all the parameters. Then, their heart tissues were excised quickly and rinsed with normal saline. The tissues were then fixed with 4% paraformaldehyde for 48 h, followed by slicing into 4-µm-thick sections and paraffin embedding. The shape and arrangement of the myocardium were assessed using hematoxylin and eosin (H&E) staining, while the extent of collagen fibrosis was identified using Masson’s trichrome staining. After staining, the tissue sections were then observed under a microscope.
The paraffinized tissue sections of rat aortas, which were fixed in formaldehyde, were incubated at 4°C overnight with a primary antibody against collagen I (1:200 dilution; Abcam, Cambridge, MA). Among the negative control reactions, instead of primary antibody, goat nonimmune IgG, rabbit non-immune IgG, or secondary antibody were used. In all the cases, the negative control reactions did not show significant staining. The immunostaining data were quantified without comparing them to the treatment group.
The collagen volume fraction (CVF) and immunohistochemical results were analyzed using Image-Pro Plus 5.0 analysis software (Media Cybernetics, Houston, TX, USA).
Western blot and GTP protease-linked immunosorbent assay (GLISA) analyses
Western blot analysis was performed as described in a previous study [Citation13]. The tissues sections were incubated with the primary antibodies against FPPS, connective tissue growth factor (CTGF) (Abcam, Cambridge, UK), phospho (p)-extracellular signal-regulated kinase (ERK)/ERK, p-p38/p38 MAPK, and p – Jun NH2-terminal kinase (JNK)/JNK (Cell Signaling Technology, Beverly, MA), followed by incubation with the respective anti-IgG horseradish peroxidase-conjugated secondary antibodies. The levels of FPPS and CTGF levels were normalized to that of β-actin as an internal control and the levels of phosphorylation-specific proteins were normalized to that of the total proteins. The bands were quantified using Image-Pro Plus 5.0 analysis software (Media Cybernetics, Houston, TX, USA).
GLISA was performed for identifying the activation state of RhoA using RhoA Activation Assay Kit (Cytoskeleton, BK124, Denver, CO, USA), following the manufacturer’s instructions.
Statistical analyses
All the data were presented as mean ± standard error of the mean (SEM). The one-way analysis of variance (ANOVA) was used for comparing the data among multiple groups. Tukey – Kramer post hoc test and unpaired two-tailed Student’s t-test for the normally distributed continuous variables and Mann-Whitney U-test for non-normally distributed variables were performed for comparing the results between two groups. The homogeneity of variances was confirmed using the F test. For the data, which did not meet the requirement of equal variance, Tamhane’s T2 test was performed. A P-value of <0.05 was considered statistically significant. All the statistical analyses were performed using SAS version 9.3 (SAS Institute, Cary, North Carolina).
Results
Establishment of DCM rat models
General characteristics of DCM rat models
Most diabetic patients are clinically characterized by polydipsia, polyphagia, and polyuria [Citation14]. Therefore, the intake of food and water by the rats as well as their urine volumes were monitored daily. Moreover, other vital signs, including HR, SBP, and DBP, were also measured. As expected, the diabetic rats exhibited the above-mentioned clinical characteristics. As listed in , the DM group rats had higher food intake (28.92 ± 0.61 g/d vs. 18.01 ± 0.82 g/d, P < 0.01), water intake (171.44 ± 3.53 mL/d vs. 24.93 ± 1.05 mL/d, P < 0.001), and urine volume (131.33 ± 3.42 mL/d vs. 22.06 ± 1.99 mL/d, P < 0.001) as compared to those in the control group. There were no significant differences in the HR, SBP, DBP, and body weights between the two groups. These results suggested that the diabetic rats did not have hypertension, which could promote cardiac hypertrophy.
Table 1. Animal characteristics for control, DM, DM+IBN groups at the end of the experiment.
Glucose and insulin tolerance
The SD rats generally develop insulin resistance after a four-week high-calorie diet, which gets worse with the progression of diabetes, but this condition should be confirmed using IPGTT and IPITT [Citation8]. Therefore, the IPGTT and IPITT were performed in the rats after a four-week high-calorie diet as well as at the end of the experimental procedure. The DM group rats showed an impaired IPGTT as compared to those of the control group, showing significantly higher levels of blood glucose at all time points (P <0.01) (). Meanwhile, the AUC of the DM group was higher compared to that of the control group (). Moreover, the IPITT results also showed a similar tendency ( c–1). In summary, these results indicated that the DM group rats developed insulin resistance after a four-week high-calorie diet. At the end of the experimental procedure, insulin resistance in the DM group rats did not improve but worsened. As compared to those in the control group, the blood glucose levels in the DM group, identified using IPGTT and IPITT, increased significantly at all the time points (P < 0.01) ( a–2). In addition, the DM group rats also showed higher AUC values in the IPGTT () and IPITT () results.
Figure 1. Results of intraperitoneal glucose tolerance test (IPGTT) and intraperitoneal insulin tolerance test (IPITT) after 4 weeks of a high-calorie diet. (a) Glucose levels in the three groups at different time points by IPGTT. (b) Area under the blood sugar curve of each group by IPGTT. (c) Glucose levels in the three groups at different time points by IPITT. (d) Area under the blood sugar curve of each group by IPITT. All the data are expressed as mean ± SEM; n = 6–8 per group. * P < 0.05; ** P <0.01 vs. Control. Abbreviations: AUC, area under the curve; DM, diabetes mellitus; IBN, ibandronate.
Figure 2. Result of intraperitoneal glucose tolerance test (IPGTT) and intraperitoneal insulin tolerance test (IPITT) at the end of the experimental procedure. (a) Glucose levels in the three groups at different time points by IPGTT. (b) Area under the blood sugar curve of each group by IPGTT. (c) Glucose levels in the three groups at different time points by IPITT. (d) Area under the blood sugar curve of each group by IPITT. All the data are expressed as mean ± SEM; n = 6–8 per group. * P < 0.05; ** P <0.01 vs. Control. Abbreviations: AUC, area under the curve; DM, diabetes mellitus; IBN, ibandronate.
Biochemical indicators in DM rats
The previous study showed the elevation of not only FBG in diabetic patients accompanied by abnormal lipid metabolism [Citation15]. Therefore, the FBG and lipids contents were measured in rats every week. The biochemical data are presented in . After a four-week high-calorie diet, the FINS, TC, TG, and LDL levels in the DM group were significantly higher as compared to those in the control group, while the ISI decreased significantly. One week after STZ injection, the FBG, TC, TG, and TG levels in the DM group rats increased significantly faster as compared to those in the control group (P < 0.01), while the levels of HDL and ISI decreased (P < 0.05~P < 0.01). After 4, 12, and 16 weeks of DM onset, the levels of FBG, TC, TG, and LDL-C were significantly higher in the DM group as compared to those in the control group (P < 0.01), while the levels of ISI and HDL decreased significantly (P < 0.01). Therefore, the high-calorie diet- and STZ-induced DM mice showed the characteristics of moderate hyperglycemia, insulin resistance, and hyperlipidemia, which were similar to the characteristics of human diabetes.
Figure 3. Lipid and glucose metabolism in the three groups at different time points. (a) Total cholesterol (TC) levels. (b) Triglyceride (TG) levels. (c) Fasting blood glucose (FBG) levels. (d) Fasting insulin (FINS) levels. (e) Low-density lipoprotein-cholesterol (LDL-C) levels. (f) High-density lipoprotein-cholesterol (HDL-C) levels. (g) Insulin sensitivity index (ISI) levels. All the data are expressed as mean ± SEM; n = 6–8 per group. * P < 0.05; ** P <0.01 vs. Control and # P <0.05; ## P <0.01 vs. DM. Abbreviations: DM, diabetes mellitus; IBN, ibandronate; w, weeks.
LV functional assessment using echocardiography and catheterization
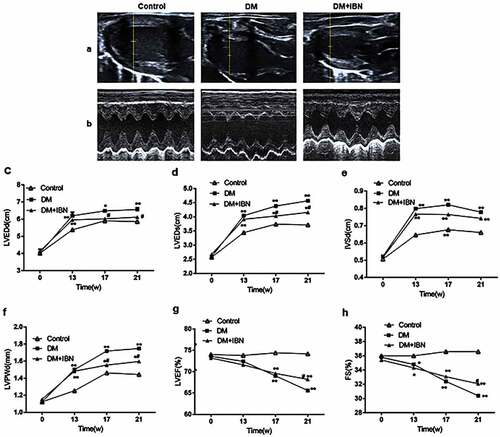
Echocardiography is an ideal method for the noninvasive monitoring of cardiac function in small animals [Citation16]. Furthermore, the present study also used the most accurate and direct cardiac catheterization technique. The structural (LVEDd, LVESd, LVPWd, and IVSd) and functional (LVEF and LVFS) parameters of rats were assessed using echocardiography (). The results showed that the levels of LVEDd, LVESd, LVPWd, and IVSd in the DM group rats increased significantly as compared to those in the control group after eight weeks of DM model establishment ( c–). However, the LVEF and FS in the DM group were impaired from week 17 () and decreased further at the end of the experimental procedure.
Figure 4. Cardiac ultrasound results in the three groups at different time points. (a) Representative two-dimensional echocardiograms. (b) Representative M-mode echocardiograms. (c) Left ventricular end-diastole diameter (LVEDd) levels. (d) Left ventricular end-systolic diameter (LVEDs) levels. (e) Inter-ventricular septum end-diastolic thickness (IVSd) levels. (f) Left ventricular end-diastolic posterior wall diameter (LVPWd) levels. (g) Left ventricular ejection fraction (LVEF) levels. (h) Fractional shortening (FS) levels. All the data are expressed as mean ± SEM; n = 5–6 per group. * P < 0.05; ** P <0.01 vs. Control and # P <0.05 vs. DM. Abbreviations: DM, diabetes mellitus; IBN, ibandronate; w, weeks.
The dysfunction of LV systolic and diastolic-related parameters was further confirmed by measuring them using cardiac catheterization at the end of the experimental procedure. The levels of LVSP (92.51 ± 4.28 mmHg vs. 108.53 ± 2.87 mmHg, P < 0.05), MVP (91.10 ± 1.08 mmHg vs. 111.79 ± 1.79 mmHg, P < 0.05) +dp/dtmax (2347.49 ± 45.75 mmHg/s vs. 3422.15 ± 39.04 mmHg/s, P < 0.01), Vpm (329.70 ± 35.91 L/s vs. 1084.46 ± 89.57 L/s, P < 0.01), and Vmax (594.48 ± 37.18 L/s vs. 2818.84 ± 193.69 L/s, P < 0.01) in the DM group decreased significantly as compared to those in the control group, while the levels of LVEDP (4.73 ± 0.23 mmHg vs. 21.63 ± 5.25 mmHg, P < 0.01), LVP (2.46 ± 2.65 mmHg vs. −11.66 ± 1.05 mmHg, P < 0.01), t- dp/dtmax (13.41 ± 0.16 ms vs. 6.83 ± 0.25 ms, P < 0.05), and -dp/dtmax (−2181.19 ± 54.77 mmHg/s vs. −3293.91 ± 126.64 mmHg/s, P < 0.01) increased significantly as compared to those in the control group (). In summary, both the systolic and diastolic dysfunctions were developed and progressed during DCM.
Figure 5. Cardiac hemodynamic results in the three groups at the end of the experimental procedure. (a) Left ventricular systolic pressure (LVSP) levels. (b) Maximum ventricular pressure (MVP) levels. (c) Maximum rate of left ventricular pressure rise during isovolumic systole (+ dp/dtmax) levels. (d) Interval of left ventricle starting to contract to +dp/dtmax (t- dp/dtmax) levels. (e) Left ventricular myocardial contraction component measured maximum shortening speed (Vpm) levels. (f) Shortening speed of left ventricular myocardial contractile component at zero load (Vmax) levels. (g) Left ventricular end-diastolic pressure (LVEDP) levels. (h) Least ventricular pressure (LVP) levels. (i) Maximum rate of left ventricular pressure drop during isovolumic diastole (-dp/dtmax) levels. All the data are expressed as mean ± SEM; n = 5–6 per group. * P < 0.05; ** P <0.01 vs. Control and # P <0.05 vs. DM. Abbreviations: DM, diabetes mellitus; IBN, ibandronate.
Characteristics of aortic pathology in DM rats
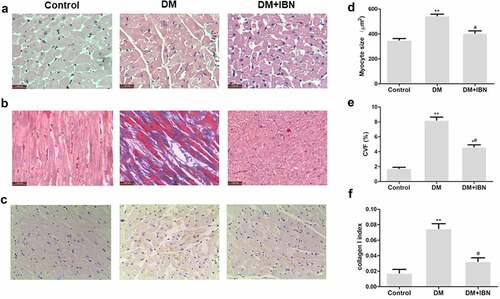
The myocardial tissues in DCM often show myocardial remodeling [Citation8], which was verified by calculating multiple dimensions, including heart weight (HW), the ratio of HW to body weight (HW/BW), and Masson’s trichrome staining. The results indicated that the HW (1535 ± 36 mg vs.1256 ± 25 mg, P < 0.01), and HW/BW (2.91 ± 0.07 mg/g vs. 2.52 ± 0.04 mg/g) were significantly higher in the DM group as compared to the control group (). The DM group rats showed cardiac fibrosis with a destroyed and disorganized structure of the collagen network in the interstitial and perivascular areas (). Both the CVF and collagen I levels were higher in the DM group rats as compared to the control group rats (P < 0.01) ().
Figure 6. Inhibition of farnesyl pyrophosphate synthase (FPPS) by ibandronate (IBN) decreased myocardial hypertrophy and fibrosis. (a) Transverse section of LV stained with H&E (scale bar: 50 μm). (b) Masson trichrome staining (collagen is green and myocardium red; scale bar: 50 μm), showing interstitial fibrosis. (c) Immunohistochemistry analysis, showing collagen I. (d) Morphometric quantification of myocyte size. (e) Quantitative analyses of collagen volume fraction (CVF). (f) Quantitative analyses of collagen I. All the data are expressed as mean ± SEM; n = 5-6 per group. * P < 0.05; ** P <0.01 vs. Control and # P <0.05 vs. DM. Abbreviations: DM, diabetes mellitus.
These results suggested that the DCM rat models were successfully established, showing insulin resistance, severe LV dysfunction, and myocardial remodeling.
Expression levels of FPPS, CTGF, MAPK, and RhoA activity in diabetic rats
The FPPS protein levels in the DM group increased significantly as compared to those in the group (P < 0.01) (). CTGF is considered a useful molecular biomarker for fibrotic response in numerous diseases, including DM, and showed similar results (). Furthermore, the protein levels of p-ERK1/2 and p-p38 MAPK increased significantly (P < 0.05~P < 0.01) (). Finally, the RhoA activity also increased significantly in the DM group ().
Figure 7. Inhibition of farnesyl pyrophosphate synthase (FPPS) by ibandronate (IBN) decreased connective tissue growth factor (CTGF) expression, reversed RhoA, and partly activated mitogen-activated protein kinase (MAPK). (a and c) Representative Western blot bands of FPPS, CTGF, and MAPK. (b and d) Western blot analysis of FPPS, CTGF, p-ERK/ERK, p-p38/p38, and p-JNK/JNK. (e) GTP protease-linked immunosorbent assay (GLISA) analysis of RhoA activity. The ratio of proteins and active RhoA was set to ‘1’ for the control group. All the data are expressed as mean ± SEM; n = 5-6 per group. * P < 0.05; ** P <0.01 vs. Control and # P < 0.05; ## P <0.01 vs. DM. Abbreviations: DM, diabetes mellitus.
IBN Could alleviate lipid metabolism but had no effects on glucose metabolism and general characteristics of DCM
As shown in , after 16 weeks of IBN treatment, the levels of TC and LDL-C in the DM+IBN group were significantly lower as compared to those in the DM group, but the levels of HDL-C, TG, and glucose metabolism remained unchanged throughout the experimental procedure. For the general characteristics, as listed in , the SBP (119.91 ± 4.87 mmHg vs. 121.58 ± 2.86 mmHg), DBP (95.65 ± 5.21 mmHg vs. 97.27 ± 4.94 mmHg), HR (383.56 ± 53.19 beats/min vs. 362.82 ± 38.59 beats/min), urine volume (131.33 ± 3.42 mL/d vs. 130.02 ± 5.23 mL/d), food intake (28.92 ± 0.61 g/d vs. 29.07 ± 0.65 g/d), and water intake (171.44 ± 3.53 mL/d vs. 169.72 ± 1.88 mL/d) in the DM group showed results similar to those in the DM+IBN groups. Therefore, these results suggested that the IBN treatment could lower “bad cholesterol” but had no effects on the general characteristics, glucose metabolism, and other lipid metabolisms.
RhoA/ERK1/2 and RhoA/p38 MAPK pathways might be involved in alleviating the cardiac remodeling and improving cardiac function by IBN in the DCM rat models
In the current study, first, the effects of IBN treatment on alleviating the DCM myocardial remodeling were examined, which are listed in . As compared to the DM group, although HW and HW/BW levels in the DM+IBN group did not reach statistical significance, they showed a decreasing trend. Besides, as shown in , the IBN treatment resulted in alleviating the diabetes-induced histopathological changes in the heart, including the nucleus size and arrangement of cardiomyocytes. In addition, Masson’s trichrome staining and immunohistochemistry analysis demonstrated that the IBN treatment could alleviate collagen fibrosis ( b–). Moreover, the impairment of cardiac structure indicators, including LVEDd, LVEDs, IVSd, and LVPWd, were recovered in the DM+IBN group as compared to those in the DM group after IBN treatment for 12 weeks ( c–4) (P < 0.5). Furthermore, as expected, the protein expression level of CTGF in the DM+IBN group was significantly lower as compared to that in the DM group after treatment with IBN for 16 weeks (P < 0.01) (). Next, the improvement in cardiac function with the recovery of cardiac remodeling was assessed. The ultrasound imaging and hemodynamic findings indicated that the LVEF, FS, LVSP, Vpm, Vmax, and +dp/dtmax in the DM+IBN group improved at the end of the experimental procedure ( g,h, 5a–e) (P < 0.5), which suggested that IBN treatment could improve the LV dysfunction. Furthermore, the increase in the LVEDP, LVP, and -dp/dtmax in the DM+IBN group reconfirmed the beneficial effects of IBN on improving the LV diastolic dysfunction ( g–5). Finally, the results showed that the MAPK pathway was involved in these protective effects of IBN on DCM. As shown in , the FPPS protein expression levels between the DM and DM+IBN groups were similar, and the IBN treatment inhibited the activity of RhoA (). In addition, the ERK1/2 and p38 phosphorylation levels declined after 16 weeks of IBN treatment (P < 0.05~P < 0.01). However, there was no significant difference in JNK phosphorylation between the DM and DM+IBN groups. These results suggested that IBN had no significant effect on the expression of FPPS, but inhibited the activity of FPPS downstream protein RhoA and expression of RhoA downstream ERK1/2 and p38 pathways.
Discussion
The findings of this study are as follows. (1) The lipid metabolism in the DM rats was altered significantly, and the levels of TC and LDL-C instead of levels of HDL, TG, body weight, and glucose metabolism were reduced by the IBN treatment. Furthermore, IBN could also attenuate the pathological features of cardiac remodeling, including the nucleus size, cardiomyocytes arrangement, and cardiac fibrosis. (2) The expression levels of FPPS, CTGF, and MAPK signaling pathway proteins as well as the activity of RhoA increased in the cardiac tissues of the DM rats. (3) Activating the ERK1/2 and p38 could ameliorate the cardiac fibrosis by IBN in the DCM rats.
The biopsies of cardiomyocytes from the DCM patients showed damage to the myocardial tissues, including cardiomyocyte hypertrophy, rupture, apoptosis, and fibrosis [Citation17,Citation18]. The H&E and Masson’s trichrome staining showed that the myocardial cells in the DM group were focally hypertrophic and LV collagen fibers increased significantly. In addition, the LVSd and LVPWd of DM rats were significantly thickened, indirectly showing the cardiac remodeling and myocardial tissue fibrosis in DCM rats. Diastolic dysfunction is an early lesion in DCM [Citation19,Citation20], while the late complication is congestive heart failure (CHF). In the current study, the two cardiac ultrasonography indicators, including LVEF and FS, in combination with hemodynamic indicators, including LVSP, Vpm, Vmax, +dp/dtmax, and t- dp/dtmax, were selected to assess the systolic function in DM rats, while the diastolic function was assessed using the hemodynamic indicators, including LVDP, LVEDP, and -dp/dtmax. The results showed that LVEF and FS decreased slightly after eight weeks of DM onset, and decreased significantly 4 weeks later. The LVEDP determined using invasive hemodynamics was the most direct indicator for LV diastolic function [Citation21]. At the end of an experimental procedure, the LVDP, LVEDP, and -dp/dtmax were significantly higher in the DM group as compared to the control group. Taken together, these findings indicated the successful establishment of DCM rat models.
This study found that IBN could not affect the general characteristics of DM rats. Some of these results are similar to those of the previous studies. Li and her colleagues demonstrated that alendronate did not affect SBP, DBP, and HR in the SHR [Citation22]. Numerous studies showed that IBN did not affect the body weight as well as renal and liver function of the rat models. The possible reason was that IBN could not inhibit any cytochrome P450 (CYP) enzymes in-vivo, such as CYP1A2, CYP2A6, CYP2C9, CYP2C19, CYP2D6, CYP2E1, and CYP3A4 [Citation23,Citation24].
FPPS is a key enzyme in the mevalonate pathway. Due to the recent studies, reporting the specific FPPS inhibitors, such as IBN, alendronate (ALN), and etidronate (ETI), the role of FPPS in cardiovascular disease (CVD) has gradually attracted the attention of researchers [Citation4,Citation8]. Recent studies reported that ALN could attenuate cardiac hypertrophy and fibrosis by inhibiting the FPPS [Citation22]. Another recent study suggested that some enzymes, including FPPS of the mevalonate pathway, were upregulated in the aortic media taken from the DM mice [Citation25,Citation26]. However, they did not further highlight the role of FPPS, especially in the DCM animals. The present study demonstrated that the FPPS level increased in the myocardial tissues of DM rats, which could be possibly inhibited by IBN, resulting in a decrease in fibrosis. In summary, these results indicated that FPPS might play an important role in the cardiac remodeling in DM rats.
MAPK family is a type of serine/threonine-protein kinase regulator, which is widely present in vertebrates. It consists of three isoforms of ERK, p38, and JNK and is one of the most important biological signaling networks in eukaryotes as well as regarded as an important signal system, mediating stimuli between intracellular and extracellular spaces [Citation27–29]. Early studies established that MAPK was one of the main signaling pathways involved in (CVD complications of diabetes [Citation30,Citation31]. Numerous factors could activate the p38 MAPK and ERK1/2 signaling pathways in DM, thereby confirming an important regulatory role in cardiac remodeling in DM animal models [Citation32–35]. In this study, as shown in , the protein levels of p-ERK1/2, p-p38, and p-JNK in the DM group were both higher as compared to the control group, which were reduced by IBN treatment except that of p-JNK. These results indicated that ERK1/2 and p38 MAPK signaling pathways might be involved in the FPPS-mediated cardiac fibrosis in DCM rats.
Small GTPases are expressed in most of the cells, including fibroblasts and cardiomyocytes. A study reported that hyperglycemia could stimulate small GTPases, which could contribute to the proliferation of cardiomyocytes [Citation36]. For instance, the hyperglycemia-stimulated growth and gene expression profile of cardiomyocytes might occur through RhoA and Rho-kinase in the DCM tissues [Citation37]. Meanwhile, numerous studies indicated that GTPases were also involved in the regulation of cardiac function in DM. A study showed that RhoA activity increased significantly in the DCM tissues, mediating myocardial contraction and diastolic dysfunction [Citation38]. In addition, RhoA played a central role in signal transduction pathways, which responded to a variety of extracellular stimuli, such as cytokines, peptide growth factors, and hormones. RhoA was reported to activate three distinct MAPK cascades, including ERK, JNK, and p38 via Raf-1 [Citation39]. The present study showed that the myocardial RhoA activity as well as p- ERK1/2 and p-p38 increased in the DM rats; however, the IBN treatment could alleviate this increase. FPPS can catalyze isopentenyl pyrophosphate (IPP) and GPP to form FPP, which activates numerous small GTPases, including RhoA. Based on these findings, this study suggested that IBN might exert its inhibitory effects on myocardial tissue remodeling by suppressing the RhoA/ERK1/2 and RhoA/p38 MAPK pathways in DCM. However, the specific in-depth underlying mechanisms require further investigations.
In conclusion, the present study demonstrated for the first time that the upregulation of FPPS expression might be involved in diabetic myocardial remodeling in DM. In addition, IBN might exert its inhibitory effects on myocardial tissue remodeling by suppressing the RhoA/ERK1/2 and RhoA/p38 MAPK pathways in DCM.
Availability of data
The data that support the findings of this study are available from the corresponding author, Changqing Du, upon reasonable request.
Acknowledgements
The authors would like to thank all the reviewers who participated in the review, as well as MJEditor (www.mjeditor.com) for providing English editing services during the preparation of this manuscript.
Disclosure statement
No potential conflict of interest was reported by the author(s).
Additional information
Funding
References
- Hamby RI, Zoneraich S, Sherman L. Diabetic cardiomyopathy. JAMA. 1974;229(13):1749–1754.
- Paolillo S, Marsico F, Prastaro M, et al. Diabetic cardiomyopathy: definition, diagnosis, and therapeutic implications. Heart Fail Clin. 2019;15(3):341–347. DOI:10.1016/j.hfc.2019.02.003
- Alonso N, Moliner P, Mauricio D, et al. Clinical features and treatment of diabetic cardiomyopathy. Adv Exp Med Biol. 2018; 1067.197–217. DOI:10.1007/5584_2017_105
- Liu XW, Jin H-F, Du C-Q, et al. Farnesyl pyrophosphate synthase blocker ibandronate reduces thoracic aortic fibrosis in diabetic rats. Am J Med Sci. 2019;357(4):323–332. DOI:10.1016/j.amjms.2019.01.014
- Yang J, Zhu H-H, Chen G-P, et al. Inhibition of farnesyl pyrophosphate synthase attenuates angiotensin II-induced cardiac hypertrophy and fibrosis in vivo. Int J Biochem Cell Biol. 2013;45(3):657–666. DOI:10.1016/j.biocel.2012.12.016
- Tang H, Xue G. Major physiological signaling pathways in the regulation of cell proliferation and survival. Handb Exp Pharmacol. 2018;249:13–30.
- Turner NA, Blythe NM. Cardiac fibroblast p38 MAPK: a critical regulator of myocardial remodeling. J Cardiovasc Dev Dis. 2019;6(3):27.
- Liao HH, Zhang N, Meng Y-Y, et al. Myricetin alleviates pathological cardiac hypertrophy via TRAF6/TAK1/MAPK and Nrf2 signaling pathway. Oxid Med Cell Longev. 2019;2019:6304058.
- Du CQ, Yang L, Yang J, et al. Inhibition of farnesyl pyrophosphate synthase prevents norepinephrine–induced fibrotic responses in vascular smooth muscle cells from spontaneously hypertensive rats. Hypertens Res. 2014;37(1):26–34. DOI:10.1038/hr.2013.96
- Ti Y, Xie G-L, Wang Z-H, et al. TRB3 gene silencing alleviates diabetic cardiomyopathy in a type 2 diabetic rat model. Diabetes. 2011;60(11):2963–2974. DOI:10.2337/db11-0549
- Kanda T, Hayashi K, Wakino S, et al. Role of Rho-kinase and p27 in angiotensin II–induced vascular injury. Hypertension. 2005;45(4):724–729. DOI:10.1161/01.HYP.0000153316.59262.79
- Nagueh SF, Smiseth OA, Appleton CP, et al. Recommendations for the evaluation of left ventricular diastolic function by echocardiography: an update from the American society of echocardiography and the European association of cardiovascular imaging. J Am Soc Echocardiogr. 2016;29(4):277–314. DOI:10.1016/j.echo.2016.01.011
- Sun M, Chen M, Dawood F, et al. Tumor necrosis factor-α mediates cardiac remodeling and ventricular dysfunction after pressure overload state. Circulation. 2007;115(11):1398–1407. DOI:10.1161/CIRCULATIONAHA.106.643585
- 2. Classification and diagnosis of diabetes: standards of medical care in diabetes-2021. Diabetes Care. 2021;44(Suppl 1):S15–33. DOI:10.2337/dc21-S002
- Kane JP, Pullinger CR, Goldfine ID, et al. Dyslipidemia and diabetes mellitus: role of lipoprotein species and interrelated pathways of lipid metabolism in diabetes mellitus. Curr Opin Pharmacol. 2021;61:21–27.
- Kryzhanovskii SA, Kolik LG, Tsorin IB, et al. Evidence of echocardiography validity in model experiments on small animals. Bull Exp Biol Med. 2016;161(3):434–438. DOI:10.1007/s10517-016-3432-0
- Jia G, Hill MA, Sowers JR. Diabetic cardiomyopathy: an update of mechanisms contributing to this clinical entity. Circ Res. 2018;122(4):624–638.
- Hu X, Bai T, Xu Z, et al. Pathophysiological fundamentals of diabetic cardiomyopathy. Compr Physiol. 2017;7(2):693–711.
- Dillmann WH. Diabetic cardiomyopathy. Circ Res. 2019;124(8):1160–1162.
- Gulsin GS, Athithan L, McCann GP. Diabetic cardiomyopathy: prevalence, determinants and potential treatments. Ther Adv Endocrinol Metab. 2019;10:2042018819834869.
- Mascherbauer J, Zotter-Tufaro C, Duca F, et al. Wedge pressure rather than left ventricular end-diastolic pressure predicts outcome in heart failure with preserved ejection fraction. JACC Heart Fail. 2017;5(11):795–801. DOI:10.1016/j.jchf.2017.08.005
- Li L, Chen G-P, Yang Y, et al. Chronic inhibition of farnesyl pyrophosphate synthase attenuates cardiac hypertrophy and fibrosis in spontaneously hypertensive rats. Biochem Pharmacol. 2010;79(3):399–406. DOI:10.1016/j.bcp.2009.08.033
- Guanabens N, Monegal A, Cerdá D, et al. Randomized trial comparing monthly ibandronate and weekly alendronate for osteoporosis in patients with primary biliary cirrhosis. Hepatology. 2013;58(6):2070–2078. DOI:10.1002/hep.26466
- Keating GM. Ibandronate: a review in Japanese patients with osteoporosis. Drugs Aging. 2016;33(4):295–303.
- Chen GP, Zhang X-Q, Wu T, et al. Alteration of mevalonate pathway in proliferated vascular smooth muscle from diabetic mice: possible role in high-glucose-induced atherogenic process. J Diabetes Res. 2015;2015:379287.
- Li Z, Zhang J, Wang M, et al. Expression of farnesyl pyrophosphate synthase is increased in diabetic cardiomyopathy. Cell Biol Int. 2021;45(7):1393–1403. DOI:10.1002/cbin.11573
- Liang YJ, Yang WX. Kinesins in MAPK cascade: how kinesin motors are involved in the MAPK pathway? Gene. 2019;684:1–9.
- Wagner EF, Nebreda AR. Signal integration by JNK and p38 MAPK pathways in cancer development. Nat Rev Cancer. 2009;9(8):537–549.
- Cargnello M, Roux PP. Activation and function of the MAPKs and their substrates, the MAPK-activated protein kinases. Microbiol Mol Biol Rev. 2011;75(1):50–83.
- Papakrivopoulou J, E Lindahl G, E Bishop J, et al. Differential roles of extracellular signal-regulated kinase 1/2 and p38mapk in mechanical load-induced procollagen alpha1(i) gene expression in cardiac fibroblasts. Cardiovasc Res. 2004;61(4):736–744. DOI:10.1016/j.cardiores.2003.12.018
- Tomlinson DR. Mitogen-activated protein kinases as glucose transducers for diabetic complications. Diabetologia. 1999;42(11):1271–1281.
- Ehrig JC, Afroze SH, Reyes M, et al. A p38 mitogen-activated protein kinase inhibitor attenuates cardiotonic steroids-induced apoptotic and stress signaling in a Sw-71 cytotrophoblast cell line. Placenta. 2015;36(11):1276–1282. DOI:10.1016/j.placenta.2015.08.016
- Zhuo J, Zeng Q, Cai D, et al. Evaluation of type 2 diabetic mellitus animal models via interactions between insulin and mitogen‑activated protein kinase signaling pathways induced by a high fat and sugar diet and streptozotocin. Mol Med Rep. 2018;17(4):5132–5142. DOI:10.3892/mmr.2018.8504
- Tang M, Zhang W, Lin H, et al. High glucose promotes the production of collagen types I and III by cardiac fibroblasts through a pathway dependent on extracellular-signal-regulated kinase 1/2. Mol Cell Biochem. 2007;301(1–2):109–114. DOI:10.1007/s11010-006-9401-6
- Dai B, Cui M, Zhu M, et al. STAT1/3 and ERK1/2 synergistically regulate cardiac fibrosis induced by high glucose. Cell Physiol Biochem. 2013;32(4):960–971. DOI:10.1159/000354499
- Flentje A, Kalsi R, Monahan TS. Small GTPases and their role in vascular disease. Int J Mol Sci. 2019;20(4):917.
- Ishiko K, Sakoda T, Akagami T, et al. Hyperglycemia induced cell growth and gene expression via the serum response element through RhoA and Rho-kinase in vascular smooth muscle cells. Prep Biochem Biotechnol. 2010;40(2):139–151. DOI:10.1080/10826060903558927
- Tang J, KUSAKA I, MASSEY AR, et al. Increased RhoA translocation in aorta of diabetic rats. Acta Pharmacol Sin. 2006;27(5):543–548. DOI:10.1111/j.1745-7254.2006.00325.x
- Cheng CI, Lee Y-H, Chen P-H, et al. Cobalt chloride induces RhoA/ROCK activation and remodeling effect in H9c2 cardiomyoblasts: involvement of PI3K/Akt and MAPK pathways. Cell Signal. 2017;36:25–33.