
ABSTRACT
Colorectal cancer (CRC) becomes the second leading cause of cancer-related deaths in 2020. Emerging studies have indicated that microRNAs (miRNAs) play a key role in tumorigenesis and progression. The dysfunctions of miR-455-3p are observed in many cancers. However, its biological function in CRC remains to be confirmed. By sequencing serum sample, miR-455-3p was found to be up-regulated in CRC patients. RT-qPCR demonstrated that the miR-455-3p expression was both higher in the serum and tumor tissues of CRC patients. Furthermore, it indicated that miR-455-3p had the ability in promoting cell proliferation, suppressing cell apoptosis, and stimulating cell migration. In vivo experiments also showed that miR-455-3p promoted tumor growth. Additionally, H2AFZ was proved as the direct gene target of miR-455-3p by dual-luciferase assay. Taken together, miR-455-3p functioned as a tumor promoter in CRC development by regulating H2AFZ directly. Thus, it has enormous potential as a biomarker in the diagnosis of CRC.
KEYWORDS:
1. Introduction
Colorectal cancer (CRC) is a common type of digestive system cancer. Every year, approximately 2 million new CRC cases are reported in the world [Citation1] which prompts CRC to become the second leading cause of cancer-related deaths in 2020, with a 9.4% mortality rate [Citation2]. The GLOBOCAN 2020 database recorded that the incidence of CRC is up to 10.6% in Asia [Citation2]. In 2020, it was estimated that CRC has ranked second in cancer-related deaths in Europe, with nearly 520 000 new cases and 245 000 deaths [Citation3]. However, CRC incidence and mortality have decreased in European and northern American countries; conversely, the rates increased in China [Citation3]. In China, CRC incidence became the fourth, with a 9.88% incidence in 2015 [Citation4]. In 2020, CRC cases in China were 28.8% (555,477/1931,590) of the world, and CRC-associated deaths rate was as high as 30.6% (286,162/935,173) of the world [Citation5]. The current situation of CRC is caused by the limitations in understanding CRC tumorigenesis and development [Citation6–8]. The introduction of new screening and therapy methods has extended the CRC patient survival time [Citation9–11]. However, despite these improvements, most patients are still under the threat of CRC [Citation12]. This has prompted research to uncover the molecular mechanisms of CRC [Citation13–15]. However, some problems such as low specificity, invasion, and suffering still exist [Citation16–18]. There is a need to identify biomarkers that can better predict the clinical outcome and inform novel therapeutic strategies in increasingly personalized cancer care. Additional molecular biomarkers of CRC may be helpful in the diagnosis and assessment of prognosis [Citation7,Citation8,Citation19–21].
The ongoing studies on microRNAs (miRNAs) revealed that miRNAs are vital for the occurrence and development of tumors [Citation22–25]. miRNAs are non-coding, endogenous small RNAs that range from 19 to 25 nucleotides in length. They are highly conserved and are the key regulators in post-transcriptional gene regulation [Citation26–28]. They influence the messenger RNA (mRNA) level or the protein level usually by binding with the 3’-untranslated region (UTR) of the mRNA to trigger the decomposition of mRNA or obstruct the translation of mRNA to interfere with translation [Citation29–31]. miRNAs participate in many life processes such as development, cell differentiation, cell cycle progression, and cell apoptosis [Citation26,Citation31–33]. Newer functions of miRNAs have been reported recently. Bridget et al. found that miRNAs play a significant role in amyotrophic lateral sclerosis [Citation33]. Masako et al. observed that miRNA was involved in neurological disorders [Citation34]. In addition, previous studies demonstrated that the expression profile of miRNAs in cancer cells was significantly different from that in the normal cells [Citation30]. Therefore, it can be speculated that miRNAs may be associated with the occurrence and development of tumors. miRNAs are consistent with traditional tumor suppressor genes and proto-oncogenes to some extent [Citation30,Citation32,Citation35,Citation36]. They are reported to regulate tumor proliferation, metastasis, and invasion and even lead to corresponding tumor apoptosis and differentiation [Citation37–42]. Yong et al. said that miR-17-5p regulated epithelial-mesenchymal transition (EMT) by targeting vimentin in CRC [Citation43]. Cheng et al. proved that miR-195 promoted an invasive phenotype in oral cancer [Citation44]. Currently, only 400 miRNAs have been annotated [Citation45,Citation46]. In some studies, miR-455-3p was observed to be related to the progression of cancers, including osteosarcoma, breast cancer, and pancreatic cancer [Citation47–49]. In these studies, miR-455-3p was speculated as a tumor suppressor, which could affect tumor formation. In CRC, Zheng et al. reported that miR-455-3p was downregulated in the HCT116 cells [Citation50]. However, in patients with infiltrating carcinoma or lymph node metastasis of breast cancer, the serum miR-455-3p levels were elevated [Citation51]. Due to the unstable miRNA expression pattern, the miRNA needs to be detected carefully. Moreover, only 400 miRNAs have been annotated. Numerous miRNAs have unknown biological functions. It needs to be investigated that more miRNAs should be uncovered and their biological functions should be proved.
In this study, the miRNAs expression profiles in the serum of CRC patients and that in the healthy individual were sequenced and analyzed. Several candidate miRNAs that were up-regulated in CRC patients were further verified for the expression pattern in the clinical samples. miR-455-3p was found to be up-regulated in the serum of CRC patients compared with that in the healthy samples. Furthermore, a series of experiments demonstrated that miR-455-3p promoted CRC cell growth and invasion while inhibiting cell apoptosis. All the phenotype was accomplished by directly targeting H2AFZ, a highly conserved variant of H2A, which served as a key regulator in cancer. Thus, miR-455-3p can act as a new unique biomarker for the diagnosis of CRC patients. Also, it may be a potential target for the treatment of CRC.
2. Materials and methods
2.1. Specimens and samples
Informed consent was signed by involved volunteers. All patients were sampled before any treatment. From 2018 to 2020, 10 mL of blood was collected from individuals reporting in the Shenzhen Second People’s Hospital (Shenzhen, China). The evacuated tube with anticoagulant was employed to sample peripheral venous blood. The blood samples were collected and mixed with anticoagulant by shaking, then, stored at 4°C for a while. The whole blood was centrifuged at 1 000 × g at 4°C for 10 min. The supernatants were transferred into 1.5 mL DNase/RNase-free tube and stored at −80°C until further use. For the validation study, cancer tissues and 5-cm adjacent tissues were sampled from the CRC patients by a surgical operation before any treatment and immediately frozen at −80°C until use.
2.2. Cell lines
The FHC (human standard epithelial cell line) and HCT116 (colorectal carcinoma cell line) cell lines were purchased from the American Type Culture Collection (ATCC, USA). DLD-1 (colorectal carcinoma cell line) cells were acquired from the Cell Bank, China Academy of Science (Shanghai, China). Cells were cultured in a suitable medium (Gibco, USA) supplemented with 10% fetal bovine serum (FBS) (Gibco) and incubated with 5% CO2 at 37°C.
2.3. miRNA expression and sequencing
Equal volumes of serum from five healthy controls and five CRC patients were used for sequencing miRNAs expression by high-throughput BGISEQ-500 (Beijing Genomics Institute, China). The data were analyzed by the BGI workflow to find out which miRNAs were high expression in CRC patient serum.
2.4. miRNA extraction and reverse transcription
Initially, 400 µL of serum was thawed at 4°C and used for miRNA extraction. Then, 1 mL lysis buffer (QIAGEN, Germany) was added to the serum and mixed thoroughly. Further, 3.5 μL of the external reference cel-miR-39 (Cel-39) (1 nM) was added to the lysis solution. Next, following the manufacturer’s instructions, total miRNAs were extracted from the serum by using the miRNA extraction kit (QIAGEN, Germany). Finally, the miRNAs were eluted from the columns with 14 µL of DNase/RNase-free water.
Tumor tissues and 5-cm adjacent tissues were cut into small pieces and were prepared for miRNA extraction. Then, 1 mL of the TRIzol lysis buffer (RNAiso for Small RNA) (TAKARA Bio, Japan) was mixed with the tissued pieces for 5 mins Then, the miRNAs were extracted according to the extraction protocol. Then, the extraction miRNAs were resuspended in 20 µL of DNase/RNase-free water. 0.5 μL DNase I (TAKARA Bio, Japan) was added to remove genomic DNA, incubating at 30°C for 30 min. After that, 1 µL 0.5 M EDTA was added into the mixture, incubating at 80°C for 2 min to inactivate the DNase I. The miRNAs in cells were extracted in the same way. The extraction method of miRNAs in cells was the same as that in tissues.
The concentration of the miRNAs was quantified using the NanoDrop 2 000 spectrophotometer (Thermo Scientific, USA). Around 200 ng of the miRNAs were reverse-transcribed into cDNA using the TaqMan MicroRNA Reverse Transcription Kit (TAKARA Bio, Japan) according to the manufacturer’s protocol.
2.5. RNA extraction and reverse transcription
Cells or tissues were harvested and lysed with 1 mL of the TRIzol lysis buffer (Ambion, USA) and incubated at room temperature for 5 min. Next, the RNA was extracted following the manufacturers’ instructions. Finally, RNAs were resuspended in 20 µL of DNase/RNase-free water. All RNA concentrations were quantified by NanoDrop 2 000 spectrophotometer. Then, 500 ng of RNAs were reverse-transcribed into cDNA using a cDNA synthesis kit (Beyotime Biotechnology, China). All protocols were carried out following the manufacturers’ instructions.
2.6. RT-qPCR (real time quantitative PCR)
After reverse transcription, complementary DNA (cDNA) was averaged for each reaction for RT-qPCR. The reactions were performed by using the 2 × SBGR Master Mix (Biomiga, USA) following the manufacturer’s protocol. All reactions were run in triplicates on the Applied Biosystems 7500 Fast Real-Time PCR System (USA). Small nuclear RNA U6 (U6) and glyceraldehyde-3-phosphate dehydrogenase (GAPDH) were used as the internal references for miRNA and RNA detection in cell or tissue samples, respectively. Cel-39 was the external reference to measure miRNA expression in serum sample. The Ct values were detected by the instrument. The relative expression levels of the target miRNA were calculated by 2–ΔCt in the serum and 2 –ΔΔCt in tissues or cell samples, respectively. ΔCt= CtmiR-target-Ctinternal reference. ΔΔCt= (CtmiR-target-Ctinternal reference) cancer-(CtmiR-target-Ctinternal reference) adjacent. Each serum was sampled from different individuals. So, the result was calculated by 2–ΔCt. However, each pair of tissue was taken from the same patient. Thus, the conclusion was presented by 2 –ΔΔCt.
2.7. Clinical analysis
Using the mean of miR-455-3p expression in CRC patient serum value as a divided value. The patients were divided into two groups with high and low expression pattern. According to each clinical feature, patients were grouped, and the number of patients in each group was calculated. A T-test was used for the determination.
2.8. Primers
During the miRNA reverse transcription processing, a specific sequence was added to the cDNA 3’ tail. Thus, the 3’ primers of all target miRNAs were obtained from the TaqMan MiRNA Reverse Transcription Kit. The 5’ miRNAs primers were designed by the miRNA sequences. miR-455-3p primer sequences are shown in . The primer sequences for other candidate miRNAs are listed in Supplementary . U6 primers were obtained from the previous study on miRNA quantification (), and used as the internal reference for miRNA quantification in cells or tissue samples. Cel-39 was the external reference for miRNA quantification in serum samples. GAPDH was used as the internal reference for RNA quantification. All primers of reference genes are shown in . Primers of the target gene, H2AFZ, are listed in . The sequence of the control (NC) 5’ primer which was used for the in vivo assay is shown in , too.
Table 1. Primers for RT-qPCR.
2.9. Transfection
Human miR-455-3p mimics, inhibitors, and negative control (mimics-NC and inhibitor-NC) were synthesized by GenePharma (China) (sequences are shown in ). H2AFZ mutant plasmids and wild-type plasmids (for dual-luciferase report assay) were constructed by GENEWIZ (China) (sequences were shown in Supplementary ). Cells were seeded for 12 h before transfection. Next, the cell medium was replaced by the serum-free medium. RNAs, plasmids, or both were mixed with serum-free medium, incubating for 5 min at room temperature. The transfection reagent (Lipofectamine 3000, Thermo Fisher) was diluted by serum-free medium and incubated for 5 min at room temperature. Then, the reagents were mixed and incubated for 15 min. Later, the mixture was added to the cell medium. After 24 h, the culturing medium was replaced with a medium with 10% FBS. Cells transfected with RNA or plasmids were employed for the other assay.
Table 2. Synthesized RNA for transfection.
2.10. Cell viability assay
Cells transfected with RNAs or plasmids continued to be cultured. Later, 10 µL of CCK-8 solution was added and incubated at 37°C for 2 h. The optical density was measured at 450 nm using a microplate reader (Tecan, Switzerland). In the assay of miR-455-3p improving cell viability, the mimics-NC group was used as the reference of the mimics group; the inhibitor-NC group was used as the reference of the inhibitor group. All data were normalized with corresponding reference groups.
2.11. Colony formation assay
Colon cancer cells were plated in a 6-well plate and transfected with synthesized RNA. After transfection, the cells were digested and re-seeded in a fresh 6-well plate, 1 000 cells per well. Culturing until the colonies form (7–9 days). The colonies were washed with phosphate-buffered saline (PBS), then, fixed with methanol for 40 min. After that, the samples were washed with PBS again and incubated with crystal violet to stain the colonies for 15 min in the dark. Excess crystal violet was removed with PBS. The colonies were then photographed and counted one by one to calculate the numbers.
2.12. Cell apoptosis assay
After being transfected with RNAs for 48 h, the culture medium and the transfected cells were harvested by digestion and centrifugation at 3 000 rpm for 5 min. Further, the cells were resuspended and washed twice with pre-cooled PBS to reduce medium interference. Later, 500 µL of the binding buffer (Yeasen, China) was added, followed by staining with Annexin Fluorescein isothiocyanate (FITC) and propidium iodide (PI) according to the manufacturer’s instructions (Yeasen, China). In the dark, the cells were stained for 20 min. Finally, using a flow cytometer (BECKMAN, USA) to detect cell apoptosis. The cells without transfected were used as blank to reduce the background. Cells stained with only one color were used to control the threshold. Cells in experimental groups were detected and analyzed. The rate of apoptosis cell was analyzed and presented by a bar chart.
2.13. Cell migration assay
The Transwell assay aimed to measure the ability of cell migration. In the lower chamber, 700 µL of the Roswell Park Memorial Institute 1640 (RPMI 1640) medium containing 20% FBS was added to the 24-well plates. Then, 8-µm of pore-size culture inserts (BD Falcon, USA) were positioned into it. Post transfection, the cells were digested and resuspended in the FBS-free medium. The same quantity of cells (60 000 cells/chamber) with different treatments was placed into 8-µm of pore-size culture inserts (upper chamber). After 48 h, the chambers were taken out. Washing and staining like treatment with colonies. Then, the cells grown in the upper chamber were erased; the cells migrating into the lower chamber were photographed using an inverted microscope (×200) (Leica, Germany) and counted by Image J.
2.14. Prediction target gene
To find out miR-455-3p target genes, databases, like TargetScan, starBase, miRWalk, and mirDIP, were used to predict its target genes. The intersection of four groups was used as candidate genes. The intersection was further analyzed by STRING to know the protein-protein interaction. The GO and KEGG pathway were intended to predict the function of genes. The purpose of the above analysis was to discover miR-455-3p target genes.
2.15. Dual-luciferase reporter assay
The potential binding sites (in H2AFZ) of miR-455-3p were predicted by TargetScan. Two sequences of H2AFZ were synthesized separately (see Supplementary ): one segment contained the potential binding sites in the middle, and the other segment with the mutant sites was used as the control. These segments were constructed into the pmirGLO plasmid, respectively (GENEWIZ Company, China). The vector information is shown in S1. After transfecting for 48 h, the cells were treated with 100 μL of the Luciferase Assay Reagent II (Promega, USA). Firefly luciferase activities were analyzed by the microplate reader (TECAN). Immediately, the Stop & Glo® Reagent was added to terminate the luciferase activity, next, the Renilla luciferase reporter activity was recorded. The data were presented for Firefly luciferase reads/Renilla luciferase reads to reduce the error caused by plasmid quantity. Furthermore, the experimental group was normalized by the control group, and the data were presented by relative luciferase activity.
2.16. Restore assay
The plasmids for overexpression of H2AFZ and control plasmids were constructed by GENEWIZ (sequences were shown in Supplementary ). pcDNA3.1(+) was used as the plasmid backbone for construction. The plasmids that could increase H2AFZ expression level were transfected into the cells to observe cell proliferation, apoptosis and migration. The mimics and H2AFZ plasmids were both transfected into cells to observe the phenotype, including cell proliferation, apoptosis and migration. Data analysis was the same as described above.
Table 3. Relationship between miR-455-3p expression and clinicopathological parameters of 34 CRC patients.
2.17. Western blot analysis
Cells treated with transfection were collected and lysed by the Radio-Immunoprecipitation Assay (RIPA) Lysis Buffer (Beyotime Biotechnology, China). The total protein was extracted by centrifuging the lysate at 14,000 × g for 10 min at 4°C. Later, protein denaturation was carried out. 20 µg of the protein was loaded into the channel for western blotting. The primary antibodies for vimentin, snail, cleaved caspase 3, cleaved caspase 7, and H2AFZ were purchased from Cell Science Technology (USA). The primary antibodies were diluted 1 000 for use. The β-actin primary antibody (1: 1 000 dilution) and all secondary antibodies (1: 5 000 dilution) were acquired from Beyotime Biotechnology (China). Western blot results were photographed by TANON. The analysis was further performed by Image J.
2.18. In vivo tumorigenicity
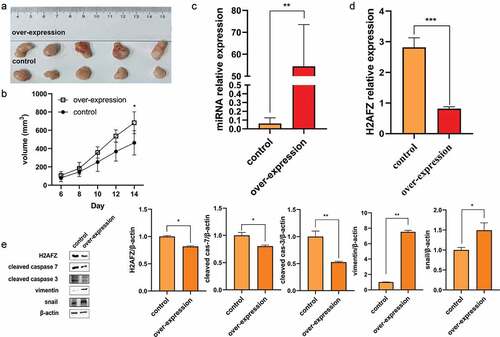
Stably overexpressing miR-455-3p lentiviruses were created by GENEWIZ (China). Lentiviruses were used to infect the HCT116 cells to acquire the stably overexpressing miR-455-3p cells. The cells infected with lentiviruses with NC sequence served as the control. Nude mice for assay were purchased from the Guangdong Medical Laboratory Animal Center: all were male BALB/c-nu/nu (4 weeks). The HCT116 cells stably overexpression miR-455-3p and NC were injected subcutaneously into the nude mice (5 mice per group, respectively). The tumor size was measured every alternate day. The tumor volume was calculated as length× width× width/2. Finally, the mice were sacrificed by cervical dislocation on the 14th day. The tumors were separated and frozen at −80°C until used. All experimental procedures were approved by the Animal Ethics Committee of Tsinghua University.
2.19. Statistical analysis
Statistical analysis was carried out using GraphPad Prism 8 for Windows. Photos were analyzed by Image J. All measurements or variables were shown as mean ±SD. All bar charts were shown as mean±SD in three independent experiments. The values were compared using Student’s t-test between groups. The area under the receiver operating characteristic curves (AUC) was used to estimate the detection of miR-455-3p in clinical serum samples.
3. Results
3.1. miR-455-3p was significantly upregulated in CRC
For initial screening, the miRNA expression profiles in the serum were sequenced. The miRNA concentration in the serum was presented as a copy number (Supplementary ). Sequencing data () showed that 11 miRNAs were significantly highly expressed in the serum of CRC patients.
Figure 1. MiRnas expression pattern in the different cohorts. (A) Relative high expression miRnas in CRC patient serum by sequencing. Relative expression was calculated by log2Ratio (miRNA reads in patient/miRNA reads in volunteer). Relative expression > 2-fold indicated overexpression, 5 pairs of serum samples were detected. (B) MiR-455-3p expression pattern in patient serum and control serum. Thirty-six pairs of serum samples were tested. (C) Receiver Operating Characteristic (ROC) curve of serum miR-455-3p expression pattern. (D) MiR-455-3p expression in patient tissues and adjacent tissues. Seventy-three pairs of tissue samples were detected. (E) H2AFZ expression in patient tissues and adjacent tissues. Sixteen pairs of tissue samples were used to test. Data were shown as the mean ± SD. *P < 0.05, **p<0.01, *** P < 0.001 and ****p<0.0001 vs the control group. All graphs were the average of three independent experiments.
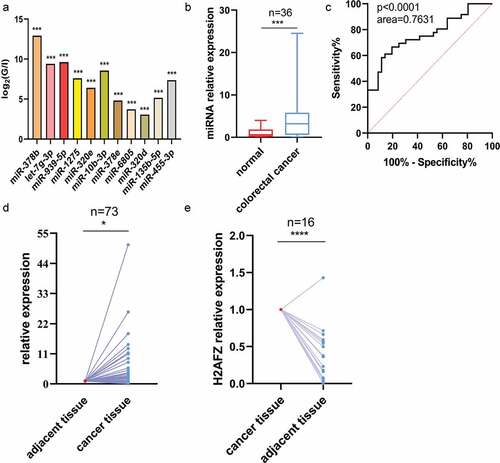
Table 4. Relationship between miR-455-3p expression and clinicopathological parameters of 73 CRC patients.
In the second stage, the miRNA expression of these 11 candidates was measured from serum samples of 35 CRC patients and 35 healthy volunteers by RT-qPCR. Cel-39 was the external reference for normalizing the RT-qPCR data. The result showed that only miR-455-3p increased its expression level in the serum of patients (), which was consistent with the sequencing results. The expression pattern of other miRNAs in the serum are shown in Figure S2 (30 pairs of samples were measured in each miRNA expression assay). The ROC curve was analyzed to assess the diagnostic value for detecting the CRC and healthy samples. The AUC of miR-455-3p was 0.7631, and the p-value was less than 0.0001 (). It was speculated that serum miRNA-455-3p could function as a biomarker for CRC diagnosis. For further validation of the differential expression of miR-455-3p, the tumor tissues and 5-cm adjacent tissues were collected from the hospital patients. miRNAs were extracted and analyzed by RT-qPCR assay. It indicated that the miR-455-3p expression pattern was stable, and highly expressed in cancer tissues (). Given the phenotype, it was reliable that miR-455-3p could be a new indicator for CRC diagnosis. For further understanding of the relationship between miR-455-3p and clinical characteristics, clinical analyses were carried out. Due to the loss of 2 patients’ information, 34 patients were statistically analyzed. The observation showed that the expression levels of serum miR-455-3p were significantly associated with degree of lymph nodes metastasis (p = 0.028), while patients gender, ageand distant metastasis weren’t related to serum miR-455-3p expression level (). The detail can be seen in supplementary Table S5. miR-455-3p expression level in tissue sample was associated with clinical characteristics. shows that the miR-455-3p expression level wasn’t related to patient gender and age (details seen in supplementary table S6). However, it was involved with a degree of lymph nodes metastasis (p = 0.001) and metastasis(p = 0.013). The result meant that miR-455-3p could be an indicator to determine the CRC stage. All evidence showed that miR-455-3p was significantly up-regulated in CRC and could function as a potential biomarker to discriminate between CRC and control samples. Also, the conclusion meant that miR-455-3p might be like an oncogene, influencing the occurrence and development of colorectal cancer.
3.2. miR-455-3p promoted colon cancer cell growth
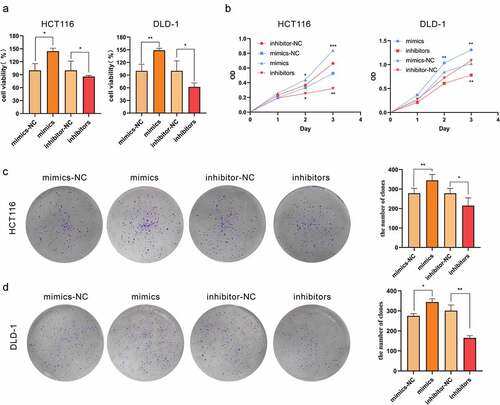
In the serum and tissues of CRC patients, miR-455-3p was significantly upregulated, indicating a probable oncogenic role of miR-455-3p in promoting tumor development and progression. To explore the potential biological functions of miR-455-3p, its mimics, inhibitor, mimics-NC, and inhibitor-NC were transfected separately into the colon cancer cells. The miRNAs were extracted from the transfected cells. RT-qPCR was carried out to confirm the successful transfection of RNAs. miR-455-3p was highly expressed in the mimics group versus its corresponding control group (Figure S3). The inhibitor group showed a significant decrease in miR-455-3p expression (S3).The results demonstrated that the synthesis RNAs were capable of controlling miR-455-3p concentration in the cells. In addition, the upregulation of miR-455-3p expression promoted cell proliferation of the investigated cell lines (). In contrast, cells lines transfected with the inhibitors displayed significantly reduced proliferation ability (). Furthermore, cell proliferation increased more quickly with time in the mimics group than that in the mimics-NC group (). For further validation, the colony-forming assay was conducted, and it confirmed that more miR-455-3p significantly boosted cell colony formation and cell growth rate (). Above all, miR-455-3p was associated with cell proliferation, which indicated that miR-455-3p served as an oncogene during tumorigenesis.
Figure 2. MiR-455-3p promoted CRC cell proliferation in vitro. (a, b) MiR-455-3p improved cell viability. The cell viability was measured with CCK-8. (c, d) MiR-455-3p accelerated colony formation. Cell transfected with corresponding materials were re-seeded in a 6-well plate for 7–9 days. Data were shown as the mean ± SD (n=3). * means P < 0.05 and *** means P < 0.001, respectively. All data were performed triplet. All graphs are the results of three independent experiments.
3.3. miR-455-3p inhibited cell apoptosis by suppressing apoptosis-related protein
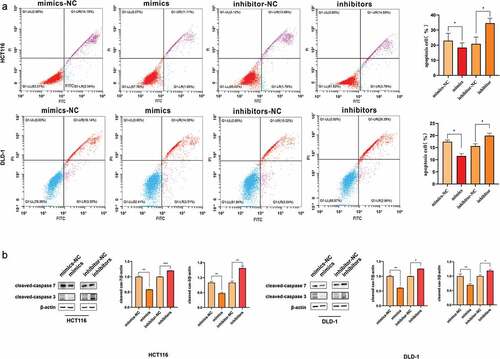
Cell apoptosis was evaluated by flow cytometry to further explore the function of miR-455-3p, The cells were transfected with different RNAs, and then cell apoptosis was assessed. The rate of early and late apoptotic cells in the mimics group was significantly lower, compared to that in the mimics-NC group (); the existence of inhibitors restored this reduction. The total proteins were extracted from the transfected cells. Western blot determined that the protein concentration of cleaved caspase 3 and cleaved caspase 7 were down-regulated in the mimics group compared to that in control, while in the inhibitors group, the protein was more abundant than that in the corresponding group (). This observation demonstrated that the apoptosis pathway was inhibited by suppressing cleaved caspase protein. Thus, miR-455-3p could influence cleaved caspase protein to regulate cell apoptosis for promoting CRC development.
Figure 3. MiR-455-3p inhibited cell apoptosis. (a) MiR-455-3p hindered cell apoptosis in HCT116 and DLD-1. After overexpression of miR-455-3p or knock-down miR-455-3p, cell apoptosis was analyzed by examination of Annexin V-FITC and PI double-staining. The statistical chart was attached to the corresponding image. (b) Apoptotic protein cleaved caspase 3 and cleaved caspase 7 were analyzed by western blot. The bar graph was the quantitative analysis of western blot. Data were shown as the mean ± SD (n=3). * means P < 0.05 and *** means P < 0.001, respectively. All data were performed triplet.
3.4. miR-455-3p promoted CRC cell migration by regulating EMT
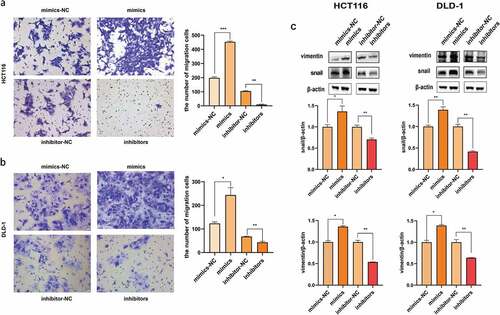
To investigate the impact on colon cancer metastasis, the Transwell assay was performed. The transfected cells were digested and re-seeded to the up chambers. The overexpression of miR-455-3p significantly strengthened the migratory capability, while its inhibition reduced the ability in both cell types (). It was reported that vimentin and snail were related with EMT, which could affect cell migration. Now that cell migration was proved in vitro, EMT-related proteins might be regulated by the miR-455-3p. Cells were prepared for western blot to measure the protein changes. The observation showed that vimentin and snail expression was upregulated in the cells transfected with mimics (); while the knock-down of miR-455-3p suppressing the protein expression. Overall, it was speculated that miR-455-3p could enhance the migration ability of the cancer cells by upregulating EMT-related protein.
Figure 4. Cell migration was boosted by miR-455-3p. (a) HCT116 cell migration ability was measured by Transwell assay after transfection. The numbers of migration cells were calculated. (b) DLD-1 cell migration ability was measured by Transwell assay after transfection. The numbers of migration cells were calculated. (c) Migration-related proteins, vimentin and snail, were detected by western blot. The quantification of density of western blot was statistical analysis. Data were shown as the mean ± SD (n=3). * means P < 0.05 and *** means P < 0.001, respectively. All data were performed triplet.
3.5. miR-455-3p could directly regulate H2AFZ
For investigation of the pathway of miR-455-3p, databases such as TargetScan, starBase, miRWalk, and mirDIP were employed to predict its target genes. The intersection was used for further analysis. The protein-protein interaction network showed that H2AFZ played a vital role that was similar to a hub-gene (). It was involved in these pathways and had a strong relationship with the remaining gene. Additionally, the KEGG pathway and GO analysis also found that they were enriched in an RNA-related pathway (). Therefore, among these targets, H2AFZ was chosen as the candidate target gene. First, the expression level of H2AFZ mRNA was measured in cancer tissues and their adjacent tissues. As showed, H2AFZ was down-regulated in cancer tissues compared with that in adjacent tissues. The expression pattern of H2AFZ was in contrast with that of miR-455-3p. Moreover, the mRNA and protein level of H2AFZ in different cancer cell lines was lower than that in normal cell lines (Figure S4-5). The observation was also contrary to that of miR-455-3p expression pattern in cell lines (Figure S6).
Figure 5. H2AFZ was miR-455-3p direct target gene. (a, b, c) Enrichment analysis. (a) STRING network of the prediction target gene. The relationship between these target genes. The red box indicated the site of H2AFZ. (b) GO enrichment result. (c) Kyoto Encyclopedia of Genes and Genomes (KEGG) pathway. (d) Luciferase report assay. In the wide-type group, the addition of mimics significantly decreased the luminescence signal. (e) MiR-455-3p reduced H2AFZ expression at the mRNA level. (f) H2AFZ protein expression level was measured by western blot in vitro. The quantification of the western blot was statistical analysis. Data were presented as the mean ± SD (n=3). *P < 0.05 and *** P < 0.001 vs NC group. All data were performed triplet.
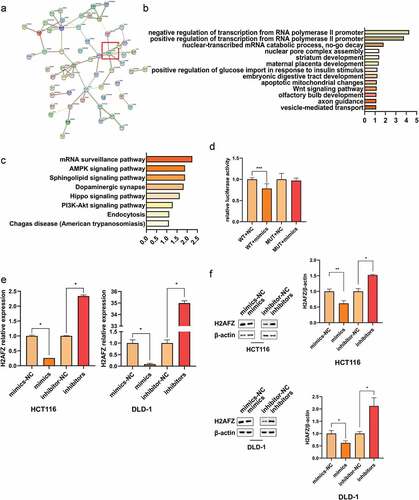
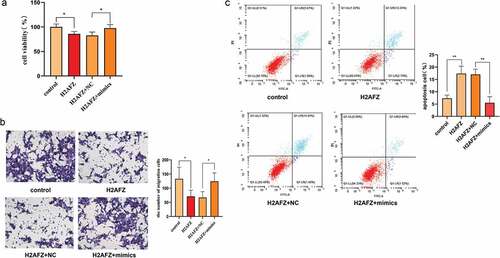
To explore whether there is a straight interaction of miR-455-3p and H2AFZ, the dual-luciferase assay was run. The fragment of H2AFZ was constructed into the vector containing the luciferase-coding sequence. The FHC cell was co-transfected with the vector and the RNAs. The experiments revealed that the luminescence signal was reduced in the wild-type and the mimics co-transfected cells (), which meant that miR-455-3p interacted with H2AFZ to suppress the luciferase expression. Also, the H2AFZ gene expression level was evaluated in the cells after transfecting with RNAs. The H2AFZ expression was downregulated at both mRNA and protein levels () by the mimics. Conversely, the inhibitors promoted H2AFZ expression. To further confirm the relationship between miR-455-3p and H2AFZ, H2AFZ overexpression plasmids were synthesized and transfected into the HCT116 and DLD-1 cell lines. In Figure S7, it was obvious that the H2AFZ gene could be overexpressed in cells successfully. Furthermore, cell viability, apoptosis and migration ability were significantly changed by H2AFZ overexpression ( and Figure S8), just contrary to the result of overexpression miR-455-3p: overexpressing H2AFZ decreased their proliferation and migration ability. However, it increased the cell apoptosis rate. In contrast, due to the excision of miR-455-3p mimics, the overexpression H2AFZ was suppressed: cell viability and migration were restored, while cell apoptosis decreased ( and Figure S8). It indicated that miR-455-3p might interfere with H2AFZ to promote CRC progression. Taken together, it was evident that H2AFZ was a direct target gene of miR-455-3p.
Figure 6. Knock-in H2AFZ, HCT116 cell phenotype was estimated. (a) Cell viability under H2AFZ knock-in condition. After being transfected with H2AFZ plasmids, cell viability was measured by CCK-8. (b) Migration assay. Cells transfected with H2AFZ plasmids were employed to perform a Transwell assay to detect their migration ability. () Cell transfected H2AFZ plasmid was detected by a flow cytometer. The corresponding statistical graph was attached. Control was the H2AFZ plasmid control. NC was the control of mimics. H2AFZ overexpression group was shown as H2AFZ. Data were presented as the mean ± SD (n=3). *P < 0.05 and *** P < 0.001 vs NC group. All data were performed triplet.
3.7. miR-455-3p promoted tumor growth under in vivo conditions
The earlier observations demonstrated that miR-455-3p promoted CRC under in vitro conditions. To further define the in vivo mechanisms, HCT116 cells transfected with miR-455-3p stably expressing the mimics or the negative control were constructed with lentiviruses. The cells were injected into the nude mice, respectively. Under in vivo conditions, the tumor growth rate was accelerated by miR-455-3p stimulation (). The growth rate of the tumor indicated that overexpressing miR-455-3p promoted tumor development in vivo. Tumor tissues were collected and analyzed. RT-qPCR revealed that miR-455-3p was significantly upregulated in the experimental group compared to the control group, while H2AFZ was downregulated by miR-455-3p (). Additionally, the H2AFZ expression significantly decreased at protein levels in the experimental group of nude mice (). The upregulation and downregulation of EMT-related and apoptosis-related proteins from the mouse tissue complied with the in vitro results, respectively (). All evidence confirmed that miR-455-3p stimulated the progression of CRC in vivo by promoting tumor growth.
Figure 7. MiR-455-3p promoted tumor development in vivo. (a)(b) Overexpression miR-455-3p boosts tumor growth in vivo. The growth rate was measured by tumor size (N=5). (c) MiR-455-3p expression in tumor tissue by RT-qPCR. (d) H2AFZ mRNA expression level in tumor tissue from the mouse. (e) Protein containing in tumor tissue (added cleaved caspase 3 and snail). The quantification of the western blot graph was statistical analysis. Data were shown as the mean ± SD (n=3). *P < 0.05 and *** P < 0.001 vs NC group. All data were performed triplet.
4. Discussion
miR-455-3p has been linked to tumorigenesis. Recent studies have associated miR-455-3p with the progression of cancers like osteosarcoma, breast cancer, and pancreatic cancer [Citation47–49] by functioning as a tumor suppressor. Zheng et al. reported that miR-455-3p was downregulated in the HCT116 cells [Citation50]. However, in patients with infiltrating carcinoma or lymph node metastasis of breast cancer, the serum miR-455-3p levels were elevated [Citation51]. The functions of miR-455-3p in CRC have not been investigated, and its expression profiles are contradictory in different reports. Thus, the biofunction and expression pattern of miR-455-3p were studied in CRC. Using miRNA-seq, the expression profile showed that 11 miRNAs were found to elevate in the patient serum samples. RT-qPCR further confirmed that the candidate miRNA expression pattern in clinical samples. Nevertheless, only miR-455-3p was significantly upregulated in both serum and tissue. According to overexpressed miR-455-3p in clinical samples, it was speculated that it could act as an oncogene in tumorigenesis and development of CRC. AUC analysis indicated that miR-455-3p had high sensitivity and specificity in discriminating CRC patients. The serum miR-455-3p obtained from clinical samples has the good potential in the diagnosis of CRC. In the study, a clinicopathological analysis also showed that serum miR-455-3p was associated with lymph nodes metastasis (), not related to patient age, gender, TNM stage or distant metastasis. The miR-455-3p expression level in tissue was associated with lymph nodes metastasis and distant metastasis (). Based on the relationship between miR-455-3p expression level and clinical characteristics, it can be speculated that miR-455-3p might promote CRC progress, especially metastatis. Although, low serum miR-455-3p level seemed associated with the lymph nodes metastasis in tissue. The miR-455-3p expression level was higher in lymph nodes of metastatic patients. It was observed that miR-455-3p was up-regulated in tumor cells but its release was blocked somehow. It should be explored in the future. Anyway, the investigation of the relationship between serum miR-455-4p and clinicopathological characteristics showed that detection of serum miR-455-3p could be used for distinguishing patient situation and CRC stage. Clinical samples also made us understand the reality expression pattern of miR-455-3p better in vivo, and the result could uncover miR-455-3p role in the real situation. The outcomes between in vivo and in vitro are often inconsistent. Beginning with the clinical sample is conducive to forecast the result of experiment in vivo. Moreover, the conclusion will be more reliable for further exploring.
miR-455-3p could be a promising biomarker in CRC patient serum based on the ROC curve. Further validation by RT-qPCR, the miR-455-3p expression level was higher in cancer tissue than that in adjacent tissue. The result showed the miR-455-3p had high sensitivity and specificity (.c). Other studies also revealed that miRNA is a more sensitive, specific, noninvasive biomarker and exists in serum stably [Citation35–37]. However, detecting one biomarker in disease diagnosis still is lack of specificity and accuracy. The false positive rate and false negative rate are higher. The combined use of multiple miRNAs can improve the accuracy of diagnosis, decreasing the false rate. So, more miRNAs need to be discovered for the characterization and improving diagnosis method of CRC.
Evidence showed that miRNAs are connected to tumor development and progress by participating in cell proliferation, cell cycle, cell apoptosis, and cell migration. For example, miR-1915-3P activates the ERK1/2 pathway and targets DUSP to interfere in breast cancer [Citation51]. miR-139-5p represses CRC by targeting NOTCH1, resulting in reducing cell proliferation, cell cycle arrest, etc [Citation52]. The evaluated miR-196b-5p promotes CRC by regulating the Epithelial-mesenchymal-transition (EMT) [Citation53]. However, the role of miR-455-3p in CRC remains unclear. According to the high-expression in CRC samples, miR-455-3p may have a putative tumor promotion function. The cell viability and colony formation experiments proved that miR-455-3p could accelerated cell growth and cancer progression. Under in vivo conditions, faster growth rate was observed in the group overexpressing miR-455-3p compared to the control group. These observations indicated that miR-455-3p functioned as an oncogene in tumorigenesis. The flow cytometry result indicated that cell apoptosis was reduced by overexpressing miR-455-3p in the HCT116 and DLD-1 cells (). The level of cleaved caspase 3 and cleaver caspase 7 were significantly reduced (). Emerging studies showed that caspase-related proteins play a crucial role in cell apoptosis. Apoptosis is generally mediated by mitochondrial outer membrane permeabilization and activation of subsequent effector caspases, including caspase 7 [Citation54]. First, apoptosis is initiated by the BCL-2 family members Bax and Bak. Next, pro-apoptotic proteins like cytochrome c are released from the intermembrane space into the cytosol [Citation55]. The binding of cytochrome c with Apaf-1 results in activating caspase proteins [Citation55]. Therefore, the level of cleaved caspase 3 and cleaved caspase 7 were evaluated. It was found that the knockdown of miR-455-3p may activate cleaved caspase 3 and cleave caspase 7 to initiate cell apoptosis. This result could explain the reason behind promoting CRC development by miR-455-3p from the perspective of apoptosis. Moreover, we found that the cell invasion was enhanced in the group overexpressing miR-455-3p. Amparo Cano et al. proved that over expression of Snail increased the expression of mesenchymal markers (vimentin and fibronectin) [Citation56]. The change was associated with the cell invasive and migratory properties [Citation57]. Jean Paul Thiery et al indicated that snail could regulate vimentin to effect cell EMT [Citation58]. Increasing studies have demonstrated the overexpression of snail or vimentin were positive related with cancer invasion or migration [Citation59,Citation60]. It was studied that miR-455-3p could stimulated snail and vimentin expression to boost cell migration (), which was consistent with the in vivo result (). All molecular mechanisms demonstrated that miR-455-3p functioned as an oncogene in CRC and involved tumor development, progress, apoptosis and invasion. Investigating these molecular mechanisms can offer new insights into CRC diagnosis and treatments.
miRNAs regulate gene expression usually by interfering with several 3’-UTRs of the mRNAs [Citation29–31]. To further understand the biological functions of miR-455-3p, its possible target genes were predicted. H2AFZ was one of these candidate target genes. H2AFZ, a variant of H2A, is associated with gene expression and DNA repair [Citation61]. H2AFZ may function as an activator or a silencer by surrounding the gene transcription start site (TSS) [Citation62]. Stephen et al. proposed that the local exchange of H2AFZ can regulate c-myc [Citation63]. Additionally, in many cancers, the expression of c-myc is dysfunctional [Citation64] which means H2AFZ may have a connection with cancer. Moreover, evidence also showed that H2AFZ affected cell mitosis, neural crest differentiation and EMT [Citation65–68]. In melanoma, the loss of H2AFZ changes the chromatin structure, which caused cancer [Citation62]. Considering these facts, the dysfunction of H2AFZ was speculated to be related to tumorigenesis and progression. Hence, it was chosen as the putative target gene of miR-455-3p. In the dual-luciferase assay, the wild-type plasmid with overexpressing miR-455-3p group showed a lower signal than the control group which indicated that miR-455-3p could interference with H2AFZ to influence its expression (). RT-qPCR and western bolt also indicated that the reduction in H2AFZ was due to overexpression of miR-455-3p; the use of inhibitors could restore this situation (). To verify the conclusion, overexpression H2AFZ plasmids were synthesized and transfected into the HCT116 and DLD-1 cell lines. This assay showed that cell viability and migration ability were significantly reduced by H2AFZ ( and Supplementary Fig.8). And cells containing whole plasmids had higher apoptosis rate. Furthermore, the miR-455-3p could rescue the damage of H2AFZ. Cell transfected with mimics and H2AFZ plasmids could act similarly to the cells transfected with control plasmids. It was obvious that overexpression H2AFZ achieved the same results with interference miR-455-3p expression. The result indicated that miR-455-3p could regulate H2AFZ to promote CRC. It will be clear to understand the mechanism of miR-455-3p in CRC occurrence and development. In the current study, only few miR-455-3p target genes were identified and the involvement of the other target genes in the CRC process is unclear. The discovery of different target genes is essential for the complete understanding of the biological function of miR-455-3p. Moreover, there is a limitation that the accuracy of the predicting target gene is low. More reliable algorithms are needed. A complete algorithm and software will significantly reduce the task of discovering new target genes.
In conclusion, the potential clinical relevance of miR-455-3p in colon cancer was identified. Its expression was upregulated in serum and tissues of CRC patients compared to the controls. Thus, miR-455-3p may act as a biomarker in the diagnosis of colon cancer in the future. Further research on miR-455-3p revealed that it could promote CRC by endorsing development, invasion, and inhibiting apoptosis. Under in vivo conditions, miR-455-3p also stimulated the tumor growth rate. In general, miR-455-3p could function as an oncogene by regulating H2AFZ directly in CRC.
Author contributions
LZ Y is the major investigator of this study. Y C and YY J conferred the idea for this work. LZ Y was a outstanding contributor in writing it. Y C and YY J revised the manuscript carefully. All authors contributed to data analysis, drafting or revising the manuscript, then, agreed on the journal to which the article will be submitted. All authors were agreement with the accountable for all aspects of the work.
Supplemental Material
Download Zip (3.6 MB)Supplemental Material
Download Zip (1.4 MB)Acknowledgement
We appreciate the financial supports from Shenzhen Progression and Reform Committee (No.2019156) and Department of Science and Technology of Guangdong Province (No. 2017B030314083).
Disclosure statement
No potential conflict of interest was reported by the author(s).
Supplemental material
Supplemental data for this article can be accessed online at https://doi.org/10.1080/15384101.2022.2154549
Additional information
Funding
References
- International agency for research on cancer W. https://www.iarc.who.int. 2021.
- International agency for research on cancer W. global cancer observatory. https://gcoiarcfr/2020.
- Li N, Lu B, Luo C, et al. Incidence, mortality, survival, risk factor and screening of colorectal cancer: a comparison among China, Europe, and Northern America. Cancer Lett. 2021;522:255–268.
- Zhou J, Zheng R, Zhang S, et al. Colorectal cancer burden and trends: comparison between China and major burden countries in the world. Chin J Canc Res. 2021;33(1):1–10. DOI:10.21147/j.issn.1000-9604.2021.01.01
- Cardoso R, Guo F, Heisser T, et al. Colorectal cancer incidence, mortality, and stage distribution in European countries in the colorectal cancer screening era: an international population-based study. Lancet Oncol. 2021;22(7):1002–1013. DOI:10.1016/S1470-2045(21)00199-6
- Siegel R, Miller K, Goding S, et al. Colorectal cancer statistics, 2020. CA Cancer J Clin. 2020;70(3):145–164. DOI:10.3322/caac.21601
- Bray F, Jemal A, Grey N, et al. Global cancer transitions according to the human development index (2008–2030): a population-based study. Lancet Oncol. 2012;13(8):790–801. DOI:10.1016/S1470-2045(12)70211-5
- Zorzi M, Battagello J, Fiore A, et al. Colorectal cancer incidence and mortality after negative fecal immunochemical tests by age 70: a prospective observational study. Int J Cancer. 2021;149(6):1257–1265. DOI:10.1002/ijc.33682
- Karen S, Simon K. Colorectal cancer development and advances in screening. Clin Interv Aging. 2016;11:967–976.
- Faezeh S, Mansour J, Pedram E. Synthesis of novel polymeric nanoparticles (methoxy-polyethylene glycol-chitosan/hyaluronic acid) containing 7-ethyl-10-hydroxycamptothecin for colon cancer therapy: in vitro, ex vivo and in vivo investigation. Artif Cells Nanomed Biotechnol. 2021;49(1):367–380.
- Heping Z, Shilong Y, Bingluo Z, et al. Design, synthesis, and evaluation of novel coumarin-dithiocarbamate derivatives (IDs) as anti-colorectal cancer agents. J Enzyme Inhib Med Chem. 2021;36(1):539–604. DOI:10.1080/14756366.2021.1875458
- Tang C, Liu J, Hu Q, et al. Metastatic colorectal cancer: perspectives on long non-coding RNAs and promising therapeutics. Eur J Pharmacol. 2021;908:174367.
- Sandro S, Stala K, Despina I, et al. Testing messages from behavioral economics to improve participation in a population-based colorectal cancer screening program in Cyprus: results from two randomized controlled trials. Prev Med Rep. 2021;24:101499.
- Zhu X, Parks P, Weiser E, et al. Barriers to utilization of three colorectal cancer screening options - data from a national survey. Prev Med Rep. 2021;24:101508.
- Rioux B, Pion A, Gamond A, et al. Synthesis and biological evaluation of chalcone-polyamine conjugates as novel vectorized agents in colorectal and prostate cancer chemotherapy. Eur J Med Chem. 2021;222:113586.
- Meng Y, Long C, Huang X, et al. Prognostic role and clinical significance of C-reactive protein-lymphocyte ratio in colorectal cancer. Bioengineered. 2021;12(1):5138–5148. DOI:10.1080/21655979.2021.1960768
- Rasool M, Carracedo A, Sibiany A, et al. Discovery of a novel and a rare Kirsten rat sarcoma viral oncogene homolog (KRAS) gene mutation in colorectal cancer patients. Bioengineered. 2021;12(1):5099–5109. DOI:10.1080/21655979.2021.1960715
- Ai L, Luo X, Yan X, et al. MicroRNA-506-3p inhibits colorectal cancer cell proliferation through targeting enhancer of zeste homologue 2. Bioengineered. 2021;12(1):4044–4053. DOI:10.1080/21655979.2021.1951930
- Siegel R, Miller K, Anderson J, et al. Colorectal cancer statistics, 2020. CA Cancer J Clin. 2020;70(3):145–164. DOI:10.3322/caac.21601
- Mariana C, Dórea, Galdino AS, et al. Carcinoembryonic antigen (CEA) and hepatic metastasis in colorectal cancer: update on biomarker for clinical and biotechnological approaches. Recent Pat Biotechnol. 2018;12(4):11. DOI:10.2174/1872208312666180731104244
- Bhullar D, Barriuso J, Mullamitha S, et al. Biomarker concordance between primary colorectal cancer and its metastases. EBioMedicine. 2019;40:363–374.
- Ni Y, Xie G, Jia W. Metabonomics of human colorectal cancer: new approaches for early diagnosis and biomarker discovery. J Proteome Res. 2014;13(9):3857–3870.
- Lech G, Slotwinski R, Slodkowski M, et al. Colorectal cancer tumour markers and biomarkers: recent therapeutic advances. World J Gastroenterol. 2016;22(5):1745–1755. DOI:10.3748/wjg.v22.i5.1745
- Zhang X, Sun X, Cao Y, et al. CBD: a biomarker database for colorectal cancer. Database (Ox-Ford). 2018. DOI:10.1093/database/bay046.
- Cho W, Kim M, Park J, et al. Exosomal miR-193a and let-7g accelerate cancer progression on primary colorectal cancer and paired peritoneal metastatic cancer. Transl Oncol. 2021;14(2):101000. DOI:10.1016/j.tranon.2020.101000
- Tutar Y. miRNA and cancer; computational and experimental approaches. Curr Pharm Biotechnol. 2014;15(5):429.
- Ankit T, Manjusha D, Dixit M. MicroRNA key to angiogenesis regulation: miRNA biology and therapy. Curr Cancer Drug Targets. 2018;18(3):12.
- Rameshwar O. Human aging and cancer: role of miRNA in tumor microenvironment. Exosome Stem Cells MicroRna. 2018;1056(6):137.
- Correia M, Gjorgjieva M, Dolicka D, et al. Deciphering miRnas’ action through miRNA editing. Int J Mol Sci. 2019;20(24):6249. DOI:10.3390/ijms20246249
- Chen L, Heikkinen L, Wang C, et al. Trends in the development of miRNA bioinformatics tools. Brief Bioinform. 2019;20(5):1836–1852. DOI:10.1093/bib/bby054
- Wu M, Tian W, Deng Y, et al. MiRNA-based therapeutics for lung cancer. Curr Pharm Des. 2018;23(39):8. DOI:10.2174/1381612823666170714151715
- Rani A. MiRNA biogenesis and regulation of diseases: an Overview. microRna Profiling. 2016;1509:11.
- Lu T, Rothenberg M. MicroRNA. J Allergy Clin Immunol. 2018;141(4):1202–1207.
- Mishra S, Yadav T, Rani V. Exploring miRNA-based approaches in cancer diagnostics and therapeutics. Crit Rev Oncol Hematol. 2016;98:12–23.
- Di L, Garofalo M, Croce C. MicroRnas in cancer. Annu Rev Pathol. 2014;9(1):287–314.
- Roosbroeck V, Calin G. Cancer hallmarks and MicroRnas: the therapeutic connection. Adv Cancer Res. 2017;135:119–149.
- Acunzo M, Romano G, Wernicke D, et al. MicroRNA and cancer–a brief overview. Adv Biol Regul. 2015;57:1–9.
- Pf SR, Lawrence M. The role of miR-21 in cancer. Drug Dev Res. 2015;76(6):8.
- Ali S, Langden S, Munkhzul C, et al. Regulatory mechanism of microRNA expression in cancer. Int J Mol Sci. 2020;21(5):1723. DOI:10.3390/ijms21051723
- Fridrichova I, Zmetakova I. MicroRnas contribute to breast cancer invasiveness. Cells. 2019;8(11):1361.
- Rupaimoole R, Slack F. MicroRNA therapeutics: towards a new era for the management of cancer and other diseases. Nat Rev Drug Discov. 2017;16(3):203–222.
- Lee Y, Dutta A. MicroRnas in cancer. Annu Rev Pathol. 2009;4(1):199–227.
- Kim T, Lee Y, Yun N, et al. MicroRNA-17-5p regulates EMT by targeting vimentin in colorectal cancer. Br J Cancer. 2020;123(7):1123–1130. DOI:10.1038/s41416-020-0940-5
- Wang F, Chan L, Law H, et al. Exploring microRNA-mediated alteration of EGFR signaling pathway in non-small cell lung cancer using an mRna:miRNA regression model supported by target prediction data-bases. Genomics. 2014;104(6 Pt B):504–511. DOI:10.1016/j.ygeno.2014.09.004
- Kozomara A, Griffiths-Jones S. Griffiths-Jones S. miRbase: annotating high confidence microRnas using deep sequencing data. Nucl Acids Res. 2014;43:68–73.
- Kozomara A, Birgaoanu M. Griffiths-Jones S. miRbase: from microRNA sequences to function. Nucl Acids Res. 2014;43:68–73.
- Zhan T, Zhu Q, Han Z, et al. miR-455-3p Functions as a tumor suppressor by restraining wnt/beta-catenin signaling via taz in pancreatic cancer. Cancer Manag Res. 2020;12:1483–1492.
- Yi X, Wang Y, Xu S. MiR-455-3p downregulation facilitates cell proliferation and invasion and predicts poor prognosis of osteosarcoma. J Orthop Surg Res. 2020;15(1):454.
- Guo J, Liu C, Wang W, et al. Identification of serum miR-1915-3p and miR-455-3p as biomarkers for breast cancer. PLoS ONE. 2018;13(7):e0200716. DOI:10.1371/journal.pone.0200716
- Zheng J, Lin Z, Zhang L, et al. microRNA-455-3p inhibits tumor cell proliferation and induces apoptosis in HCT116 human colon cancer cells. Med Sci Monit. 2016;22:4431–4437.
- Li Z, Wu A, Pan X, et al. MicroRNA-455-3p promotes invasion and migration in triple negative breast cancer by targeting tumor suppressor EI24. Oncotarget. 2017;8(12):12. DOI:10.18632/oncotarget.14307
- Zhang L, Zhu N, Tsoi H, et al. microRNA-139-5p exerts tumor suppressor function by targeting NOTCH1 in colorectal cancer. Mol cancer. 2014;13:12.
- Xin H, Chi Y, Liu Z. MicroRNA-196b-5p promotes malignant progression of colorectal cancer by targeting ING5. Cancer Cell Int. 2020;20(119). DOI:10.1186/s12935-020-01200-3
- Xu X, Lai Y, Hua Z. Apoptosis and apoptotic body: disease message and therapeutic target potentials. Biosci Rep. 2019;39(1). DOI:10.1042/BSR20180992
- Elmore S. Apoptosis: a review of programmed cell death. Toxicol Pathol. 2007;35(4):22.
- Batlle E, Sancho E, Francí C, et al. The transcription factor snail is a repressor of E-cadherin gene expression in epithelial tumour cells. Nat Cell Biol. 2000;2(2):84–89. DOI:10.1038/35000034
- Paul J, Acloque H, Ruby Y, et al. Epithelial-mesenchymal transitions in development and disease. Cell. 2009;139(5):871–890. DOI:10.1016/j.cell.2009.11.007
- Liu C, Lin H, Tang M, et al. Vimentin contributes to epithelial-mesenchymal transition cancer cell mechanics by mediating cytoskeletal organization and focal adhesion maturation. Oncotarget. 2015;6(18):15966–15983. DOI:10.18632/oncotarget.3862
- Dave J, Bayless K. Vimentin as an integral regulator of cell adhesion and endothelial sprouting. Microcirculation. 2014;21(4):12.
- Satelli A, Li S. Vimentin in cancer and its potential as a molecular target for cancer therapy. Cell Mol Life Sci. 2011;68(18):3033–3046.
- Qi L, Zhou B, Chen J, et al. Significant prognostic values of differentially expressed-aberrantly methylated hub genes in breast cancer. J Cancer. 2019;10(26):6618–6634. DOI:10.7150/jca.33433
- Semer M, Bidon B, Larnicol A, et al. DNA repair complex licenses acetylation of H2A.Z.1 by KAT2A during transcription. Nat Chem Biol. 2019;15(10):992–1000. DOI:10.1038/s41589-019-0354-y
- Farris S, Rubio E, Moon J, et al. Transcription-induced chromatin remodeling at the c-myc gene involves the local exchange of histone H2A.Z. J Biol Chem. 2005;280(26):25298–25303. DOI:10.1074/jbc.M501784200
- Punzeler S, Link S, Wagner G, et al. Multivalent binding of PWWP2A to H2A.Z regulates mitosis and neural crest differentiation. EMBO J. 2017;36(15):2263–2279. DOI:10.15252/embj.201695757
- Stasevich E, Murashko M, Zinevich L, et al. The role of non-coding RNAs in the regulation of the proto-oncogene myc in different types of cancer. Biomedicines. 2021;9:921.
- Yang H, Kim P, Eun J, et al. Oncogenic potential of histone-variant H2A.Z.1 and its regulatory role in cell cycle and epithelial-mesenchymal transition in liver cancer. Oncotarget. 2016;7(10):12. DOI:10.18632/oncotarget.7194
- Baptista T, Graça I, Sousa E, et al. Regulation of histone H2A.Z expression is mediated by sirtuin 1 in prostate cancer. Oncotarget. 2013;4(10):1673–1685. DOI:10.18632/oncotarget.1237
- Rachel A, Battaglia S, Harald H, et al. Vimentin on the move: new developments in cell migration. F1000Res. 2018;7:10.