
ABSTRACT
This study aimed to explore the role of lipopolysaccharide-binding protein (LBP) in adipose browning. Mouse embryonic fibroblasts (MEFs) were treated with differentiation induction reagents and Perifosine (Akt inhibitor), with the transfection of Atg5, short hairpin RNA targeting LBP (shLBP), and Atg5 (shAtg5). The expression levels of LBP, inflammatory markers , brown fat markers, lipid metabolism marker, autophagy markers, insulin signaling-related molecules , p-mTOR, mTOR, p-Akt, Akt, p-PI3K, and PI3K were quantified or determined by Western blot, qRT-PCR, and immunofluorescence assay. The formation of lipid was examined through Oil red O staining assay. The consumption of oxygen was assessed using a Seahorse XF96 analyzer, and the uptake of glucose was evaluated by [3H]-2-deoxy-D-glucose uptake assay. Deficiency of LBP promoted adipose browning, oxygen consumption, glucose uptake, and insulin sensitivity in differentiated MEFs, where it inhibited inflammation and autophagy. All of the effects above were reversed by Atg5 overexpression. Meanwhile, the knockdown of Atg5 strengthened the activation of PI3K/Akt/mTOR pathway induced by the depletion of LBP, while Perifosine partly reversed the activation of differentiated MEFs. The knockdown of LBP facilitated adipose browning, glucose uptake, and oxygen consumption in MEFs via the activation of PI3K/Akt/mTOR pathway and the inhibition of autophagy.
Introduction
Obesity is more likely to increase the risk of multiple diseases, such as dyslipidemia, hypertension, coronary heart disease and diabetes, and it has been discovered in a meta-analysis that obesity can even raise all-cause mortality [Citation1,Citation2]. Obesity results from chronic energy intake exceeding energy expenditure where surplus energy is stored in white adipose tissue (WAT) [Citation3]. In patients with obesity, an increase in the size and number of white adipocytes that can affect systemic metabolism and promote insulin resistance by releasing several hormones and cytokines [Citation4–6]. Hence, how to prevent obesity has been a great challenge, which needs to be solved urgently. Although the management strategies on obesity advocated by the WHO have increased physical exercise and decreased intake of foods rich in energy, which indeed have achieved a certain effect, there still exhibit a low success rate among most individuals, implying the requirement for additional therapeutic methods to lose weight [Citation7].
WAT and brown adipose tissue (BAT) are two types of adipose tissues possessing distinct physiological functions: the former is a major organ storing chemical energy [Citation8,Citation9], whereas the latter releases chemical energy through adaptive thermogenesis [Citation10,Citation11]. Recently, numerous reports are available concerning negative regulator browning effects in WAT. For example, novel adipokine asprosin or apoptosis signal-regulating kinase1 negatively regulated browning and elevate adipogenesis in WAT [Citation12,Citation13]. Decidual protein induced by progesterone deficiency in mice induced white adipocyte browning and enhanced BAT activity [Citation14]. Brown adipocytes express high levels of uncoupling protein 1 (UCP1) to dissipate energy in the form of heat [Citation15]. According to the animal experiments, it is found that enhancing the function of BAT can counteract poor diet-induced obesity [Citation16,Citation17]. Similarly, relevant researches on humans demonstrate that the BAT negatively correlates with body mass index and body fat, with lower content of BAT related to easier occurrence of obesity [Citation10,Citation11,Citation18]. Furthermore, BAT plays a crucial part in promoting glucose uptake and ameliorating glycometabolism as well as insulin sensitivity [Citation16,Citation19–22]. Interestingly, white adipocytes can be transformed into BAT-like phenotypic adipocytes (also called beige, brown-in-white, or brite adipocytes), which is entitled the “browning” of WAT [Citation23]. While being stimulated in the body by cold exposure [Citation24] or β-adrenoceptors agonist [Citation25], BAT-like adipocytes can be detected in WAT. These BAT-like phenotypic adipocytes that appear in WAT depots are distinct from both white and brown adipocytes [Citation26]. Recent evidence revealed that increasing metabolic activity of BAT might be a novel way to improve lipid metabolism in obese individuals [Citation27–29]. Thus, stimulating the development of WAT browning might reduce adverse effects of WAT and could help to ameliorate metabolic health.
Mainly synthesized in the liver, lipopolysaccharide (LPS) binding protein (LBP) is an acute-phase glycoprotein able to bind LPS owing to its great affinity with lipid A [Citation30]. Many works have revealed that LBP intimately connects with obesity and related metabolic disturbance [Citation31–37. The weight loss, and the improvement of insulin sensitivity, were generally accompanied by notable reduction of LBP level Citation38,Citation39]. The mitigated atherosclerosis and slowed weight gain are unveiled in mice with the depletion of LBP [Citation40,Citation41]. In 3T3-L1 adipocytes, the knockdown of LBP strengthens the activity of insulin pathway and alleviates inflammation [Citation39,Citation42,Citation43]. These findings suggest that the inhibition of LBP can exert a function on lipid metabolism. Moreover, Gavaldà-Navarro et al. have further validated that the knockdown of LBP in adipocytes upregulates BAT-related genes and enables the induction of subcutaneous adipose tissue browning in mice [Citation40], which indicates that LBP may modulate the metabolism of adipose tissue by affecting adipose browning. Nevertheless, the specific mechanisms concerning the regulatory effects of LBP on adipose browning have remained largely unknown up to now.
As a type of early mesenchymal stem cells, mouse embryonic fibroblasts (MEFs) have the potential ability of multi-directional differentiation. MEFs are an important source of adipocytes and have been used to induce brown adipogenesis in many recent reports [Citation44–46]. Therefore, we explored the role and mechanism of LBP on the induced differentiation of MEFs to brown adipocytes, aiming at shedding new light on obesity management.
Materials and methods
Cell culture
MEFs were purchased from the American Type Culture Collection (ATCC; SCRC-1045, Manassas, VA, USA) and cultured in Dulbecco’s Modified Eagle’s Medium (DMEM; 30–2002, ATCC, USA) blended with 15% fetal bovine serum (FBS; 30–2020, ATCC, USA) at 37°C in a humidified atmosphere with 5% CO2.
Cell transfection
Constructed with MISSION® pLKO.1-puro Empty Vector (SHC001; Sigma-Aldrich, St. Louis, MO, USA), the short hairpin RNA targeting LBP (shLBP; 5’-AGUUUCAGGAAGGAUUUGCGC-3’, 5’-GCAAAUCCUUCCUGAAACUUC-3’) and Atg5 (shAtg5; 5’-UCUUUGUCAUCUGUCAUUCUU-3’, 5’-GAAUGACAGAUGACAAAGAUG-3’) were transfected into MEFs using Lipofectamine™ 3000 Transfection Reagent (L3000150, ThermoFisher, Waltham, MA, USA), and the empty vector was taken as its negative control (shNC). An overexpression vector (pcDNA3.1/+) containing the Atg5 gene and an empty pcDNA3.1/+vector (negative control (NC)) were purchased from Guangzhou RiboBio Co., Ltd. The transfection was carried out strictly according to manufacturer’s instructions. Specifically, after digestion with trypsin (15050065, ThermoFisher, USA), cells were seeded in a 96-well plate at a density of 3 × 10⁴ cell/mL and cultured until the confluence of 90%. Cell transfection was performed with the help of Lipofectamine 3000 (Invitrogen, CA, USA) following the manufacturer’s protocols at 37°C for 3 h. An initial dose–response experiment was carried out based on the manufacturer’s instructions to determine the optimal transfection efficiency. Quantitative reverse transcription-polymerase chain reaction (qRT-PCR) and Western blot were used to monitor transfection efficiency.
Cell differentiation induction
MEFs were incubated in high glucose DMEM (4500 mg/L glucose, L-glutamine, 100 IU/mL penicillin, and 100 IU/mL streptomycin without sodium pyruvate) supplemented with 10% FBS until 2 days after contact inhibition (Day 0). Subsequently, the medium was replaced with high glucose DMEM culture (10% FBS) containing 0.5 mM 3-isobutyl-1-methylxanthine (IBMX), 0.5 μg/mL insulin (human) recombinant expressed in yeast (INS), 5 μM dexamethasone (DXM), 3 μM rosiglitazone (RSG) and 1 nM liothyronine sodium (T3), which was changed every 2 d. Four days later (Day 4), the medium was replaced with high glucose DMEM (10% FBS) containing 0.5 μg/mL INS and 1 nM T3 and replaced every 2 d until day 14. For transfected cells, shRNA transfection was performed every 4 d during differentiation treatment, and the transfection time was 3 h.
Cell grouping
For our study, MEFs were assigned to the following groups and treated as follows. Control group: cells were normally cultured without any treatment; shNC group: cells were transfected with shNC; shLBP group: cells were transfected with shLBP; control-D group: cells were induced with differentiation; shNC-D group: cells were transfected with shNC and induced with differentiation, and the transfection was operated every 4 d during the induction; shLBP-D group: cells were transfected with shLBP and induced with differentiation, and the transfection was operated every 4 d during the induction; shAtg5+shLBP group: cells were transfected with shAtg5 and shLBP; shAtg5+shLBP-D group: cells were transfected with shAtg5 and shLBP and induced with differentiation, and the transfection was performed every 4 d during the induction.
Treatment
Cells were treated with 4 μM Perifosine (a p-Akt inhibitor; S1037, Selleck Chemicals, Houston, TX, USA, https://www.selleckchem.com/) for 24 h.
Oil red O staining assay
Modified Oil Red O Staining Kit (C0158 M, Beyotime Biotechnology, Shanghai, China) was adopted for the determination of lipid formed in cells. With the medium removed, cells were washed once using Phosphate-Buffered Saline (PBS; C0221A, Beyotime Biotechnology, China), followed by the fixation with 4% Paraformaldehyde Fix Solution (P0099, Beyotime Biotechnology, China) for 10 min, followed by being rinsed twice by PBS and immersed in staining washing solution for 20 s. After discarding washing solution, oil red O staining working solution was added into cells for 15 min, subsequent to which cells were immersed in washing solution again for 30 s after the removal of working solution and washed by PBS for 20 s. Hematoxylin staining solution (C0107, Beyotime Biotechnology, China) was employed to stain the nucleus. Following the coverage with PBS, cells were observed under a Leica DM IL LED microscope (magnification: ×200; Leica Microsystems Inc., Buffalo Grove, IL, USA).
Oxygen consumption measurement assay
MEFs were seeded at a density of 2 × 10⁴ cells/well in the custom V7 PS 96-well microplates and cultured until the confluence of 90%, with the agents for transfection (shNC, shLBP, and shAtg5) and differentiation injected into cells through the injection ports on Seahorse cartridges. The oxygen consumption rate (OCR) during the treatment was measured at 30, 60, 90, 120, 150, 180, 360, 840, 1320, 1800, 2280, and 2760 min by a Seahorse XF96 analyzer (Seahorse Bioscience, North Billerica, MA, USA).
[3H]-2-deoxy-D-glucose ([3H]-2DG) uptake assay
Following being rinsed twice by PBS, MEFs were cultured in glucose-free DMEM containing 0.5% (w/vol) bovine albumin (BSA; ST023, Beyotime Biotechnology, China) and 50 nM 2-deoxy-D-glucose (2-DG; D8375, Sigma-Aldrich, USA) with the specific radioactivity of 9.5–12 Ci/mmol was added for 10 min. Next, cells were washed twice using precooled PBS to terminate the reaction and then lysed in 0.2 M sodium hydroxide (NaOH, ≥98%; S5881, Sigma-Aldrich, USA) at 55°C for 1 h. A Tri-Carb 2900TR liquid scintillation counter (PerkinElmer, Waltham, MA, USA) was utilized to determine the radioactivity, the result of which was presented as a percentage of basal glucose uptake measured in each group.
qRT-PCR
Total RNA was isolated from cells with RNAiso Plus (Trizol) (9109, Takara Biomedical Technology Co., Ltd., Beijing, China) and PrimeScript RT reagent Kit with gDNA Eraser (Perfect Real Time) (RR047A, Takara Biomedical Technology Co., Ltd., China) was applied to synthesize cDNA through reverse transcription. Subsequently, cDNA was amplified in Thermal Cycler Dice Real Time System III (Takara Biomedical Technology Co., Ltd., China), which was traced by TB Green® Fast qPCR Mix (RR430S, Takara Biomedical Technology Co., Ltd., China) under a thermal cycle comprising predenaturation at 95°C for 30 s and 40 cycles of 95°C for 5 s and 60°C for 10 s. GAPDH was the endogenous control. The primer sequences (RiboBio, Guangzhou, China) are listed in . Data on the relative mRNA expression were quantified using 2−ΔΔCT quantification methods [Citation47].
Table 1. Primer sequences used for quantitative reverse transcription-polymerase chain reaction (qRT-PCR).
Western blot
Total protein was isolated by cell lysis buffer for Western and IP (P0013, Beyotime Biotechnology, China) with cells centrifuged at 4°C for 10 min at 12,000 rpm. The supernatant was collected, and the concentration of total protein was measured through a BCA Protein Assay Kit (P0011, Beyotime Biotechnology, China) and equal amounts of protein (45 µg) and marker (5 µL; PR1910, Beijing Solarbio Science&Technology Co., Ltd., Beijing, China) were separated by 6% SDS polyacrylamide gel electrophoresis (SDS-PAGE) (P0012A, Beyotime Biotechnology, China). Next, the protein sample was transferred onto PVDF membranes (88585, Thermo Fisher Scientific, USA) and blocked in 5% nonfat milk at room temperature for 1 h. The membranes were then incubated at 4°C overnight with primary antibodies, following which the membranes were washed using Tris-buffered saline containing Tween 20 (TBST; ST673, Beyotime Biotechnology, China) and incubated with the corresponding secondary antibodies at room temperature for 1 h and rinsed again by TBST. With the help of the BeyoECL Star (P0018S, Beyotime Biotechnology, China), the protein band was visualized through a chemiluminescence system (SH-Focus523, Shenhua Bio., Hangzhou, China, http://www.shenhuabio.cn/index.php). Image J software, version 1.48 (National Institutes of Health, Bethesda, MD, USA) was used for the analysis of data. The antibodies used in this experiment are listed in .
Table 2. The antibodies used in this experiment.
Immunofluorescence assay
MEFs were fixed with 4% Paraformaldehyde Fix Solution for 1 h and washed by PBS, followed by the permeabilization in Triton X-100 (P0096, Beyotime Biotechnology, China). After being blocked in 5% BSA at room temperature for 1 h and rinsed using PBS, cells were cultured with the primary antibody rabbit anti-Atg5 (1:100, ab108327, Abcam, Cambridge, MA, USA) at 4°C overnight. Following rinsing with PBS, cells were incubated with the corresponding fluorescein-conjugated Goat Anti-Rabbit IgG H&L (Alexa Fluor® 488) secondary antibody (1:200, ab150077, Abcam, USA) at room temperature for 1 h. DAPI Staining Solution (C1005, Beyotime Biotechnology, China) was applied for nucleus staining. At last, cells were mounted and viewed under the microscope (magnification: ×200).
Statistical analysis
SPSS 20.0 (IBM, Armonk, NY, USA) was utilized for the statistical analysis. Kolmogorov–Smirnov test was used to verify normality. Measurement data were expressed as the means ± standard deviation among multiple groups and the statistical significance was determined by one-way ANOVA with Tukey’s post hoc test. All experiments were performed at least three times and p < 0.05 implied a statistically significant difference.
Results
The knockdown of LBP upregulated UCP-1 level in differentiated MEFs
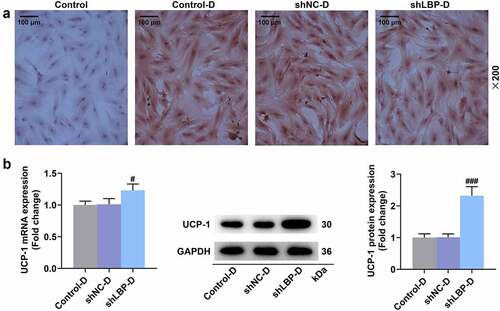
The obviously decreased LBP mRNA and protein levels of MEFs were displayed in both shLBP () and shLBP-D () groups in comparison with their respective negative controls ( A-B, p < 0.001), which suggested the successful transfection. Based on the results of oil red o staining assay, it was observed that after the induction of differentiation, the morphology of the cells changed from fusiform into round, and lipid droplets appeared in cells (), and there was no prominent difference in lipid droplets of differentiated MEFs between shNC-D group and shLBP-D group (). Moreover, the mRNA and protein levels of UCP-1 were appreciably increased in differentiated MEFs transfected with shLBP as compared to those transfected with the empty vector (, p < 0.05).
Figure 1. shLBP decreased LBP mRNA and protein levels in MEFs with or without differentiation induction. (A) the mRNA and protein expression of LBP was detected by qRT-PCR and Western blot after transfection of shLBP. GAPDH was a loading control. (B) the mRNA and protein expression of LBP was detected by qRT-PCR and Western blot after transfection of shLBP and differentiation induction. GAPDH was a loading control. *** p < 0.001 vs. shNC group; ### p < 0.001 vs. shNC-D group. All experiments were repeated independently at least three times. Data was performed as the means ± standard deviation.
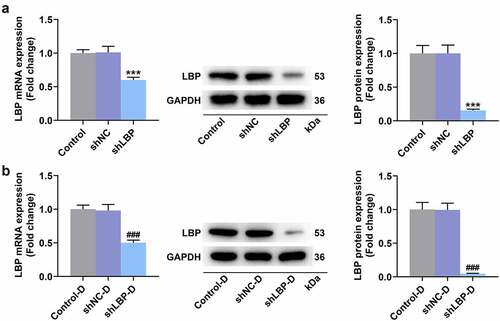
Figure 2. MEFs were successfully induced differentiation into adipocytes and shLBP upregulated UCP-1 level in differentiated MEFs. (A) the lipid in MEFs during differentiation induction was tested by oil red o staining assay with transfection of shLBP (scale: 100 µm; magnification: ×200). (B) the mRNA and protein expression of UCP-1 was detected by qRT-PCR Western blot after transfection of shLBP and differentiation induction. GAPDH was a loading control. # p < 0.05, ### p < 0.001 vs. shNC-D group. All experiments were repeated independently at least three times. Data was performed as the means ± standard deviation.
The knockdown of LBP promoted oxygen consumption and glucose uptake in differentiated MEFs
One set involved the direct treatment method () after the measurement of basal respiration at 30 min, which helped us assess the effects of knockdown of LBP on the instantaneous respiration rate of MEFs. The OCR did not differ evidently in MEFs between the shNC group and the shLBP group (), whereas the OCR of cells in the shLBP-D group was dramatically higher than that in the shNC-D group (, p < 0.05). Similarly, no marked difference in [3H]-2DG uptake of MEFs was evidenced between the shNC group and the shLBP group (), while differentiated MEFs with transfection of shLBP notably elevated [3H]-2DG uptake in contrast to those with transfection of the empty vector (, p < 0.001).
Figure 3. LBP knockdown promoted oxygen consumption and glucose uptake in differentiated MEFs. (A) Schematic representation of oxygen consumption measurement in MEFs transfected with shLBP with or without differentiation induction using a Seahorse XF96 analyzer. (B) the OCR of MEFs transfected with shLBP without differentiation induction in different time was assessed through Seahorse XF96 analyzer. (C) the OCR of MEFs transfected with shLBP with differentiation induction in different time was assessed through Seahorse XF96 analyzer. (D and E) the Glucose uptake of MEFs transfected with shLBP without (D) or with (E) differentiation induction was determined by [3H]-2DG uptake assay. # p < 0.05, ### p < 0.001 vs. shNC-D group. All experiments were repeated independently at least three times. Data was performed as the means ± standard deviation.
![Figure 3. LBP knockdown promoted oxygen consumption and glucose uptake in differentiated MEFs. (A) Schematic representation of oxygen consumption measurement in MEFs transfected with shLBP with or without differentiation induction using a Seahorse XF96 analyzer. (B) the OCR of MEFs transfected with shLBP without differentiation induction in different time was assessed through Seahorse XF96 analyzer. (C) the OCR of MEFs transfected with shLBP with differentiation induction in different time was assessed through Seahorse XF96 analyzer. (D and E) the Glucose uptake of MEFs transfected with shLBP without (D) or with (E) differentiation induction was determined by [3H]-2DG uptake assay. # p < 0.05, ### p < 0.001 vs. shNC-D group. All experiments were repeated independently at least three times. Data was performed as the means ± standard deviation.](/cms/asset/2737dac0-f14e-48f1-a802-88ff2ded0b29/kccy_a_2169521_f0003_oc.jpg)
The knockdown of LBP promoted adipose browning and insulin sensitivity, while inhibited inflammation and autophagy in differentiated MEFs
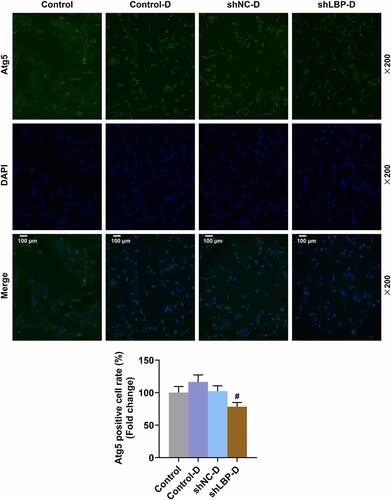
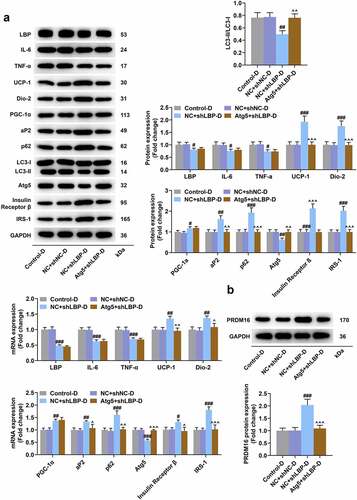
According to the results of Western blot and qRT-PCR, a significant down-regulation on the mRNA and protein expression of LC3-II/I, LBP, IL-6, TNF-α, and Atg5 yet an up-regulation of UCP-1, Dio-2, PGC-1α, aP2, p62, Insulin Receptor β, and IRS-1 in MEFs of shLBP-D group were displayed when compared with shNC-D group (, p < 0.01). PRDM16 is an important factor in transforming white adipocytes into beige adipocytes. PRDM16 protein expression was increased by shLBP-D as compared to shNC-D (, p < 0.001). In addition, based on the results of immunofluorescence assay, a similar result on Atg5 expression was detected as well ().
Figure 4. LBP knockdown promoted browning and insulin sensitivity while inhibiting inflammation and autophagy in differentiated MEFs. (A) the representative image of Western blot evaluating the protein and mRNA expressions of LBP, IL-6, TNF-α, UCP-1, Dio-2, PGC-1α, aP2, LC3-I, LC3-II, Atg5, Insulin Receptor β and IRS-1 were detected by Western blot and qRT-PCR after transfection of shLBP and differentiation induction. GAPDH was a loading control. (B) the protein expression of PRDM16were detected by Western blot after transfection of shLBP and differentiation induction. ## p < 0.01, ### p < 0.001 vs. shNC-D group. All experiments were repeated independently at least three times. Data was performed as the means ± standard deviation.
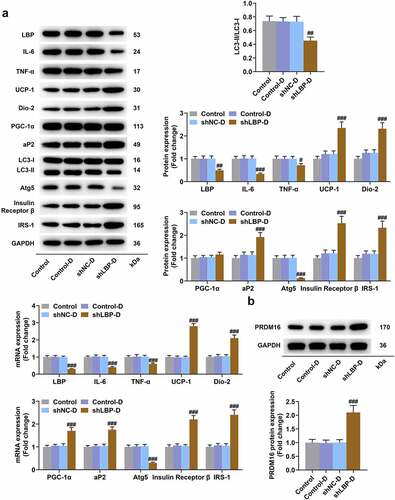
Figure 5. shLBP increased Atg5 level in differentiated MEFs. Atg5 level of MEFs was measured through immunofluorescence assay after transfection of shLBP and differentiation induction. All experiments were repeated independently at least three times. Data was performed as the means ± standard deviation.
The overexpression of Atg5 reversed the effects of LBP knockdown on adipose browning, oxygen consumption, insulin sensitivity, and autophagy in differentiated MEFs
As presented in , the prominently elevated Atg5 and reduced LBP at mRNA and protein levels were displayed in MEFs of Atg5+shLBP control (, p < 0.001) and Atg5+shLBP-D groups (, p < 0.001) when compared with their respective negative controls. It was exhibited in oil red staining assay that under the induction of differentiation, the morphological change from fusiform into round with appearance of lipid droplets in MEFs was found, and there was no notable difference in lipid droplets formed in differentiated MEF (). The mRNA and protein expression levels of UCP-1 in the shLBP-D group were higher than the shNC-D group (, p < 0.05), which was reversed by Atg5 transfection (, p < 0.05). Schematic representation of oxygen consumption measurements in MEFs transfected with Atg5 and shLBP with differentiation induction to assess the effects of knockdown of LBP and overexpression of Atg5 on the instantaneous respiration rate of MEFs (). Meanwhile, similar results were also displayed in the measurement of OCR (, p < 0.05). Besides, the transfection of Atg5 in differentiated MEFs reversed the effects of shLBP on declining mRNA and protein levels of LC3-II/I and Atg5 and raising those of UCP-1, Dio-2, aP2, P62, Insulin Receptor β, IRS-1, and PRDM16, whereas having no impact upon the levels of LBP, IL-6, TNF-α, and PGC-1α (, p < 0.05).
Figure 6. Co-transfection of Atg5 and shLBP decreased Atg5 and LBP and expression in MEFs with or without differentiation induction. (A and B) the mRNA and protein expressions of Atg5 and LBP were detected by qRT-PCR and Western blot after co-transfection of Atg5 and shLBP without (A) or with (B) differentiation induction. GAPDH was a loading control. *** p < 0.001 vs. NC +shnc group; ### p < 0.001 vs. NC +shnc-D group. All experiments were repeated independently at least three times. Data was performed as the means ± standard deviation.
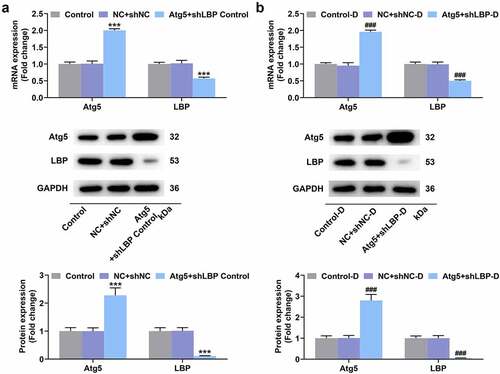
Figure 7. Atg5 overexpression reversed the effects of LBP knockdown on browning and oxygen consumption in differentiated MEFs. (A) the lipid in MEFs during differentiation induction was tested by oil red staining assay with transfection of Atg5 and shLBP (scale: 100 µm; magnification: ×200). (B) the mRNA and protein expressions of UCP-1 were detected by qRT-PCR and Western blot after transfection of Atg5 and shLBP with differentiation induction. GAPDH was a loading control. (E) Schematic representation of oxygen consumption measurement in MEFs transfected with Atg5 and shLBP with differentiation induction using a Seahorse XF96 analyzer. (F) OCR of MEFs transfected with Atg5 and shLBP with differentiation induction in different time was assessed through Seahorse XF96 analyzer. # p < 0.05 vs. NC +shnc-D group; ^ p < 0.05 vs. NC +shlbp-D group. All experiments were repeated independently at least three times. Data was performed as the means ± standard deviation.
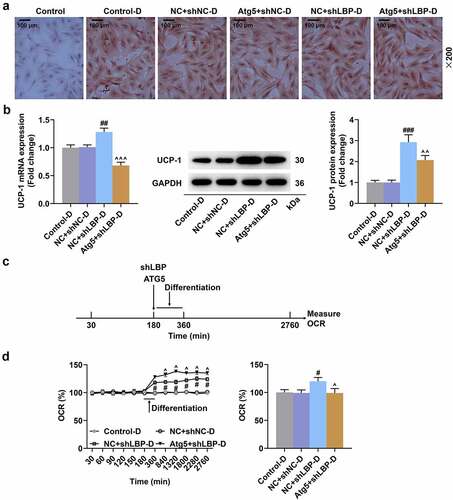
Figure 8. Atg5 overexpression reversed the effects of LBP knockdown on insulin sensitivity and autophagy in differentiated MEFs. (A) the representative image of Western blot evaluating the protein expressions of LBP, IL-6, TNF-α, UCP-1, Dio-2, PGC-1α, aP2, p62, LC3-I, LC3-II, Atg5, Insulin Receptor β and IRS-1 after transfection of Atg5 and shLBP with differentiation induction. GAPDH was a loading control. (B) the PRDM16 protein of was detected by Western blot after transfection of Atg5 and shLBP with differentiation induction. # p < 0.05, ## p < 0.01, ### p < 0.001 vs. NC +shnc-D group; ^^ p < 0.01, ^^^ p < 0.001 vs. NC +shlbp-D group. All experiments were repeated independently at least three times. Data was performed as the means ± standard deviation.
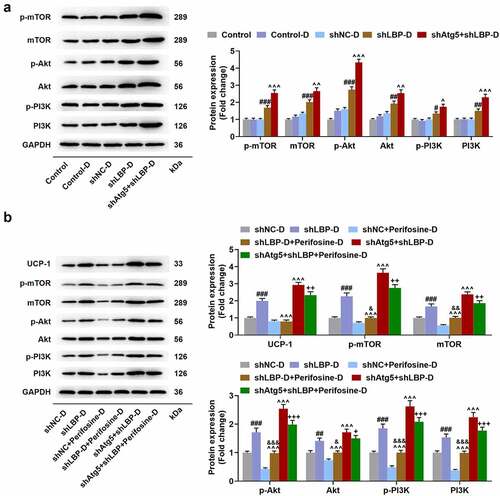
The depletion of Atg5 enhanced the effect of LBP knockdown on activating PI3K/Akt/mTOR pathway while Perifosine partly reversed the activation in differentiated MEFs
No significant difference of p-mTOR, mTOR, p-Akt, Akt, p-PI3K, and PI3K protein levels was found between Control and Control-D groups (). In comparison with the shNC-D group, silencing LBP appreciably increased p-mTOR, mTOR, p-Akt, Akt, p-PI3K, and PI3K levels in MEFs (, p < 0.05), and the depletion of Atg5 in MEFs further enhanced the effects of silencing LBP (, p < 0.05). Additionally, the treatment of Perifosine down-regulated the protein expression levels of UCP-1, p-mTOR, mTOR, p-Akt, Akt, p-PI3K, and PI3K in MEFs when compared with shLBP-D group (, p < 0.001), while led to an upregulation in contrast with Perifosine-D group (, p < 0.05). Besides, the protein expressions of UCP-1, p-mTOR, mTOR, p-Akt, Akt, p-PI3K, and PI3K MEFs in shAtg5+shLBP+Perifosine-D group were lower than those in shAtg5+shLBP-D group (, p < 0.05).
Figure 9. Atg5 knockdown enhanced the effect of LBP knockdown on activating PI3K/Akt/mTOR pathway while Perifosine partly reversed PI3K/Akt/mTOR pathway activation caused by LBP knockdown in differentiated MEFs. (A) the protein expressions of p-mTOR, mTOR, p-Akt, Akt, p-PI3K and PI3K were evaluated through Western blot after transfection of shAtg5 and shLBP with differentiation induction. GAPDH was a loading control. (B) the protein expressions of UCP-1, p-mTOR, and mTOR were evaluated through Western blot after transfection of shAtg5 and shLBP with differentiation induction as well as treatment of Perifosine. GAPDH was a loading control. # p < 0.05, ## p < 0.01, ### p < 0.001 vs. shNC-D group; ^ p < 0.05, ^^ p < 0.01, ^^^ p < 0.001 vs. shLBP-D group; & p < 0.05, && p < 0.01, &&& p < 0.001 vs. Perifosine-D group; + p < 0.05, ++ p < 0.01, +++ p < 0.001 vs. shAtg5+shlbp-D group. All experiments were repeated independently at least three times. Data was performed as the means ± standard deviation.
Discussion
Obesity is a major public health problem that affects over half a billion people around the world and should be settled down urgently [Citation48]. As a kind of adipose tissue exerting functions on the release of chemical energy by adaptive thermogenesis, BAT has been considered as an innovative and promising target for the management of obesity [Citation10,Citation11]. Former studies have shown that LBP plays a positive role in the development of obesity and related metabolic disturbance, and its knockdown induces weight loss, improves insulin sensitivity, and attenuates inflammation [Citation31,Citation39,Citation42,Citation43]. Also, LBP has been reported to negatively mediate the browning process of mouse and human adipose tissue [Citation40]. Based on that, the effects of LBP on adipose browning, oxygen consumption, and glucose uptake were investigated in the present paper, where the molecular mechanism involved has been expounded as well.
To explore the roles of LBP in adipose browning and metabolism, MEFs were induced to differentiate into adipocytes with BAT-like characteristics, and the transfection of shLBP was made to establish the model of gene silence at the same time. Located in mitochondria, UCP-1 is a characteristic protein of BAT, which fulfills a crucial function on the release of energy in the form of heat (thermogenesis) through uncoupling oxidative phosphorylation from synthesized adenosine triphosphate (ATP) [Citation49]. A prominent upregulation of the UCP-1 level has been exhibited in LBP-null mice and adipocytes treated with the silence of LBP [Citation40]. Similarly, it was presented in the results of our experiments that the transfection of shLBP appreciably elevated UCP-1 expression in differentiated MEFs, which implicated that knockdown of LBP promoted the differentiation of MEF toward adipose browning. In addition, shLBP had no impact on OCR and glucose uptake in MEFs, while evidently facilitated OCR and glucose uptake in MEFs with differentiation induction, the results of which was similar to a prior study concerning the promotive effect of rosiglitazone on the induction of adipose browning and enhancing β-adrenoceptor-mediated mitochondrial function and glucose uptake [Citation7]. Also, it was suggested that silencing LBP specifically acts on adipocytes to achieve its promotive effect on the metabolism. In addition to the down-regulation of LBP and upregulation of UCP-1 in MEFs with the induction of differentiation and the transfection of shLBP, the increased levels of Dio-2 and PGC-1α were observed in our study as well, similar to the results acquired in researches with regard to the two factors in patients with HIV lipodystrophy and mice receiving ketone ester diet [Citation50,Citation51]. Like UCP-1, Dio-2 and PGC-1α are two markers of mitochondrial uncoupling and thermogenesis [Citation51]. Dio-2 is a deiodinase that raises the local density of active T3 through deiodination of T4 in adipose tissue so as to advance UCP1-mediated thermogenesis [Citation52]. Well-known as a vital positive modulator of stimulated or regulated mitochondrial activity in mammals, PGC-1α is highly regulated at the transcriptional level under physiological or pathological processes characterized by increased energy consumption comprising adaptive thermogenesis (e.g. cold exposure) in BAT [Citation53,Citation54]. Those data in our study further verified the knockdown of LBP facilitated adipose browning on the molecular level. It has been reported that obesity is related to inflammation, in which LBP is also implicated [Citation55]. Through the detection of Western blot and qRT-PCR, IL-6 and TNF-α, both critical pro-inflammatory factors inducing intense inflammatory reaction [Citation56] were reduced in differentiated MEFs transfected with shLBP, which indicated that silencing of LBP was able to restrain inflammation. On the contrary, aP2, a metabolism related gene, its level was upregulated after silencing of LBP in our research, revealing the molecular event of increased glucose uptake in differentiated MEFs and suggesting that knockdown of LBP could ameliorate the metabolism of glucose and lipid. Insulin Receptor β and IRS-1 are essential parts of the insulin pathway, in which IRS-1 exerts a key function on regulating insulin signals, which trigger the gene expression of UCP-1 and the lipid synthesis in the BAT of mouse [Citation57,Citation58]. In agreement with the investigation on the effects of hemin in insulin sensitivity and lipid metabolism [Citation57], a marked rise of Insulin Receptor β and IRS-1 was evidenced in our experiments, implicating that the knockdown of LBP activated insulin pathway and improved insulin sensitivity.
Referring to autophagy, an evolutionarily conserved process of self-renewal and self-repair under stress reaction, is important for the maintenance of intracellular homeostasis, including differentiation, metabolism, as well as balance of energy intake and consumption, by which organelles, protein, macromolecules, and ribosomes are degraded and packed into lysosomes for recycling [Citation59]. Researches have revealed that autophagy is significantly increased and has a positive correlation with the degree of obesity in obese people [Citation60,Citation61]. Additionally, an obviously elevated autophagy was confirmed in LPS-treated MEFs with differentiation into white adipocytes [Citation62] and inhibiting autophagy via the knockdown of Atg7 promoted browning of adipocytes [Citation63,Citation64]. Besides, it has been demonstrated that a reversion to WAT-like characteristics accompanied by down-regulated UCP-1 will occur following the elimination of the stimuli (cold exposure, β3-AR agonist, etc.) [Citation65,Citation66], under which circumstance the inhibition of autophagy can maintain the process of adipose browning [Citation67]. Hence, we supposed that LBP might modulate adipose browning through autophagy. In our study, the knockdown of LBP evidently decreased the expressions of LC3-I/II and Atg5 in differentiated MEFs. LC3 is considered to be a marker of autophagy, which contains two forms: LC3 I and LC3 II, and the former is the precursor of the latter. During the procedure of autophagy, LC3 I is activated so as to facilitate the production of LC3 II, thereby inducing autophagy [Citation68]. Belonging to autophagy-related genes, Atg5 is pivotal for the formation of autophagosome and the onset and progression of autophagy [Citation69]. The findings in our study showed a suppressive effect of LBP knockdown on autophagy in adipose browning, implying that autophagy was possibly related to LBP knockdown-mediated adipose browning in MEFs.
We then co-transfected Atg5 and shLBP into differentiated MEFs as a reversing verification to explore whether LBP regulates adipose browning via autophagy in MEFs, the results of which showed that Atg5 overexpression had no effect on the inflammation, while reversed the effects of silencing LBP on advancing adipose browning, raising oxygen consumption, ameliorating insulin sensitivity, and repressing autophagy in differentiated MEFs, reflecting that the silence of LBP inhibited autophagy to mediate adipose browning and metabolism in MEFs.
It has been reported that enhanced autophagy and attenuated mTOR signaling were displayed in adipocytes of obese patients with type 2 diabetes [Citation70]. As a vital modulator of autophagy owing to its ability to regulate growth factor, nutrient states, sense stress as well as lysosomal function, mTOR usually acts as the downstream of PI3K/AKT pathway, playing a fundamental part in cells through the participation in diverse biological processes including physiology and pathology [Citation71]. A number of signal transduction pathways are involved in the regulation of autophagy, and among these pathways, some pathways converge at the mTOR [Citation72]. Autophagy activation impairs metastasis in hepatocellular carcinoma cells through the PI3K/Akt/mTOR pathway [Citation73]. BAT activation was stimulated through mitochondrial biogenesis and mTOR-mediated mitophagy [Citation74]. LPS/LBP-induced effects were partially inhibited by adding PI3K inhibitors in human gingival fibroblasts [Citation75]. In our study, the knockdown of the LBP activated PI3K/Akt/mTOR signaling pathway, which was reinforced by the silence of Atg5, with differentiation having no impact upon that pathway, which implicated that the PI3K/Akt/mTOR signaling pathway might also be involved in the LBP-mediated mechanism in differentiated MEFs. To test that hypothesis, Perifosine, an Akt inhibitor, was adopted in the following experiments, the results of which exhibited that Perifosine could partly reversed the activation of PI3K/Akt/mTOR pathway and adipose browning mediated by the knockdown of LBP. Even if, further mechanistic study would be performed in the future to support signaling pathway for LBP-mediated browning using agonism and antagonism.
In summary, the present study determined the positive role of LBP knockdown in the adipose browning of MEFs and the metabolism involved in that process, and further elucidated that the functions of LBP knockdown were achieved by inhibiting autophagy and activating PI3K/Akt/mTOR pathway. Our research might provide some novel ideas for the management of obesity and related diseases.
Availability of data and materials
The analyzed data sets generated during the study are available from the corresponding author on reasonable request.
Acknowledgements
Not applicable
Disclosure statement
No potential conflict of interest was reported by the author(s).
Additional information
Funding
References
- Coronado-Cáceres LJ, Rabadán-Chávez G, Mojica L, et al. Cocoa (Theobroma cacao L.) seed proteins’ anti-obesity potential through lipase inhibition using in silico, in vitro and in vivo models. Vitro and in vivo Models Foods (Basel, Switzerland). 2020 Sep 25;9(10):1359. PubMed PMID: 32992701; PubMed Central PMCID: PMCPMC7599879. eng.
- Flegal KM, Kit BK, Orpana H, et al. Association of all-cause mortality with overweight and obesity using standard body mass index categories: a systematic review and meta-analysis. JAMA. 309(1). PubMed PMID: 23280227; PubMed Central PMCID: PMCPMC4855514. eng. 71–82. 2013 Jan 2.
- Moon Y, Tong T, Kang W, et al. Filbertone ameliorates adiposity in mice fed a high-fat diet via activation of CAMP signaling. Nutrients. 2019 Jul 30;11(8):1749. PubMed PMID: 31366045; eng.
- Engin A. Adiponectin-resistance in obesity. Adv Exp Med Biol. 2017;960:415–441. PubMed PMID: 28585210; eng.
- Barazzoni R, Gortan Cappellari G, Ragni M, et al. Insulin resistance in obesity: an overview of fundamental alterations. Eat Weight Disord. 2018 Apr;23(2):149–157. PubMed PMID: 29397563; eng.
- Smith GI, Mittendorfer B, Klein S. Metabolically healthy obesity: facts and fantasies. J Clin Investig. 129(10): PubMed PMID: 31524630; PubMed Central PMCID: PMCPMC6763224 funding from Merck Sharp & Dohme Corp. and Janssen Pharmaceuticals, and has served as a consultant for Pfizer, Novo Nordisk, and Merck Sharp & Dohme Corp. eng:3978–3989. 2019 Oct 1.
- Merlin J, Sato M, Nowell C, et al. The PPARγ agonist rosiglitazone promotes the induction of brite adipocytes, increasing β-adrenoceptor-mediated mitochondrial function and glucose uptake. Cell Signal 2018 Jan;42:54–66. PubMed PMID: 28970184; eng
- Ronti T, Lupattelli G, Mannarino E. The endocrine function of adipose tissue: an update. Clinical endocrinol. 2006 Apr;64(4):355–365. PubMed PMID: 16584505; eng.
- Rosen ED, Spiegelman BM. Adipocytes as regulators of energy balance and glucose homeostasis. Nature. 444(7121): PubMed PMID: 17167472; PubMed Central PMCID: PMCPMC3212857. eng:847–853. 2006 Dec 14.
- Virtanen KA, Lidell ME, Orava J, et al. Functional brown adipose tissue in healthy adults. N Engl J Med. 360(15). PubMed PMID: 19357407; eng. 1518–1525. 2009 Apr 9.
- Cypess AM, Lehman S, Williams G, et al. Identification and importance of brown adipose tissue in adult humans. N Engl J Med. 360(15). PubMed PMID: 19357406; PubMed Central PMCID: PMCPMC2859951. eng. 1509–1517. 2009 Apr 9.
- Miao Y, Qin H, Zhong Y, et al. Novel adipokine asprosin modulates browning and adipogenesis in white adipose tissue. J Endocrinol. 2021 May;249(2):83–93. PubMed PMID: 33705351.
- Lucchini FC, Wueest S, Challa TD, et al. ASK1 inhibits browning of white adipose tissue in obesity. Nat Commun. 11(1). PubMed PMID: 32242025. 1642. 2020 Apr 2.
- Guo F, Zhu Y, Han Y, et al. DEPP deficiency contributes to browning of white adipose tissue. Int J Mol Sci. 2022 Jun 12:23(12): DOI:10.3390/ijms23126563 PubMed PMID: 35743009.
- Ikeda K, Yamada T. UCP1 Dependent and Independent Thermogenesis in Brown and Beige Adipocytes. Front Endocrinol (Lausanne). 2020;11:498. PubMed PMID: 32849287; PubMed Central PMCID: PMCPMC7399049. eng.
- Stanford KI, Middelbeek RJ, Townsend KL, et al. Brown adipose tissue regulates glucose homeostasis and insulin sensitivity. J Clin Investig. 2013 Jan;123(1):215–223. PubMed PMID: 23221344; PubMed Central PMCID: PMCPMC3533266. eng.
- Hansen JB, Kristiansen K. Regulatory circuits controlling white versus brown adipocyte differentiation. Biochem J. 398(2): PubMed PMID: 16898874; PubMed Central PMCID: PMCPMC1550312. eng:153–168. 2006 Sep 1.
- van Marken Lichtenbelt WD, Vanhommerig JW, Smulders NM, et al. Cold-activated brown adipose tissue in healthy men. N Engl J Med. 2009 Apr 9;360(15):1500–1508. PubMed PMID: 19357405; eng.
- Qian SW, Tang Y, Li X, et al. BMP4-mediated brown fat-like changes in white adipose tissue alter glucose and energy homeostasis. Proc Natl Acad Sci USA. 2013 Feb 26 110(9):E798–807. PubMed PMID: 23388637; PubMed Central PMCID: PMCPMC3587258. eng
- Chondronikola M, Volpi E, Børsheim E, et al. Brown adipose tissue improves whole-body glucose homeostasis and insulin sensitivity in humans. Diabetes. 2014 Dec;63(12):4089–4099. PubMed PMID: 25056438; PubMed Central PMCID: PMCPMC4238005. eng.
- Seale P, Conroe HM, Estall J, et al. Prdm16 determines the thermogenic program of subcutaneous white adipose tissue in mice. J Clin Investig. 2011 Jan;121(1):96–105. PubMed PMID: 21123942; PubMed Central PMCID: PMCPMC3007155. eng.
- Lee P, Smith S, Linderman J, et al. Temperature-acclimated brown adipose tissue modulates insulin sensitivity in humans. Diabetes. 2014 Nov;63(11):3686–3698. PubMed PMID: 24954193; PubMed Central PMCID: PMCPMC4207391. eng.
- Carobbio S, Rosen B, Vidal-Puig A. Adipogenesis: new insights into brown adipose tissue differentiation. J Mol Endocrinol. 2013 Dec;51(3):T75–85. PubMed PMID: 24041933; eng.
- De Matteis R, Lucertini F, Guescini M, et al. Exercise as a new physiological stimulus for brown adipose tissue activity. Nutr Metab Cardiovasc Dis. 2013 Jun;23(6):582–590. PubMed PMID: 22633794; eng.
- Ghorbani M, Claus TH, Himms-Hagen J. Hypertrophy of brown adipocytes in brown and white adipose tissues and reversal of diet-induced obesity in rats treated with a beta3-adrenoceptor agonist. Biochem Pharmacol. 1997 Jul 1;54(1):121–131. PubMed PMID: 9296358; eng.
- Bartelt A, Heeren J. Adipose tissue browning and metabolic health. Nat Rev Endocrinol. 2014 Jan;10(1):24–36. PubMed PMID: 24146030; eng.
- Kaisanlahti A, Glumoff T. Browning of white fat: agents and implications for beige adipose tissue to type 2 diabetes. J Physiol Biochem. 2019 Feb;75(1):1–10. PubMed PMID: 30506389; PubMed Central PMCID: PMCPMC6513802. eng.
- Rodrigues AR, Salazar MJ, Rocha-Rodrigues S, et al. Peripherally administered melanocortins induce mice fat browning and prevent obesity. Int J Obes (Lond). 2019 May;43(5):1058–1069. PubMed PMID: 30018312.
- Kang J, Park J, Park WY, et al. A phytoestrogen secoisolariciresinol diglucoside induces browning of white adipose tissue and activates non-shivering thermogenesis through AMPK pathway. Pharmacol Res 2020 Aug;158:104852. PubMed PMID: 32438038; eng
- Saghafi-Asl M, Mirmajidi S, Asghari Jafarabadi M, et al. The association of dietary patterns with dietary inflammatory index, systemic inflammation, and insulin resistance, in apparently healthy individuals with obesity. Sci Rep. 11(1). PubMed PMID: 33824355; PubMed Central PMCID: PMCPMC8024341. eng. 7515. 2021 Apr 6.
- Sun L, Yu Z, Ye X, et al. A marker of endotoxemia is associated with obesity and related metabolic disorders in apparently healthy Chinese. Diabetes Care. 2010 Sep;33(9):1925–1932. PubMed PMID: 20530747; PubMed Central PMCID: PMCPMC2928335. eng.
- Gonzalez-Quintela A, Alonso M, Campos J, et al. Determinants of serum concentrations of lipopolysaccharide-binding protein (LBP) in the adult population: the role of obesity. PLoS ONE. 2013;8(1):e54600. PubMed PMID: 23349936; PubMed Central PMCID: PMCPMC3551812. eng.
- Jialal I, Devaraj S, Bettaieb A, et al. Increased adipose tissue secretion of Fetuin-A, lipopolysaccharide-binding protein and high-mobility group box protein 1 in metabolic syndrome. Atherosclerosis. 2015 Jul;241(1):130–137. PubMed PMID: 25978344; eng.
- Liu X, Lu L, Yao P, et al. Lipopolysaccharide binding protein, obesity status and incidence of metabolic syndrome: a prospective study among middle-aged and older Chinese. Diabetologia. 2014 Sep;57(9):1834–1841. PubMed PMID: 24906952; eng.
- Zhou H, Hu J, Zhu Q, et al. Lipopolysaccharide-binding protein cannot independently predict type 2 diabetes mellitus: a nested case-control study. J Diabetes. 2016 Mar;8(2):214–219. PubMed PMID: 25753130; eng.
- Ruiz AG, Casafont F, Crespo J, et al. Lipopolysaccharide-binding protein plasma levels and liver TNF-alpha gene expression in obese patients: evidence for the potential role of endotoxin in the pathogenesis of non-alcoholic steatohepatitis. Obes Surg. 2007 Oct;17(10):1374–1380. PubMed PMID: 18000721; eng.
- van Dielen FM, Buurman WA, Hadfoune M, et al. Macrophage inhibitory factor, plasminogen activator inhibitor-1, other acute phase proteins, and inflammatory mediators normalize as a result of weight loss in morbidly obese subjects treated with gastric restrictive surgery. J Clin Endocrinol Metab. 2004 Aug;89(8):4062–4068. PubMed PMID: 15292349; eng.
- Moreno-Navarrete JM, Ortega F, Serino M, et al. Circulating lipopolysaccharide-binding protein (LBP) as a marker of obesity-related insulin resistance. Int J Obes (Lond). 2012 Nov;36(11):1442–1449. PubMed PMID: 22184060; eng.
- Moreno-Navarrete JM, Escoté X, Ortega F, et al. A role for adipocyte-derived lipopolysaccharide-binding protein in inflammation- and obesity-associated adipose tissue dysfunction. Diabetologia. 2013 Nov;56(11):2524–2537. PubMed PMID: 23963324; eng.
- Gavaldà-Navarro A, Moreno-Navarrete JM, Quesada-López T, et al. Lipopolysaccharide-binding protein is a negative regulator of adipose tissue browning in mice and humans. Diabetologia. 2016 Oct;59(10):2208–2218. PubMed PMID: 27344313; eng.
- Sallam T, Ito A, Rong X, et al. The macrophage LBP gene is an LXR target that promotes macrophage survival and atherosclerosis. J Lipid Res. 2014 Jun;55(6):1120–1130. PubMed PMID: 24671012; PubMed Central PMCID: PMCPMC4031943. eng.
- Moreno-Navarrete JM, Jové M, Padró T, et al. Adipocyte lipopolysaccharide binding protein (LBP) is linked to a specific lipidomic signature. Obesity (Silver Spring. Md). 2017 Feb;25(2):391–400. PubMed PMID: 28001010; eng.
- Moreno-Navarrete JM, Escoté X, Ortega F, et al. Lipopolysaccharide binding protein is an adipokine involved in the resilience of the mouse adipocyte to inflammation. Diabetologia. 2015 Oct;58(10):2424–2434. PubMed PMID: 26201685; eng.
- Tu WZ, Fu YB, Xie X. RepSox, a small molecule inhibitor of the TGFβ receptor, induces brown adipogenesis and browning of white adipocytes. Acta Pharmacol Sin. 2019 Dec;40(12):1523–1531. PubMed PMID: 31235818; PubMed Central PMCID: PMCPMC7471457. eng.
- Gatticchi L, Petricciuolo M, Scarpelli P, et al. Tm7sf2 gene promotes adipocyte differentiation of mouse embryonic fibroblasts and improves insulin sensitivity. Biochim Biophys Acta Mol Cell Res. 2021 Jan;1868(1):118897. PubMed PMID: 33121932; eng.
- Wang Q, Jin F, Zhang J, et al. Lipoxin A4 promotes adipogenic differentiation and browning of mouse embryonic fibroblasts. vitro cellular & developmental biology Animal. 2021 Dec;57(10):953–961. PubMed PMID: 34811702; eng.
- Livak KJ, Schmittgen TD. Analysis of relative gene expression data using real-time quantitative PCR and the 2(-Delta Delta C(T)) Method. Methods (San Diego. Calif). 2001 Dec;25(4):402–408. PubMed PMID: 11846609; eng.
- Bhurosy T, Jeewon R. Overweight and obesity epidemic in developing countries: a problem with diet, physical activity, or socioeconomic status? ScientificWorldjournal. 2014;2014:964236. PubMed PMID: 25379554; PubMed Central PMCID: PMCPMC4212551. eng.
- Junker D, Syväri J, Weidlich D, et al. Investigation of the Relationship between MR-Based Supraclavicular Fat Fraction and Thyroid Hormones. Obes Facts. 2020;13(3):331–343. PubMed PMID: 32564012; PubMed Central PMCID: PMCPMC7445585. eng.
- Torriani M, Fitch K, Stavrou E, et al. Deiodinase 2 expression is increased in dorsocervical fat of patients with HIV-associated lipohypertrophy syndrome. J Clin Endocrinol Metab. 2012 Apr;97(4):E602–7. PubMed PMID: 22259052; PubMed Central PMCID: PMCPMC3319185. eng.
- Davis RAH, Deemer SE, Bergeron JM, et al. Dietary R, S-1,3-butanediol diacetoacetate reduces body weight and adiposity in obese mice fed a high-fat diet. FASEB J. 2019 Feb;33(2):2409–2421. PubMed PMID: 30303740; PubMed Central PMCID: PMCPMC6338649. eng.
- Zhu Q, Ghoshal S, Tyagi R, et al. Global IP6K1 deletion enhances temperature modulated energy expenditure which reduces carbohydrate and fat induced weight gain. Mol Metabol. 2017 Jan;6(1):73–85. PubMed PMID: 28123939; PubMed Central PMCID: PMCPMC5220553. eng.
- Ye Q, Chen C, Si E, et al. Mitochondrial Effects of PGC-1alpha Silencing in MPP(+) Treated Human SH-SY5Y Neuroblastoma Cells. Front Mol Neurosci. 2017;10:164. PubMed PMID: 28611589; PubMed Central PMCID: PMCPMC5447087. eng.
- Liesa M, Borda-D’Agua B, Medina-Gómez G, et al. Mitochondrial fusion is increased by the nuclear coactivator PGC-1beta. PLoS ONE. 2008;3(10):e3613. PubMed PMID: 18974884; PubMed Central PMCID: PMCPMC2570954 Astra Zeneca R&D. eng.
- Huang CJ, Stewart JK, Shibata Y, et al. Lipopolysaccharide-binding protein and leptin are associated with stress-induced interleukin-6 cytokine expression ex vivo in obesity. Psychophysiology. 2015 May;52(5):687–694. PubMed PMID: 25424507; eng.
- Wang K, Lv Q, Miao YM, et al. Cardamonin, a natural flavone, alleviates inflammatory bowel disease by the inhibition of NLRP3 inflammasome activation via an AhR/Nrf2/NQO1 pathway. Biochem Pharmacol. 2018 Sep;155:494–509. PubMed PMID: 30071202; eng.
- Luan Y, Zhang F, Cheng Y, et al. Hemin Improves Insulin Sensitivity and Lipid Metabolism in Cultured Hepatocytes and Mice Fed a High-Fat Diet. Nutrients. 2017 Jul 26:9(8): DOI:10.3390/nu9080805 PubMed PMID: 28933767; PubMed Central PMCID: PMCPMC5579599. eng.
- Arribas M, Valverde AM, Benito M. Role of IRS-3 in the insulin signaling of IRS-1-deficient brown adipocytes. J Biol Chem. 278(46): PubMed PMID: 12944402; eng:45189–45199. 2003 Nov 14.
- Levine B, Kroemer G. Autophagy in the pathogenesis of disease. Cell. 132(1): PubMed PMID: 18191218; PubMed Central PMCID: PMCPMC2696814. eng:27–42. 2008 Jan 11.
- Jansen HJ, van Essen P, Koenen T, et al. Autophagy activity is up-regulated in adipose tissue of obese individuals and modulates proinflammatory cytokine expression. Endocrinology. 2012 Dec;153(12):5866–5874. PubMed PMID: 23117929; eng.
- Kosacka J, Kern M, Klöting N, et al. Autophagy in adipose tissue of patients with obesity and type 2 diabetes. Mol Cell Endocrinol PubMed PMID: 25818883; eng 2015 Jul 5;409:21–32.
- Unuma K, Aki T, Funakoshi T, et al. Extrusion of mitochondrial contents from lipopolysaccharide-stimulated cells: involvement of autophagy. Autophagy. 2015;11(9):1520–1536. PubMed PMID: 26102061; PubMed Central PMCID: PMCPMC4590602. eng.
- Zhang Y, Goldman S, Baerga R, et al. Adipose-specific deletion of autophagy-related gene 7 (atg7) in mice reveals a role in adipogenesis. Proc Natl Acad Sci USA. 106(47). PubMed PMID: 19910529; PubMed Central PMCID: PMCPMC2785257. eng. 19860–19865. 2009 Nov 24.
- Singh R, Xiang Y, Wang Y, et al. Autophagy regulates adipose mass and differentiation in mice. J Clin Investig. 2009 Nov;119(11):3329–3339. PubMed PMID: 19855132; PubMed Central PMCID: PMCPMC2769174. eng.
- Rosenwald M, Perdikari A, Rülicke T, et al. Bi-directional interconversion of brite and white adipocytes. Nat Cell Biol. 2013 Jun;15(6):659–667. PubMed PMID: 23624403; eng.
- Gospodarska E, Nowialis P, Kozak LP. Mitochondrial turnover: a phenotype distinguishing brown adipocytes from interscapular brown adipose tissue and white adipose tissue. J Biol Chem. 290(13): PubMed PMID: 25645913; PubMed Central PMCID: PMCPMC4375480. eng:8243–8255. 2015 Mar 27.
- Altshuler-Keylin S, Shinoda K, Hasegawa Y, et al. Beige Adipocyte Maintenance is Regulated by Autophagy-Induced Mitochondrial Clearance. Cell Metab. 24(3). PubMed PMID: 27568548; PubMed Central PMCID: PMCPMC5023491. eng. 402–419. 2016 Sep 13.
- Pang Y, Pan L, Zhang Y, et al. TP53BP2 decreases cell proliferation and induces autophagy in neuroblastoma cell lines. Oncol Lett. 2019 Jun;17(6):4976–4984. PubMed PMID: 31186708; PubMed Central PMCID: PMCPMC6507348. eng.
- Qin Y, Sun W, Wang Z, et al. ATF2-Induced lncRNA GAS8-AS1 Promotes Autophagy of Thyroid Cancer Cells by Targeting the miR-187-3p/atg5 and miR-1343-3p/atg7 Axes. Mol Ther Nucl Acids. 2020 Dec 4:22:584–600. PubMed PMID: 33230459; PubMed Central PMCID: PMCPMC7562962. eng.
- Ost A, Svensson K, Ruishalme I, et al. Attenuated mTOR signaling and enhanced autophagy in adipocytes from obese patients with type 2 diabetes. Mol Med (Cambridge, MA). 2010 Jul-Aug;16(7–8):235–246. PubMed PMID: 20386866; PubMed Central PMCID: PMCPMC2896460. eng.
- Meng J, Chen Y, Wang J, et al. EGCG protects vascular endothelial cells from oxidative stress-induced damage by targeting the autophagy-dependent PI3K-AKT-mTOR pathway. Ann translat Med. 2020 Mar;8(5):200. PubMed PMID: 32309347; PubMed Central PMCID: PMCPMC7154459. eng.
- Wang Y, Zhang H. Regulation of Autophagy by mTOR Signaling Pathway. Adv Exp Med Biol. 2019;1206:67–83. PubMed PMID: 31776980; eng.
- Zhang M, Liu S, Chua MS, et al. SOCS5 inhibition induces autophagy to impair metastasis in hepatocellular carcinoma cells via the PI3K/Akt/mTOR pathway. Sun, C. 2019 Aug 13 10(8):612. PubMed PMID: 31406106
- Yau WW, Singh BK, Lesmana R, et al. Thyroid hormone (T(3)) stimulates brown adipose tissue activation via mitochondrial biogenesis and MTOR-mediated mitophagy. Autophagy. 2019 Jan;15(1):131–150. PubMed PMID: 30209975; PubMed Central PMCID: PMCPMC6287687. eng.
- Takahashi N, Kobayashi M, Takaki T, et al. Actinobacillus actinomycetemcomitans lipopolysaccharide stimulates collagen phagocytosis by human gingival fibroblasts. Oral Microbiol Immunol. 2008 Jun;23(3):259–264. PubMed PMID: 18402614; eng.