
ABSTRACT
Based on the results of epidemiological and preclinical studies, metformin can improve the prognosis of patients with malignant tumors. Studies have confirmed that metformin inhibits multiple myeloma (MM) cell proliferation and promotes apoptosis. Nevertheless, the specific mechanism remains to be elucidated. MM cells were intervened with different doses of metformin to detect cell proliferation and apoptosis. Western blotting and RT-qPCR were employed to assess the expression of METTL3, METTL14, WTAP, FTO, and ALKBH5 after metformin intervention. The microarray dataset GSE29023 was retrieved from the Gene Expression Omnibus (GEO) database and calculated using the R language (limma package) to authenticate differentially expressed genes (DEGs). The database for annotation, visualization, and integrated discovery (David) was applied for GO annotation analysis of DEGs. Subsequently, the string database and Cytoscape software were applied to construct protein–protein interaction (PPI) and DEM hub gene networks. Bioinformatics analysis and MeRIP were applied to predict and test METTL3-mediated m6A levels on mRNA of THRAP3, RBM25, and USP4 in METTL3 knocked-down cells. Then rescue experiments were performed to explore effects of METTL3 and THRAP3, RBM25, or USP4 on cell proliferation and apoptosis. The effect on MM cell xenograft tumor growth was observed by injection of metformin or/and overexpression of METTL3 in in vivo experiments. Metformin decreased cell proliferation and encouraged cell apoptosis in a dose-dependent manner. Global m6A modification was elevated in MM cells compared to normal cells, which was counteracted by metformin treatment. Furthermore, THRAP3, RBM25, and USP4 were identified as possible candidate genes for metformin treatment by GSE29023 data mining. METTL3 interference impaired m6A modification on mRNA of THRAP3, RBM25, and USP4 as well as expression levels. The mRNA stability and expression of THRAP3, RBM25, and USP4 was decreased after metformin treatment, which was reversed by METTL3 overexpression. THRAP3, RBM25 or USP4 knockdown reversed the assistance of METTL3 overexpression on the malignant behavior of MM cells. Finally, upregulation of METTL3 was shown to exert facilitative effects on xenograft tumor growth by blocking metformin injection. The present study demonstrates that metformin can repress the expression of THRAP3, RBM25, and USP4 by inhibiting METTL3-mediated m6A modification, which in turn hamper cell proliferation and promotes cell apoptosis.
Abbreviations: multiple myeloma (MM), Gene Expression Omnibus (GEO), differentially expressed genes (DEGs), database for annotation, visualization and integrated discovery (David), protein–protein interaction (PPI), epithelial‑mesenchymal transition (EMT), methyltransferase like 3 (METTL3), methyltransferase like 14 (METTL14), wilms tumor 1-associated protein (WTAP), methyltransferase like 16 (METTL16), acute myeloid leukemia (AML), non-small lung cancer (NSCLC), glioma stem cells (GSCs), normal bone marrow-derived plasma cells (nPCs), false discovery rate (FDR), biological process (BP), optical density (OD), horseradish peroxidase (HRP), M6A RNA immunoprecipitation assay (MeRIP).
1. Introduction
Multiple myeloma (MM) is the second most common malignancy of the hematological system, derived from malignant clonal proliferations of the B-lymphoid cell line [Citation1]. MM is a heterogeneous disease with diverse clinical manifestations, such as bone destruction, anemia, hypercalcemia, renal failure, and immune dysfunction [Citation2]. Although MM disease deterioration could currently be alleviated by chemotherapeutic agents, radiotherapy, and cellular immunity combined with transplantation therapy, the overall survival of MM patients remains unsatisfactory, with a median survival of only 3–5 years, and elderly patients generally suffer from chemotherapy-induced adverse effects [Citation3]. Therefore, it is urgent to explore some novel therapeutic options and find effective and low side effect drugs to treat MM.
Metformin, a lipophilic biguanide, is a commonly used first-line glucose lowering drug in the clinic due to its safety and efficacy, and its main mechanism of action is to lower blood glucose levels by adding insulin sensitivity [Citation4]. In recent years, a large number of domestic and foreign studies have shown that metformin is not only significantly effective in controlling blood glucose levels in patients with diabetes and intervening in the treatment of people with impaired glucose tolerance, but also has been used in the clinical treatment of several cancers. Multiple studies have shown that metformin could decrease the incidence of tumors in patients with diabetes, that taking metformin provides greater benefit than insulin injection or treatment with other diabetes drugs, and could reduce tumor risk by more than 50%, which protective effect was positively correlated with its dose [Citation5]. Recently, accumulating evidence has shown that metformin can significantly improve the prognosis of patients with malignant tumors with the development of a series of clinical studies [Citation6,Citation7]. Research by Huan et al found that metformin and miR-365 synergistically encouraged apoptosis of gastric cancer cells through miR-365-PTEN -AMPK axis [Citation8]. Metformin could repress epithelial‑mesenchymal transition (EMT) and pancreatic cancer metastasis and neuro-invasion through the Smad or AKT/mTOR pathways [Citation9]. However, less data are available on the effects of metformin in MM. It has been shown that metformin could inhibit STAT signaling by hindering IL-6 expression, leading to suppression of metformin’s pro-tumor activity, which in turn restrain MM cell proliferation and facilitate apoptosis [Citation10]. Metformin accelerated MM cell apoptosis, and then arresting the cell cycle in the G1 phase [Citation11]. Grimaldi et al [Citation12] demonstrated that metformin inhibited MM cell proliferation by weakening the AKT/mTOR signaling pathway. Furthermore, Wang et al [Citation13] has discovered that metformin could significantly prolong disease progression-free survival in MM patients. Nevertheless, the specific molecular effects and mechanisms of metformin against MM have not been fully elucidated so far.
M6A, known as N6 methyladenylation, refers to the methyl modification that occurs at the sixth N position of adenine by the action of methyltransferases and is the most abundant post-transcriptional modification of mRNA, accounting for about 50% of the cases, mainly occurring near stop codons and 3 ‘untranslated (UTR) regions [Citation14,Citation15]. M6A is a dynamic and reversible process that can be regulated by three classes of proteins, including “writer”, “eraser”, and “reader” [Citation16]. Among them, “writer” is a methyltransferase that can drive m6A methylation of RNA, mainly including methyltransferase like 3 (METTL3), methyltransferase like 14 (METTL14), wilms tumor 1-associated protein (WTAP), RBM15 and methyltransferase like 16 (METTL16). Many researches have confrmed that m6A methylation is associated with the differentiation, proliferation, invasion, and metastasis of malignant tumors, and has a tumor promoting or suppressing effect [Citation17]. A study discovered that METTL3 and METTL14 are highly expressed in acute myeloid leukemia (AML) cells and that METTL3 can bind to the mRNA promoters to methylate mRNA and encourage AML exacerbation [Citation18]. In non-small lung cancer (NSCLC), SUMOylation of lysine residues of METTL3 could inhibit its activity and reduced m6A methylation, resulting in restraint of proliferation and clonogenic ability of NSCLC cells [Citation19]. Further, decreased m6A methylation was found in malignant glioma stem cells (GSCs), and downregulation of METTL3 or METTL14 could induce KLF4 and EphA3 mRNA expression and accelerate GSCs growth and proliferation [Citation20]. Che et al [Citation21]. suggested that METTL3 facilitated MM cell growth by elevating YY1 mRNA stability and primary miR-27a-3p maturation in vitro and in vivo. From the above studies, it is cleared that METTL3-mediated m6A methylation is closely related to the development of leukemia, lung cancer, liver cancer, breast cancer, and other tumors, and inhibition of m6A methylation holds great promise for cancer prevention and treatment. However, the specific mechanism of METTL3 involvement in MM remains to be further discussed.
Interestingly, a study finding suggested that METTL3 might be considered as a potential therapeutic target of metformin against breast cancer. This study points out that metformin can promote breast cancer cell proliferation by regulating p21 expression in an m6A dependent manner mediated by METTL3 in breast cancer cells [Citation22]. Thus, this study will revolve around the role and mechanism of metformin in regulating METTL3 mediated mRNA methylation in MM, aiming to elucidate whether metformin ameliorates MM development by regulating METTL3 involved m6A modification.
2. Materials and methods
2.1. Cell culture
Human MM cell lines H929 and MM.1S, and normal bone marrow-derived plasma cells (nPCs) were all purchased from American Type Culture Collection (ATCC) (Manassas, VA, USA). All cells were seeded in Dulbecco’s Modified Eagle Medium (DMEM) containing 10% fetal bovine serum (FBS, Gibco, CA), l × 105 U/L penicillin, and 100 mg/L streptomycin. Cell culture flasks were placed in a cell culture incubator at 37°C with 5% CO2 saturated humidity, and logarithmic growth phase cells were taken for experiments. Cells were passaged when they were confluent at approximately 75%.
2.2. Bioinformatics analysis
Microarray data are available with the accession numbers GSE29023 from Gene Expression Omnibus database (GEO, https://www.ncbi.nlm.nih.gov/geo/). The datasets GSE29023 was based on the platform GPL570, including 92 MM blood samples of MM patients and 23 normal blood samples. The difference analysis was performed using the limma package based on the R software, which employs the classical bayson’s t-test analysis method with filtering criteria: |log Fold Change|≥0.5, adjust P < 0.05. Targeted visualization of differential sites. The volcano plot was drawn by using the R language ggplot2 package to demonstrate the differentially expressed genes. Then, the Heatmap was plotted against the significantly upregulated versus significantly downregulated differentially expressed genes using the pheatmap package in the R language, and samples were clustered on the upper part of the Heatmap, and sites were clustered on the left side of the Heatmap. Subsequently, we applied the clusterProfiler software package to perform GO-biological process (BP) functional annotation analysis of the screened genes. Enrichment analysis of the transformed Entrez IDs was performed with the clusterProfiler package based on R software with the following filtering criteria: false discovery rate (FDR) (adjust P) < 0.05. Cytoscape software was used to construct the DEGs network diagram. In addition, m6A modification sites of THRAP3, RBM25 and USP4 were predicted by online analysis website (http://www.cuilab.cn/sramp).
2.3. Genetic overexpression and knockdown
The METTL3 full sequence was ligated into pcDNA3.1 plasmid (GenePharma, China). The shRNAs were designed by Qiagen to knock down METTL3, THRAP3, RBM25, and USP4. we designed a total of 4 different shRNAs against METTL3, sh28, sh933, sh1005, sh1365. To avoid off target effects, we selected the two best performing shRNAs (sh933 and sh1365) constructs into pLKO.1 vector. There are three shRNA targeting THRAP3 in this study, sh81, sh174, sh1380. To avoid off target effects, we selected the two best performing shRNAs (sh81 and sh174) constructs into pLKO.1 vector. There are four shRNAs targeting RBM25 in this study, sh5054, sh5729, sh6077, sh6468. To avoid off-target effects, we selected the two best performing shRNAs (sh5054 and sh6468) constructs into pLKO.1 vector. There are four shRNAs targeting USP4 in this study, sh5896, sh6254, sh6322, sh7463. To avoid off-target effects, we selected the two best performing shRNAs (sh5896 and sh6322) constructs into pLKO.1 vector. The sequences of shRNAs are displayed in Supplementary material. Moreover, when starting to prepare dilutions of transfection reagent, we use DMEM medium without serum but with antibiotics, as serum can affect complex formation and antibiotics are generally nontoxic to eukaryotic cells, avoiding cell staining. Confluent cells were diluted in DMEM medium, and the cells were observed to grow to about 70% confluence when the cell monolayer was covered with DMEM medium without serum but with antibiotics, plasmid transfection was performed by using Lipofectamine®3000 transfection reagent, and as required for the experiments, all cells in each group were collected for subsequent experiments after incubating in an incubator at 37°C with 5% CO2 for a specified period of times.
2.4. RNA extraction, reverse transcription, and quantitative real-time PCR
The MM cells from each group after transfection were collected, and Trizol (ThermoFisher, USA) was added to extract total cellular RNA according to the instructions of total RNA extraction reagent. After measurement of A260/A280 between 1.8 and 2.0. Total cellular RNA was reverse transcribed into cDNA using a reverse transcription Kit (Qiagen, Germany), with a 20 μL of reverse transcription reaction system including 0.2 μL of MMLV (200 U/μL), 1.2 μL of miR-RT primer (1 μmol/L), 0.75 μL of dNTP (10 mmol/L), 4 μL of 5×RT buffer, 10 μL of total RNA and 3.85 μL of RNase free ddH2O. The reaction conditions were as follows: 37°C for 30 min and 85°C for 10 min. PCR products were detected with Steponeplus real-time PCR system (Thermo Fisher, USA). The real-time PCR reaction system was 20 μL, including 1 μL of cDNA template, 0.5 μl each of upstream and downstream primers (10 μmol/L), 10 μL of SYBR GREEN mastermix, and 8 μL of RNase free ddH2O. GAPDH served as internal references. The relative expression levels were calculated by using 2−ΔΔCT method. The efficiency of the PCR should be between 90% and 110% (3.6 > slope >3.1). The sequences of each PCR primer in the current study are provided in Supplementary Table 1.
2.5. Western blotting
The cells were washed twice with ice-cold PBS and lysed using RIPA lysis buffer (CW Biotech, Beijing, China) supplemented with protease inhibitor (Roche Diagnostics, Basel, Switzerland). Then the protein concentration was measured by BCA protein assay kit (Thermo Fisher, USA). After denaturation for 10 min with the addition of loading buffer, 50 μg protein samples were subjected to SDS-PAGE and transferred onto PVDF membranes at 70 V for 30 min then 120 V for 90 min. The membrane was blocked with blocking solution (5% nonfat dry milk) for 2 h, TBST washed three times, specific primary antibodies were added, respectively. Then, the membranes were incubated with horseradish peroxidase (HRP)-conjugated goat anti-rabbit IgG (1:3000, Abcam, ab6721) for 1 h at room temperature. TBST washed three times followed by the addition of secondary antibodies, incubated on a shaker, after the membrane was cleaned and the protein exposure was performed, Image J software was applied to detect and analyze the gray values of protein bands on the membrane. The following primary antibodies: rabbit anti-β-actin (Abcam, ab8227), rabbit anti-METTL3 (Abcam, ab195352), rabbit anti-THRAP3 (Abcam, ab71985), rabbit anti-TOP1 (Abcam, ab109374), rabbit anti-RBM25 (Abcam, ab72237), rabbit anti-RPL14 (Abcam, ab181200), rabbit anti-SNRNP200 (Abcam, ab241589), rabbit anti-USP4 (Abcam, ab181105), rabbit anti-MYO1C (Abcam, ab194828), rabbit anti-PNISR (Abcam, ab275020), rabbit anti-EP300 (Abcam, ab275378). β-actin was used as an endogenous control.
2.6. CCK-8 assay
MM cells were seeded in 96 well culture plates at a cell number per well of 3 × 10³, and 5 replicate wells were set in each group. Transfection was performed after incubation at 37°C in 5% CO2 until the cells became adherent. Then, the cells were incubated at 37°C in a 5% CO2 incubator for 0, 24, 48, 72, 96, 120 h after which the supernatant was discarded and 100 μl of complete medium and 10 μL of CCK-8 (Sigma-Aldrich, St. Louis, MO, USA). After incubation at 37°C in 5% CO2 for 1 h, the optical density (OD) value at 450 nm was measured using a microplate reader (bio rad, Hercules, CA, USA).
2.7. Annexin V-FITC/PE assay
According to the manufacturer, cell suspension and 200 μl of binding buffer were added to 10 μl of annexin V-FITC and 5 μl of PE, protected from light for 15 min after mixing, and then 300 μl of binding buffer was added. Flow cytometry was performed using an argon ion laser beam at 488 nm.
2.8. RNA stability assay
Actinomycin D (act D, 5 μg/ml) was mixed in the cells. Total RNA was isolated, and then RT-qPCR was performed to measure the relative levels of THRAP3, RBM25, and USP4 as previously described.
2.9. Total m6A measurement
Total RNA from cells in each group was isolated using Trizol (Thermo Fisher, USA) according to the manufacturer’s instructions. M6A content was subsequently quantified using the EpiQuik m6A RNA methylation Quantification Kit (Epigentek, USA).
2.10. M6A RNA immunoprecipitation assay (MeRIP)
Total RNA from cells of each group was isolated, and an mRNA purification kit (Thermo Fisher, USA) was used to further enrich poly (A) + RNA, which was then treated using DNase I (Thermo Fisher, USA). Subsequently, the Magna methylated RNA immunoprecipitation (MeRIP) m6A kit (Thermo Fisher, USA) is employed to incubate global RNA with m6A antibodies for immunoprecipitation. Finally, RT-PCR was performed on extracted RNA using mRNA primers of THRAP3, RBM25, and USP4 and then normalized to input.
2.11. In vivo experiments
Animal experiments were approved and supervised by the Animal Ethics Committee of Fujian Medical University. 5-week-old male athymic BALB/C nude mice were obtained from Experimental animal center of Fujian Medical University, and subsequently randomly divided into four groups (5 mice per group), including control, metformin, pcDNA-METTL3 and pcDNA-METTL3 + metformin. For the control or metformin group, to induce tumors, 5 × 10⁵ H929 cells were suspended in 0.2 ml phosphate buffered saline and inoculated subcutaneously into the peritoneum of mice. Once the subcutaneous nodules grown to a rice grain size (required approximately a week), the subcutaneous xenograft model of MM in nude mice was successfully constructed. One week later, PBS or Metformin was diluted in drinking water (2 mg/ml) and administered orally throughout the indicated time periods. For the pcDNA-METTL3 group and pcDNA-METTL3 + metformin group, firstly, we transfected pcDNA-METTL3 into H929 cells to overexpress METTL3, and then 5 × 10⁵ H929 cells were suspended in 0.2 ml phosphate-buffered saline and inoculated subcutaneously into the peritoneum of mice. One week later, PBS or Metformin was diluted in drinking water (2 mg/ml) and administered orally throughout the indicated time periods. All nude mice were closely monitored for tumor growth, skin condition, and behavior daily and any tumor ulceration or irritation was noted. Tumor length and width were calculated with vernier calipers every 7 days. After 35 days, the mice were humanely sacrificed, and the subcutaneous tumors were excised and removed.
2.12. Statistical analysis
SPSS 22.0 and graphpad prism 7.0 were used for data analysis and mapping. Student’s t-test was used for comparison of two sample means, and analysis of variance was used for comparison of means of multiple groups, with P < 0.05 considered significant.
3. Results
3.1. Metformin impedes MM cell proliferation and promotes apoptosis
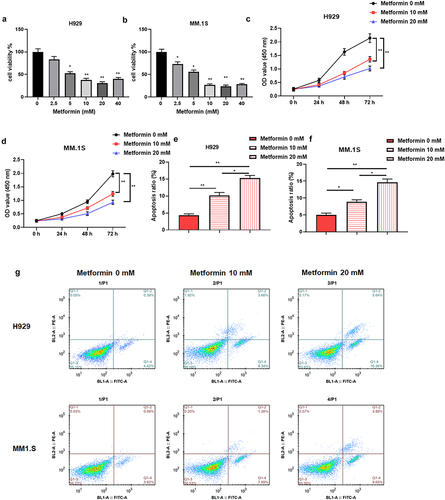
Metformin has been discovered to have inhibitory effects on the malignant behavior of MM [Citation23]. We repeated the same experiment by treating MM cells (H929 and MM.1S) with different doses (0, 2.5, 5, 10, 20, 40 mM) of metformin, and found that metformin at doses of 0–20 mM restrained the viability of MM cells in a dose-dependent manner (). Therefore, metformin at doses of 10 and 20 mM was selected for subsequent studies according to the lowest effective dose principle. Subsequently, 10 and 20 mM doses of metformin were used to further examine the proliferation of H929 and MM.1S cells at 0, 24, 48, and 72 h, as well as the cell apoptosis rate. The results revealed that metformin could repress cell proliferation in both dose- and time-dependent manners (), and facilitate cell apoptosis in dose-dependent manner ().
Figure 1. Metformin impedes MM cell proliferation and promotes apoptosis.
3.2. Metformin is able to reduce m6A abundance in MM
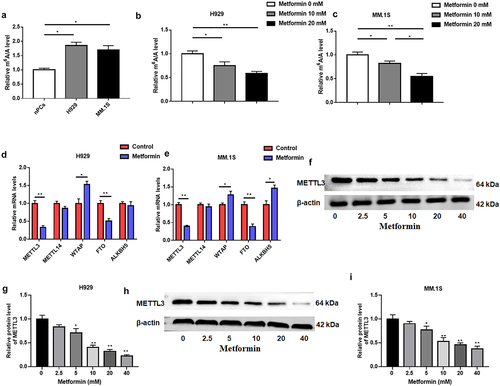
Next, m6A quantitative analysis was used to examine intracellular m6A levels, which were suggested to be increased in MM cell lines (). Furthermore, metformin treatment significantly reduced m6A levels in H929 and MM.1S cells (). m6A modification is mainly influenced by m6A methyltransferases, including METTL3, METTL14, WTAP, and demethylases FTO and ALKBH5. From this, we speculated that the aberrant m6A modification induced by metformin might be caused by the dysregulation of above m6A methylation key enzymes. RT-qPCR was applied to test the levels of m6A modifying enzymes METTL3, METTL14, WTAP, FTO, ALKBH5 in MM cells after metformin treatment for 48 h. We found that METTL3 mRNA level was memorably decreased and WTAP was significantly upregulated in MM cells after metformin treatment for 48 h (). However, ALKBH5 expression was upregulated in MM.1S but not in H929 cells (). Subsequently, we selected METTL3 as a candidate molecule for the aberrant m6A modification caused by metformin because it was positively correlated with m6A levels. Western blotting was estimated to examine METTL3 protein levels in H929 and MM.1S cells after metformin treatment for 48 h, which showed a substantial dose-dependent decrease in METTL3 protein expression after treating metformin ().
Figure 2. Metformin was able to reduce m6A abundance in MM.
3.3. METTL3 overexpression counteracts metformin-mediated suppression of MM cell proliferation and facilitative of cell apoptosis
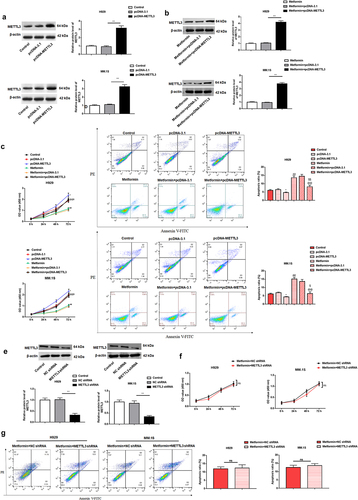
To explore whether metformin exerts its inhibitory effect on the malignant behavior of MM cells by inhibiting METTL3, we further assessed whether METTL3 and metformin are functionally relevant, pcDNA-METTL3 and pcDNA-3.1 vectors were individually transfected into H929, MM.1S cells and for 24 h, and then cells were intervened with 20 mM metformin. The efficiency of pcDNA-METTL3 on its level in H929, MM.1S cells was confirmed by Western blotting (). The results showed that transfection of pcDNA-METTL3 into cells increased METTL3 protein levels by about threefold, while it was up-regulated by nearly fourfold after transfection of pcDNA-METTL3 in metformin intervened cells. The growth curve generated by the CCK-8 assay showed a significant rise in cell OD value after METTL3 overexpression, suggesting cell proliferation was increased. And then metformin intervention conspicuously reversed the promotion of cell proliferation by METTL3 overexpression (). Further, apoptosis results revealed that the apoptotic rate of H929 and MM.1S was prominently decreased after METTL3 upregulation, which was reversed by metformin intervention (). Subsequently, we further investigated the effect of METTL3 downregulation on metformin sensitivity by transfecting METTL3 shRNA on the basis of metformin intervention in cells. shows the knockdown efficiency of METTL3 shRNA in H929 and MM.1S cells. By examining cell proliferation and apoptosis, we found no significant difference in proliferation and apoptosis in knockdown METTL3 expressing cells after metformin-based intervention (). We speculate that metformin is indeed involved in the regulation of MM progression by inhibiting METTL3 expression.
Figure 3. METTL3 overexpression counteracts metformin-mediated suppression of MM cell proliferation and facilitative effect of cell apoptosis.
3.4. Mechanistic excavation into the involvement of metformin in MM progression through regulation of METTL3
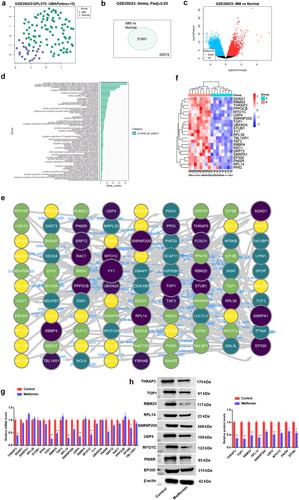
Next, the underlying mechanism by which metformin regulates MM progression through impairing METTL3 was further explored. Here, the analysis of dataset GSE29023 downloaded from GEO database revealed that 92 MM blood samples of MM patients and 23 normal blood samples could be significantly distinguished (), indicating that this dataset is feasible for differential analysis. In addition, the MM dataset was found to have a total of 21,601 differentially expressed genes (DEGs) by screening. The gene expression profile of MM was next analyzed in the GSE29023 dataset, generating a volcano plot of DEGs (). Subsequently, David online tool (https://david.ncifcrf.gov/home.jsp) was applied to perform GO-BP functional annotation of the 300 DEGs (). GO pathway enrichment analysis was made with the cluster profiler package based on R software for 300 differentially expressed upregulated genes, which were found to be significantly enriched in entries of regulation of transcription from RNA polymerase II promoter, protein ubiquitination, regulation of cell cycle, negative regulation of apoptotic process and so on. Next, DEGs enriched above entries were analyzed by Cytoscape software, and an interaction network diagram was made to screen out the key genes. Results as shown in , a total of 22 key DEGs were found by screening, including THRAP3, SDAD1, SNRPA1, RPL38, STUB1, PPIG, TOP1, RBM25, TAF3, RPL14, USP4, and so on. The darker and larger the circle color in indicated that the more interacting proteins of the gene, the more complex the protein network was, and the more likely it was the key gene in the DEGs. For the 22 DEGs used to visualize the Heatmap, the results presented that all genes were significantly upregulated in MM samples (). Further analysis displayed that the mRNA level of 8 DEGs was prominently downregulated after metformin treatment in H929 cells, including THRAP3, TOP1, RBM25, RPL14, USP4, MYO1C, PNISR, and EP300, and the expression of the other 14 DEGs had no significant change (). Further, the above 8 genes were further confirmed to be negatively regulated by metformin intervention through Western blotting ().
Figure 4. Mechanistic excavation into the involvement of metformin in MM progression through regulation of METTL3.
3.5. Metformin weakened METTL3-mediated m6A methylation of THRAP3, RBM25, and USP4
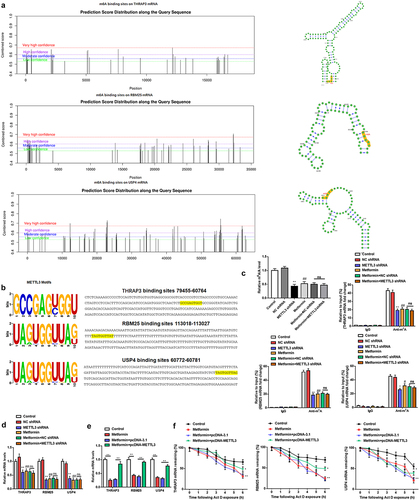
Next, nine candidate genes were subjected to further analysis aimed at exploring whether they were functionally related to METTL3. Online bioinformatics tools (http://www.cuilab.cn/sramp) were applied to forecast the presence of m6A binding sites on the mRNA of nine candidate genes. There were m6A binding sites “GGACT” on mRNA of THRAP3, RBM25, and USP4 (). Among them, the highest confidence binding sites were at 12,151–12155bp on THRAP3, at 32,238–32242bp on RBM25, and at 1413–1417bp on USP4. To further demonstrate whether m6A methylation on THRAP3, RBM25 and USP4 is regulated by METTL3, we obtained the METTL3 binding motifs at Starbase website (https://starbase.sysu.edu.cn/) and retrieved the mRNA 3‘UTR sequences of THRAP3, RBM25 and USP4. The results displayed that the possible binding sites of METTL3 and THRAP3 were GCCGAGTGGT, and that of RBM25 was TAGTGGTTAT, as well as USP4 was TAGTGGTTAG (). To confirm the reliability of the above results, MeRIP was employed to verify the m6A modification levels on THRAP3, RBM25, and USP4 in H929 cells. Enrichment of m6A antibody on THRAP3, RBM25, and USP4 was significantly raised compared to IgG. Furthermore, interference with METTL3 expression significantly impaired global m6A RNA modification, as well as m6A enrichment on mRNA of THRAP3, RBM25, and USP4 in H929 cells (). Moreover, global m6A RNA modification, as well as m6A enrichment of THRAP3, RBM25, and USP4 mRNA were also significantly decreased in H929 cells after metformin administration, which may be due to the inhibition of METTL3 expression by metformin (). Then, the effects of metformin and METTL3 on the mRNA levels of THRAP3, RBM25, and USP4 were further examined. The results authenticated inhibition of METTL3 expression substantially suppressed THRAP3, RBM25, and USP4 mRNA levels (). Interestingly, no significant differences in the mRNA expression levels of THRAP3, RBM25, and USP4 (), as well as the m6A modification levels (), were observed after metformin treatment in METTL3 knockdown cells compared with metformin untreated cells, suggesting that metformin regulation is not significantly responsive in METTL3 knockdown cells. Besides, mRNA levels of THRAP3, RBM25, and USP4 were downregulated after metformin treatment, while METTL3 overexpression could reverse the inhibitory effect of metformin on the level of THRAP3, RBM25, and USP4 (). RT-qPCR was enforced to assess the mRNA stability of THRAP3, RBM25, and USP4 after the addition of actinomycin D (5 μg/mL). We found that the mRNA stability of HRAP3, RBM25, and USP4 was apparently reduced by metformin treatment, which was partially restored by METTL3 overexpression ().
Figure 5. Metformin weakened METTL3-mediated m6A methylation of THRAP3, RBM25 and USP4.
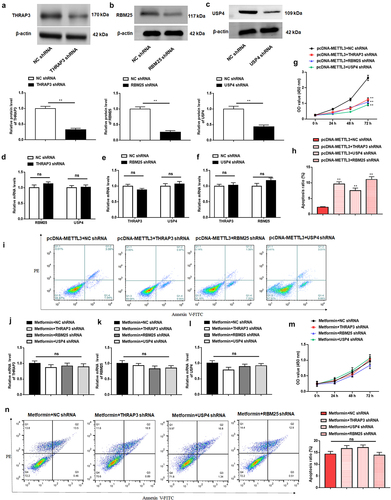
3.6. THRAP3, RBM25, or USP4 reversed the assistance of METTL3 on the malignant behavior of MM cells
Since THRAP3, RBM25 and USP4 were found to be likely structural targets acting the downstream of METTL3. Additionally, we assessed whether THRAP3, RBM25, and USP4 are functionally related to METTL3 by transfecting pcDNA-METTL3 together with THRAP3 shRNA, RBM25 shRNA, or USP4 shRNA into H929 cells. Western blotting was employed to first test the interference efficiency of THRAP3 shRNA, RBM25 shRNA, and USP4 shRNA (). Interestingly, we excluded the effect of THRAP3 downregulation on the expression of RBM25 and USP4 (), and the effect of RBM25 downregulation on THRAP3 and USP4 levels (), as well as the effect of USP4 downregulation on THRAP3 and RBM25 levels (). Additionally, knockdown of THRAP3, RBM25, or USP4 partially reversed the facilitative effect of METTL3 upregulation on H929 cell proliferation, as well as the repression effect on H929 cell apoptosis (). Taken together, the above findings suggest that THRAP3, RBM25, and USP4 may play a cell growth promoting role downstream of METTL3 in MM. Subsequently, we knocked down THRAP3, RBM25, and USP4, respectively, after metformin intervention on H929 cells, and then evaluated cell proliferation and apoptosis. The PCR results suggested that there were no significant changes in the mRNA levels of THRAP3, RBM25, and USP4 after knockdown of THRAP3, RBM25, and USP4, respectively, under metformin pre-treatment (). Besides, there were no significant changes in the proliferation ability () and apoptosis ability () of H929 cells when THRAP3, RBM25, and USP4 knocked down after metformin treatment, respectively. It is indicated that metformin indeed regulates MM development by indirectly inhibiting THRAP3, RBM25, and USP4 as one of the pathways.
Figure 6. THRAP3, RBM25 or USP4 reversed the assistance of METTL3 on the malignant behavior of MM cells.
3.7. Metformin inhibits MM xenograft tumor growth by repressing METTL3 expression in nude mice
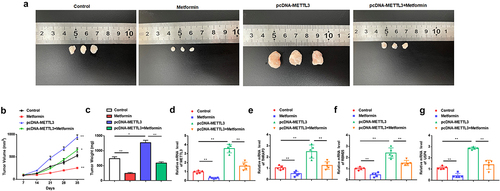
To confirm our in vitro results that metformin treatment could restrain MM, the effects of metformin in a xenograft murine model were next evaluated. Nude mice were subcutaneously injected with H929 cells stably transfected with a pcDNA-METTL3 plasmid vector, or treated with metformin (250 mg/Kg), to further evaluate the effect of metformin on MM cell growth in vivo. Metformin significantly suppressed tumor volume and tumor weight compared with control, whereas tumors from METTL3 overexpressing cells grew faster and had heavier tumor weights. Moreover, in vivo rescue experiment results displayed that METTL3 overexpression partially counteracted the suppression effect of metformin on tumor growth (). Further, compared to the control group, the mRNA expression of METTL3, THRAP3, RBM25, and USP4 was markedly decreased after treatment with metformin, and strikingly upregulated in the METTL3 overexpression group (). However, METTL3 overexpression prominently inversed the inhibitory effect of metformin injection on mRNA expression of METTL3, THRAP3, RBM25, and USP4 (), which was unanimous with our previous in vitro results. Taken together, these results validate the anticancer effects of metformin on MM in vivo by inhibiting METTL3 expression.
Figure 7. Metformin inhibits MM xenograft tumor growth by repressing METTL3 expression in nude mice.
4. Discussion
MM is a malignant clonal plasma cell disorder characterized by abnormal production of monoclonal immunoglobulins, which ultimately leads to a series of clinical manifestations including bone destruction, anemia, hypercalcemia, and renal dysfunction [Citation24]. Metformin was found to be able to decrease the risk of cancer and ameliorate the prognosis of cancer. In vivo and in vitro results have demonstrated that metformin has anticancer effects as well as can be used as an adjuvant in tumor therapy [Citation25]. Metformin has begun discussion as a potentially useful agent based on the results of epidemiological and preclinical studies showing that metformin may be beneficial for patients with leukemia, lymphoma, and MM [Citation26]. Metformin is able to prevent HUVEC thrombosis induced in the serum of MM patients [Citation27]. A study revealed that metformin abated the concentration of ATP during DNA damage repair, which in turn to impede the anti-apoptotic process in MM cells [Citation28]. In this assay, metformin inhibited the growth viability and promoted apoptosis of MM cell lines H929 and MM.1S in a dose – and time-dependent manners.
The development of MM in addition to genetic dysregulation caused by nucleotide sequence alterations such as gene mutations, epigenetic dysregulation including aberrant DNA methylation and modification by RNA methylation plays an important role in MM pathogenesis [Citation29,Citation30]. Therapeutic agents targeting epigenetic modifications have also been used in the clinic, but the therapeutic effects are still limited, suggesting that novel pathogenesis remains to be explored. Researches have proposed that aberrant m6A RNA modification plays a vital importance role in MM [Citation31,Citation32]. Inhibition of ALKBH5, an RNA demethylase, in MM cells was able to upregulate SAV1 m6A levels and hinder SAV1 mRNA stability and expression, as well as inhibit stem cell associated Hippo pathway signaling and ultimately activate downstream effector Yap, which in turn exerts anti MM effects [Citation33]. METTL3 was the first methyltransferase to be identified, which can form a complex with METTL14, WTAP and contribute to RNA methylation, METTL3 content in human tissues, especially in testis, and relatively conserved [Citation34]. METTL3 is significantly highly expressed in AML, NSCLC, liver cancer, breast cancer, and so on, which proves that it is go hand in hand to the development of malignant tumors [Citation35]. A research confirmed that METTL3 encouraged miR-27a-3p maturation and mRNA stability of YY1 in an m6A manner, which in turn accelerates MM tumor growth [Citation21]. In this study, we discovered that metformin suppressed the m6A level via downregulating METTL3 level in MM. Cheng et al. [Citation22] have previously shown that metformin inhibits breast cancer cell proliferation by inhibiting the METTL3/p21 pathway, with a specific mechanism that metformin may reduce the expression of METTL3 in breast cancer mediated by miR-483-3p. Li et al [Citation36]. discovered that metformin is an effective drug for lung cancer treatment, and the underlying mechanism may be that the addition of metformin increased the binding of DNMT3A/B to the METTL3 promoter to activate the methylation of METTL3, thereby inhibiting METTL3 expression. There are quite a few studies showing that metformin directly affected the intracellular DNA methylation level. Zhong et al [Citation37]. proposed that metformin was able to induce genome-wide alterations in DNA methylation in cancer cells, exposing cancer cells to metformin leads to hypermethylation of tumor promoting pathway genes, such as lncRNA-H19 and concomitant inhibition of cell proliferation. Lu et al [Citation38]. found that metformin reduced gastric cancer risk by inhibiting PTEN promoter methylation. In this study, METTL3 protein expression was reduced after metformin treatment. And then metformin intervention conspicuously reversed the promotion of cell proliferation by METTL3 overexpression. Thus, we speculate that the effect of metformin on METTL3 in this study may be through the inhibition of METTL3 expression by a certain DNA methylase enriched on the METTL3 promoter. Moreover, METTL3 overexpression partially eliminated the suppression of MM cell proliferation by metformin intervention, as well as the promotion of apoptosis. Further, we also discovered that WTAP was significantly upregulated in MM cells after metformin treatment for 48 h. Regarding the cause of increased WTAP expression we speculate that it may be related to the homeostasis of RNA methyltransferases. Sorci et al [Citation39]. suggested that knockdown of METTL3 protein resulted in WTAP protein upregulation, indicating that METTL3 levels are critical for WTAP protein homeostasis. Subsequently, THRAP3, RBM25, and USP4 were considered as possible candidates for the involvement of METTL3 in the regulation of MM progression by bioinformatics screening and analysis.
Thyroid hormone receptor associated protein 3 (THRAP3) is involved in the alternative splicing and nuclear trafficking of pre-mRNA during RNA processing, maintaining genomic homeostasis and preventing oncogenic gene transformation in response to DNA damage [Citation40]. Some studies showed that after cells knocked down THRAP3, the viability and damage repair ability of cells decreased, indicating that THRAP3 protein has a certain regulatory effect on the viability of cells [Citation41]. A study discovered that THRAP3 could up-regulate cell cycle regulator Bub1 levels to accelerate cell cycle proceedings and promote colorectal cancer cell proliferation [Citation42]. RBM25 is a member of the RBM gene family, and its expression was higher in adult thymus but lower in fetal thymus, suggesting that RBM25 may be regulated by growth and development [Citation43]. RBM25, as a poorly characterized RNA binding protein, is confirmed to participate in multiple biological processes and regulate tumor cell proliferation and metastasis. Zhang et al demonstrated that RBM25 was upregulated in hepatocellular carcinoma (HCC) patients and was significantly associated with poor overall survival [Citation44]. Siavoshi et al performed RNA-seq on ovarian cancer tissues and found 333 significantly upregulated DEGs, including RPL41, ALDH3A2, MIEN1 and RBM25 [Citation45]. Further, ubiquitin-specific protease 4 (USP4) is a deubiquitinating enzyme that is ubiquitously expressed in various tissues and organs of the human body [Citation46].
Ubiquitination is an important post-translational modification capable of stably activating or degrading inactive a substrate protein by attaching monomeric ubiquitin or polyubiquitin to it [Citation47]. Thus, each step in the ubiquitination process may be a target of action for disease targeted therapies. Similar to other members of the USP family, USP4 itself has been reported to regulate numerous physiological and pathological processes, including regulation of liver fibrosis and nonalcoholic fatty liver disease, innate immune response and immune homeostasis, notochord injury, antiviral killing, DNA damage repair, and connective tissue development [Citation48–50]. In addition, USP4 has been discovered to accelerate tumor progression or predict poor prognosis in breast cancer, hepatocellular carcinoma, colorectal cancer, malignant glioma as well as melanoma as confirmed in several reports [Citation51–54]. Romika et al [Citation55]. study confirmed that high levels of OVCA2, PAFAH1B3, USP4, SIAE and low levels of PCED1B were poor prognostic markers in MM. In this study, we identified the presence of m6A modification sites on THRAP3, RBM25, and USP4 through bioinformatics data screening. In prostate cancer, METTL3 mediated m6A modification of USP4 mRNA at A2696 [Citation56]. Subsequently, it was further confirmed that there were METTL3 binding sequences on THRAP3, RBM25, and USP4, suggesting that they could be modified by METTL3 mediated m6A methylation and stabilize their expression in MM cells. Next, we make further efforts to analyze the effects of THRAP3, RBM25 and USP4 on MM cell proliferation and apoptosis. As we expected, MM cell proliferation was inhibited and apoptosis rate was increased after knockdown of THRAP3, RBM25, and USP4, respectively. Moreover, the interference of THRAP3, RBM25, and USP4 was able to partially abolish the effects of METTL3 overexpression on MM cell proliferation and apoptosis.
Taken together, the results of this study demonstrated that Metformin has the ability to hinder cell proliferation and encourage cell apoptosis of MM in vitro and in vivo. The main mechanism is that m6A modification of THRAP3, RBM25, and USP4 is weakened by inhibiting METTL33 expression, which in turn represses the expression of THRAP3, RBM25, and USP4. These findings contribute to a better understanding of the molecular biological mechanisms underlying metformin treatment of MM and hopefully provide new molecular targets and rationale for MM treatment. Nevertheless, the present study still has some limitations. We did not further explore what the specific molecular mechanism underlying METTL3 expression inhibition by metformin, and we will subsequently analyze whether metformin regulation of METTL3 expression is associated with DNMT3A/B enrichment at the METTL3 promoter as previously described. Moreover, the animal experiments of the present study are still insufficient, and it has not been evaluated whether METTL3 knockdown has an effect on the sensitivity to metformin treatment, which will also be the focus of our subsequent studies.
Authors’ contributions
Long-Tian Chen, Wei-Hao Wu, Cong-Jie Chen and Jie-Yun Huang designed this study and wrote the manuscript. Cong-Jie Chen and Jie-Yun Huang and Jian-Qing Huang performed the experimental work. Jia-Yi Deng provided the majority of statistical analysis as well as provided the figures and tables for the manuscript. Xiao-Hui Shangguan and Ai-Zhen Chen collected a large amount of data for the dataset. All authors read and approved the final manuscript.
Availability of data and materials
The datasets used during the present study are available from the corresponding author on reasonable request.
Ethics approval and consent to participate
This study was approved by the medical ethics committee of Fujian Medical University.
Author consent for publication
Consent for publication was obtained from each author.
Supplemental Material
Download Zip (538.5 KB)Disclosure statement
No potential conflict of interest was reported by the authors.
Supplementary material
Supplemental data for this article can be accessed online at https://doi.org/10.1080/15384101.2023.2170521
Additional information
Funding
References
- Brigle K, Rogers B. Pathobiology and diagnosis of multiple myeloma [J]. Semin Oncol Nurs. 2017;33(3):225–236.
- Joshua DE, Bryant C, Dix C, et al. Biology and therapy of multiple myeloma [J]. Med J Aust. 2019;210(8):375–380.
- Van de donk N, Pawlyn C, Yong KL. Multiple myeloma [J]. Lancet. 2021;397(10272):410–427.
- Mohammed I, Hollenberg MD, Ding H, et al. A critical review of the evidence that metformin is a putative anti-aging drug that enhances healthspan and extends lifespan [J]. Front Endocrinol. 2021;12:718942.
- Zhang K, Bai P, H Dai, et al. Metformin and risk of cancer among patients with type 2 diabetes mellitus: a systematic review and meta-analysis [J]. Prim Care Diabetes. 2021;15(1):52–58.
- Mallik R, Ct A. Metformin in cancer [J]. Diabet Res Clin Pract. 2018;143:409–419.
- Podhorecka M, Ibanez B, Dmoszyńska A. Metformin - its potential anti-cancer and anti-aging effects [J]. Postepy Hig Med Dosw (Online). 2017;71(0):170–175.
- Huang F, Xiang Y, Li T, et al. Metformin and MiR-365 synergistically promote the apoptosis of gastric cancer cells via MiR-365-PTEN-AMPK axis [J]. Pathol Res Pract. 2022;230:153740.
- Yoshida J, Ishikawa T, Endo Y, et al. Metformin inhibits TGF‑β1‑induced epithelial‑mesenchymal transition and liver metastasis of pancreatic cancer cells [J]. Oncol Rep. 2020;44(1):371–381.
- Lu B, Gs Y, H ZH, et al. Effect of Metformin on Proliferation of Multiple Myeloma Cells] [J. Zhongguo Shi Yan Xue Ye Xue Za Zhi. 2017;25(4):1097–1100.
- Zi FM, Hj S, Y LI, et al. Metformin displays anti-myeloma activity and synergistic effect with dexamethasone in in vitro and in vivo xenograft models [J]. Cancer Lett. 2015;356(2 Pt B):443–453.
- Grimaldi C, Chiarini F, Tabellini G, et al. AMP-dependent kinase/mammalian target of rapamycin complex 1 signaling in T-cell acute lymphoblastic leukemia: therapeutic implications [J]. Leukemia. 2012;26(1):91–100.
- Wang ES, Wetzler M. An oncologist’s perspective on metformin use and acute lymphoblastic leukemia outcomes [J]. J Pharm Pract. 2015;28(1):46–47.
- GAO R, Ye M, B LIU, et al. M6a Modification: a Double-Edged Sword in Tumor Development [J]. Front Oncol. 2021;11:679367.
- Zaccara S, J RR, R JS. Reading, writing and erasing mRNA methylation [J]. Nat Rev Mol Cell Biol. 2019;20(10):608–624.
- ZHAO BS, Ri A, C HE. Post-transcriptional gene regulation by mRNA modifications [J]. Nat Rev Mol Cell Biol. 2017;18(1):31–42.
- Sun T, Wu R, Ming L. The role of m6a RNA methylation in cancer [J]. Biomed Pharmacother. 2019;112:108613.
- Wu X, Ye W, Gong Y. The role of RNA methyltransferase METTL3 in normal and malignant hematopoiesis [J]. Front Oncol. 2022;12:873903.
- Li D, FU Z, DONG C, et al. Methyltransferase 3, N6-adenosine-methyltransferase complex catalytic subunit-induced long intergenic non-protein coding RNA 1833 N6-methyladenosine methylation promotes the non-small cell lung cancer progression via regulating heterogeneous nuclear ribonucleoprotein A2/B1 expression [J]. Bioengineered. 2022;13(4):10493–10503.
- Cui Q, Shi H, Ye P, et al. M(6)a RNA Methylation Regulates the Self-Renewal and Tumorigenesis of Glioblastoma Stem Cells [J]. Cell Rep. 2017;18(11):2622–2634.
- Che F, Ye X, Wang Y, et al. METTL3 facilitates multiple myeloma tumorigenesis by enhancing YY1 stability and pri-microRNA-27 maturation in m(6)a-dependent manner [J]. Cell Biol Toxicol. 2022. DOI:10.1007/s10565-021-09690-1.
- Cheng L, Zhang X, HY Z, et al. Metformin exhibits antiproliferation activity in breast cancer via miR-483-3p/mettl3/m(6)a/p21 pathway [J]. Oncogenesis. 2021;10(1):7.
- Gavriatopoulou M, A PS, Ntanasis-stathopoulos I, et al. Metabolic disorders in multiple myeloma [J]. Int J Mol Sci. 2021;22(21):11430.
- Cowan AJ, J GD, Kwok M, et al. Diagnosis and management of multiple myeloma: a Review [J]. JAMA. 2022;327(5):464–477.
- MORALES DR, D MA. Metformin in cancer treatment and prevention [J]. Annu Rev Med. 2015;66(1):17–29.
- Papachristou S, Pd S, PAPANAS N. Reduced Progression of Monoclonal Gammopathy of Undetermined Significance to Multiple Myeloma in Type 2 Diabetes Mellitus: will Metformin Never Stop Its Pleasant Surprises? J Adv Ther. 2022;39(6):2283–2286.
- Gao L, Li L, Hu J, et al. Metformin inhibits multiple myeloma serum-induced endothelial cell thrombosis by down-regulating miR-532 [J]. Ann Vasc Surg. 2022;85:347–357.e2.
- Song Y, Chen S, Xiang W, et al. The mechanism of treatment of multiple myeloma with metformin by way of metabolism [J]. Arch Med Sci. 2021;17(4):1056–1063.
- Yang T, Liu X, K KS, et al. Decoding DNA methylation in epigenetics of multiple myeloma [J]. Blood Rev. 2022;51:100872.
- San-miguel J, García-Sanz R, LóPEZ-Pérez R. Analysis of methylation pattern in multiple myeloma [J]. Acta Haematol. 2005;114 Suppl 1(Suppl. 1):23–26.
- Hua Z, Wei R, M GUO, et al. YTHDF2 promotes multiple myeloma cell proliferation via STAT5A/MAP2K2/p-ERK axis [J]. Oncogene. 2022;41(10):1482–1491.
- Zhao Y, Peng H. The role of N(6)-Methyladenosine (m(6)a) Methylation Modifications in Hematological Malignancies [J]. Cancers (Basel). 2022;14(2):332.
- Yu T, Yao L, Yin H, et al. ALKBH5 promotes multiple myeloma tumorigenicity through inducing m(6)a-demethylation of SAV1 mRNA and myeloma stem cell Phenotype [J]. Int J Biol Sci. 2022;18(6):2235–2248.
- Zeng C, Huang W, Li Y, et al. Roles of METTL3 in cancer: mechanisms and therapeutic targeting [J]. J Hematol Oncol. 2020;13(1):117.
- Lin S, Choe J, Du P, et al. The m(6)a Methyltransferase METTL3 promotes translation in human cancer cells [J]. Mol Cell. 2016;62(3):335–345.
- Li K, Gao S, Ma L, et al. Stimulation of Let-7 Maturation by Metformin Improved the Response to Tyrosine Kinase Inhibitor Therapy in an m6a Dependent Manner [J]. Front Oncol. 2021;11:731561.
- Zhong T, Men Y, Lu L, et al. Metformin alters DNA methylation genome-wide via the H19/SAHH axis [J]. Oncogene. 2017;36(17):2345–2354.
- Lu H, Han X, J REN, et al. Metformin attenuates synergic effect of diabetes mellitus and Helicobacter pylori infection on gastric cancer cells proliferation by suppressing PTEN expression [J]. J Cell Mol Med. 2021;25(10):4534–4542.
- Sorci M, Ianniello Z, Cruciani S, et al. METTL3 regulates WTAP protein homeostasis [J]. Cell Death Dis. 2018;9(8):796.
- Kang HJ, Eh J, Kim H, et al. Thrap3 promotes R-loop resolution via interaction with methylated DDX5 [J]. Exp Mol Med. 2021;53(10):1602–1611.
- Cetani F, Pardi E, Marcocci C. Parathyroid Carcinoma [J]. Front Horm Res. 2019;51:63–76.
- Ma R, Liu Y, X CHE, et al. Nuclear PD-L1 promotes cell cycle progression of BRAF-mutated colorectal cancer by inhibiting THRAP3 [J]. Cancer Lett. 2022;527:127–139.
- Zanoni P, Panteloglou G, Othman A, et al. Posttranscriptional regulation of the human LDL Receptor by the U2-Spliceosome [J]. Circ Res. 2022;130(1):80–95.
- Zhang YF, Wy X, Zhang N, et al. Prognostic alternative splicing regulatory network of RBM25 in hepatocellular carcinoma [J]. Bioengineered. 2021;12(1):1202–1211.
- Siavoshi A, Taghizadeh M, Dookhe E, et al. Gene expression profiles and pathway enrichment analysis to identification of differentially expressed gene and signaling pathways in epithelial ovarian cancer based on high-throughput RNA-seq data [J]. Genomics. 2022;114(1):161–170.
- Hu B, Zhang D, Zhao K, et al. Spotlight on USP4: structure, Function, and Regulation [J]. Front Cell Dev Biol. 2021;9:595159.
- Mattiroli F, PENENGO L. Histone ubiquitination: an integrative signaling platform in genome stability [J]. Trends Genet. 2021;37(6):566–581.
- Zhu J, Luo Z, Y PAN, et al. H19/mir-148a/usp4 axis facilitates liver fibrosis by enhancing TGF-β signaling in both hepatic stellate cells and hepatocytes [J]. J Cell Physiol. 2019;234(6):9698–9710.
- Wang L, Zhao W, Zhang M, et al. USP4 positively regulates RIG-I-mediated antiviral response through deubiquitination and stabilization of RIG-I [J]. J Virol. 2013;87(8):4507–4515.
- HUANG Y, WANG Y, WANG X, et al. The Effects of the transforming growth factor-β1 (TGF-β1) Signaling Pathway on Cell Proliferation and Cell migration are mediated by ubiquitin specific protease 4 (USP4) in hypertrophic scar tissue and primary fibroblast cultures [J]. Med Sci Monit. 2020;26:e920736.
- Wang Y, Zhou L, Lu J, et al. USP4 function and multifaceted roles in cancer: a possible and potential therapeutic target [J]. Cancer Cell Int. 2020;20(1):298.
- Guo W, Ma J, Pei T, et al. Up-regulated deubiquitinase USP4 plays an oncogenic role in melanoma [J]. J Cell Mol Med. 2018;22(5):2944–2954.
- Xing C, Lx X, Gp D, et al. Ubiquitin-Specific Protease 4-Mediated Deubiquitination and Stabilization of PRL-3 is Required for Potentiating Colorectal Oncogenesis [J]. Cancer Res. 2016;76(1):83–95.
- Glage S, La L, Mertens P, et al. Evaluation of biocompatibility and anti-glioma efficacy of doxorubicin and irinotecan drug-eluting bead suspensions in alginate [J]. Clin Transl Oncol. 2012;14(1):50–59.
- Kumari R, MM M, Lievonen J, et al. Prognostic significance of esterase gene expression in multiple myeloma [J]. Br J Cancer. 2021;124(8):1428–1436.
- Chen Y, Pan C, Wang X, et al. Silencing of METTL3 effectively hinders invasion and metastasis of prostate cancer cells [J]. Theranostics. 2021;11(16):7640–7657.