
ABSTRACT
The main objective of this study is to investigate the regulatory roles of the miR-17-5p/RRM2 axis in A549/G+ cells’ gemcitabine resistance. The cell viability was determined using CCK8 and clonogenic assays. Gene expression level analysis by RT-qPCR and Western blotting. Cell cycle analysis by flow cytometry. The dual luciferase activity assay was used to verify the target gene of miR-17-5p. In gemcitabine-resistant cell line A549G+, the drug resistance decreased after up-regulation of MiR-17-5p expression. The proportion of cell cycle G1 phase increased, and the S phase decreased. The expression level of cell cycle-related proteins CCNE1, CCNA2, and P21 decreased. The opposite results emerged after the down-regulation of MiR-17-5p expression in gemcitabine-sensitive cell line A549G–. The expression levels of PTEN and PIK3 in A549G+ cells were higher than in A549G-cells, but p-PTEN was lower than that in A549G–. After up-regulating the expression of MiR-17-5p in A549G+, the expression levels of p-PTEN increased, and the expression level of p-AKT decreased. After down-regulating miR-17-5p expression, the opposite results emerged. The dual-luciferase reporter assay and restorative experiments proved that RRM2 is one of the target genes for MiR-17-5p. Our results suggested that the miR-17-5p/RRM2 axis could adjust gemcitabine resistance in A549 cells, and the p-PTEN/PI3K/AKT signal pathway might be involved in this regulatory mechanism.
KEYWORDS:
Introduction
In the past few years, although lung cancer has the second highest incidence of cancer in the world, it is still the highest mortality of malignant tumors in the world [Citation1]. We knew that most lung cancer patients were asymptomatic in the early stage and had missed the optimal surgical treatment time when symptoms appeared in the middle and advanced stages (III or IV). Therefore, traditional radiotherapy and chemotherapy are still the main treatment options for those lung cancer patients [Citation2]. However, the emergence of drug resistance is a primary obstacle to achieving satisfactory therapeutic effects. Unfortunately, the mechanisms underlying chemoresistance in the lungs are still in a blur. The clinical treatment effect is unsatisfactory, and the five-year survival rate is only 15% [Citation3].
At present, chemotherapy is a popular selection for NSCLC patients’ treatment [Citation4]. Since the 1990s, third-generation chemotherapeutics, such as gemcitabine, vinorelbine, paclitaxel, docetaxel, etc., have been widely used in clinical. It has gradually become the first-line drug for the clinical treatment of NSCLC.
Gemcitabine, one of the cytosine nucleoside derivatives, is also a cell cycle-specific anti-metabolite. It could inhibit the ribonucleotide reductase, thereby inhibiting DNA synthesis and preventing cells from entering the S phase from the G1 phase, and finally are deactivated by CDA (cytidine deaminase, CDA) [Citation5].
Intracellular PI3K/AKT signal axis can be activated by a variety of cytokines, such as hepatocyte growth factor receivers (HGF), epidermal growth factor (EGF), vascular endothelial growth factor (VEGF), fibroblast growth factor (FGF), and insulin-like growth (IGF). The activated PI3K/AKT signal can promote multiple gene expressions through the mammalian target of rapamycin (mTOR). And it accelerates the proliferation, angiogenesis, invasion, and metastasis of non-small cell lung cancer, breast cancer, head and neck cancer, colon cancer, ovarian cancer, and other tumors [Citation6,Citation7]. The phosphatase and tensin homolog deleted on chromosome 10 (PTEN) could negatively regulate the PI3K/AKT signaling cascade by converting PIP3 back to PIP2 [Citation6–8]. If PTEN is lost, it will lead to abnormal activation of the PI3K/AKT signal pathway and drug resistance of many tumors, including lung cancer [Citation7,Citation9].
We have successfully constructed a gemcitabine-resistant A549 lung cancer cell-line A549/+ and analyzed the differential expression of miRNAs in A549/G+ and A549/G- cell lines. Our results hinted that miR-17-5p expressed significantly differently between A549/G+ cells and A549/G- cells [Citation10]. MiR-17-5p is a member of the miR-17-92 gene family. It is often expressed high in multiple hematological and solid tumors [Citation11,Citation12].
Some publications reported that miR-17-5p is an oncogene in most tumors. It is expressed highly in cancer cells and could boost cell proliferation and inhibit apoptosis. However, some other results showed that miR-17-5p is a cancer suppressor gene in breast cancer, cervical cancer, prostate cancer, and other tumors [Citation13]. Meng and other researchers found that miR-17-5P may promote lung cancer cells A549, SPCA-1, and GLC-82 proliferation, migration, and invasion through up-regulating CCND1, Vimentin, and N-CA gene expression [Citation14]. These indicate that miR-17-5p is likely to play a crucial role in the resistance mechanism of lung cancer.
Therefore, based on the above experiments, this paper focuses on the role of miR-17-5p and its target gene in the resistance of lung cancer cell A549 to gemcitabine. The present study aims to clarify the resistance mechanism of A549 cells to gemcitabine and provide a more experimental basis for tumor drug-resistance mechanisms.
Materials and methods
Culture of cells
A549 (Human lung adenocarcinoma cell) was bought from the Institute of Oncology and Peking Union Medical College (Beijing, China). Our team established A549/G+ cell lines by exposing A549 to low-dose gemcitabine mixed medium. All cells were cultured in DMEM with 10% fetal bovine serum, 100 U/ml penicillin, and 100 μg/ml streptomycin and maintained at 37°C in 5% CO2.
Mimics, siRNA, and inhibitor
The miR-17-5p mimics, inhibitor, and their control substances were synthesized from RIBOBIO (Guangzhou, China). Their sequence is miR-17-5p mimics, 5”-UUCCCUUUGUCAUCCUAUGCCU-3‘, and miR-17-5p inhibitor, 5’-UGGCUUUGGUUGUCUUUGGGUU-3‘. P21 siRNA and RRM2 siRNA were also synthesized from RIBOBIO (Guangzhou, China). The most effective siRNA sequence is P21 siRNA, 5’-GAATGAGAGGTTCCTAAGA −3‘, and RRM2 siRNA 5’-GCCTCACATTTTCTAATGA-3”. The cells were transfected with 50 nmol/L miR-17-5p inhibitor and mimics, 50 nmol/L P21 siRNA or RRM2 siRNA. The control reagent is Lipofectamine® 3000 (Life Technologies, Carlsbad, CA, USA). The transfection protocol accords to the operation’s instructions.
miRNA profiling and real-time quantitative polymerase chain reaction (qPCR)
A549/G+ cells were transfected with miR-17-5p mimics, RRM2 siRNA to establish the NC group, siNC group, miR-17-5p mimics group, and siRRM2 group. And A549/G- cells were transfected with miR-17- 5p inhibitor, set up in -NC group and inhibitor group. All the following experimental groups follow this grouping pattern.
Culture A549/G- and A549/G+ cells in the logarithmic growth phase and after transfecting mimics, inhibitors, and siRNAs for 24 hours, total RNA was extracted, and reverse transcription (RT) and qPCR reaction were carried out successively. The RT and qPCR were used in the PIKOREAL 96 Real-Time PCR System (ThermoFisherScientific, USA). U6 and GAPDH were used as an endogenous reference for data standardization. The relative expression level of the gene was calculated with the 2−∆∆CT method. The sequences of primers are seen in .
Table 1. The sequences of primers of genes.
CCK-8 assay
CCK-8 (Dojindo, Japan) was used to determine cell viability and calculate the IC50. The lysed cells were incubated in 96-well plates at 3 × 10³ cells per well. After 24 h of culture in a complete medium, the cells were cultured in a medium with different doses of gemcitabine for 72 h. Then, the medium with the drug was discarded, and add 100 μL of 10% CCK-8 medium to each well. Absorbance was obtained at 450 nm using a microplate reader (Bio Tek Gene5, US). Each drug dose was repeated in three wells and at least three times.
Clonogenic survival assay
The cells were well distributed and inoculated in a six-well plate with 1 × 10³ cells per well. Different doses of gemcitabine were added to each well. After incubating the cells for 72 h. The cells were then cultured in a complete medium until clones were visible to the naked eye. After formaldehyde fixation, the cell clones were stained with 0.1% crystal violet for half-hour.
Cell cycle analysis
The cells were well distributed and inoculated in a six-well plate with 2 × 10⁵ cells per well. After 24 h of transfection, the cells were obtained and fixed with 500 μL 70% ethanol at 4°C for 12 h. The next day, the cells were washed with PBS. Add 500 μL PI/RNase A (Jiangsu KeyGEN BioTECH, China) staining working solution prepared in advance to each sample and keep it away from light for 40 min at 25°C. The cell samples were inhaled and analyzed by flow cytometry.
Western blotting
Every group’s cells were well distributed inoculated in a six-well plate with 2 × 10⁵ cells per well, transfected in groups for 48 h. The cells were lysed in RIPA buffer (Beyotime Biotechnology, Beijing, China). Separation of all protein samples was by SDS-PAGE, and the protein samples on the gel were transferred to a polyvinylidene fluoride membrane. The specific antibodies used include Rabbit mAbP21 antibody (CST, NO. 2947S, USA), Mouse mAb CyclinA2 antibody (CST, NO. 4656T), Mouse mAb CyclinE1 antibody (CST, NO. 4129T), Rabbit mAb PTEN antibody (CST, NO. 9188S), Rabbit mAb P-PTEN antibody (CST, NO. 9554S), Rabbit mAb Phospho-Akt (Ser473) antibody (CST, NO. 9271S), Mouse mAb PI3K antibody (CST, NO. 13666S), Rabbit mAb RRM2 antibody (Abcam, NO. EPR11820) All specific antibodies were used after 1:1000 dilution, and the anti-specific antibody (Beyotime Biotechnology, Beijing, China) was also used after 1:1000 dilution. The anti-specific antibodies bound to the PVDF membrane were detected by the ECL detection system. We then used Image J software to perform protein band grayscale analysis.
Plasmids
The 3’-UTR of human RRM2 gene cDNA contains a hypothetical binding site of miR-17-5p. The sequence was synthesized chemically from Sangon Biotech (Shanghai, China). For synthetic wild-type (RRM2 WT) gene fragments, we also designed three different corresponding mutants (RRM2 non-seed, RRM2 MUT2, RRM2 MUT4) linked to the downstream of the luciferase gene in pmirglo vector (Promega, Madison, WI, USA) and the original pmirGLO as negative controls.
The gene fragment prepared by SangonBiotech and the plasmid pmirGLO purchased by us were subjected to double digestion, 37°C, 60 min, and then digest the product Agarose gel electrophoresis and gel recovery. According to the DNA ligase system, the DNA insert fragment and the plasmid vector fragment were ligated at a molar ratio of 1:20 at 25°C for half-hour. Then these recombinants are transformed into host cells, the required clones are selected, the clones are amplified and the recombinants are extracted and stored at −20°C.
Dual-luciferase activity assay
The mature sequence of miR-17-5p is 5“CAAAGUGCUUACAGUGCAGGUAG 3”. Among them, the five ‘end of miRNA has a miRNA seed sequence, including 2–8 nucleotide sequences. Based on the seed sequence and predicted binding sites, we designed RRM2 WT, RRM2 MUT non-seed, RRM2 MUT2, and RRM2 MUT4 gene fragments as shown in , synthesized by Shanghai Sangon Biotech. We use the dual-luciferase plasmid pmirGLO () to express both firefly luciferase and Renilla luciferase in A549/G+ cells, using Renilla luciferase as an internal reference and luciferin as the substrate. For dual luciferase activity assay, RRM2 WT, RRM2 nonseed, RRM2 MUT2, RRM2 MUT4, and pmirGLO were co-transfected with miR-17-5p inhibitor or mimics. After 48 h, lyse these cells and place the lysate in a 96-well plate. Then according to the operation introduction (Dual luciferase® Reporter analysis system, Life, USA) measures report activity. We calculate the activity ratio of luciferase of Firefly/Renilla.
Figure 1. pmirGLO vector structure map and the expression of miR-17-5p affects the effects of gemcitabine on the growth and proliferation of A549/G+ and A549/G- cells.
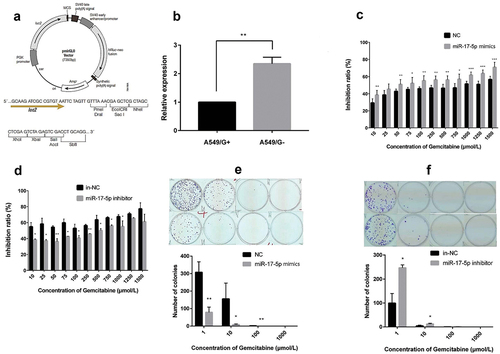
Table 2. The sequence of RRM2 gene and RRM2 mutation gene.
Data statistical test
Data statistical test was carried out using SPSS 11.0 and GraphPad Prism 7.0. The mean of the two samples was analyzed by t-test and expressed as P-Value. The test level is 0.05.
Results
MiR-17-5p’s overexpression can increase the sensitivity of A549/G+ cells to gemcitabine
The qRT-PCR results proved that miR-17-5p expressed higher in A549/G- cells than in A549/G+ cells (P < 0.01, ), which is consistent with our previous microarray analysis results [Citation10].
On the premise of successful transfection, in A549/G+ and A549/G- cells, overexpression, and inhibition of miR-17-5p were carried out for the CCK8 test. The inhibitory rates of gemcitabine at each concentration on the experimental group and the control group were as follows (). The results indicated that the IC50 of the mimics experimental group is lower than that of the NC control group (115 μmol/L vs. 475 μmol/L, P < 0.001); the IC50 of the inhibitor experimental group is higher than that of the NC control group (281 μmol/L vs. 9 μmol/L, P < 0.05). Similarly, the clonogenic survival assay also proved that under different gemcitabine doses, miR-17-5p’s overexpression can reduce the number of clone formations in A549/G + cells (); miR-17-5p’s low-expression can increase the number of clones in A549/G- cells (). The above results explained that miR-17-5p mimics can reduce the resistance of drug-resistant cell lines to gemcitabine and the inhibitor can increase the resistance of sensitive cell lines to gemcitabine.
A. pmirGLO Vector structure map; B. The expression of miR-17-5p in A549/G- and A549/G+ cells; C. The inhibition rate of gemcitabine at each concentration after transfection miR-17-5p mimics; D. The inhibition rate of each concentration of gemcitabine after transfection miR-17-5p inhibitor; E. The clone formation changes after transfection miR-17-5p mimics; F. The clone formation changes after transfection of miR-17-5p inhibitor.
MiR-17-5p mimics reduce drug-resistance of A549/G+ cells to gemcitabine, which is related to cell cycle regulation
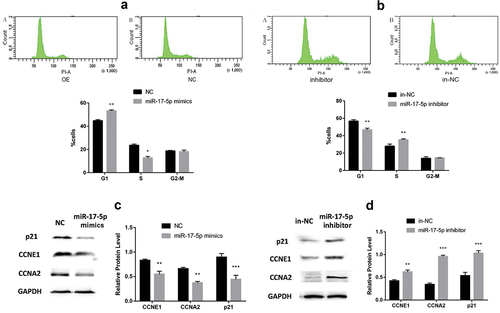
The cell cycle was analyzed by flow cytometry. The number of cells of the G1 phase increased and the number of cells in the S phase decreased () compared with the NC control group in the mimics experimental group. In the same way, the number of cells in the G1 phase decreased and the number of cells in the S phase increased in the miR-17-5p inhibitor experimental group () compared with the NC control group. The above results stated clearly that miR-17-5p mimics or inhibitors can prevent or promote the cells from G1 to S phase.
Figure 2. The results of cell cycle and its relative proteins expression.
To confirm the results of flow cytometry, the protein expression level related to cell cycle was used to analyze by Western blotting
Western blotting showed that the protein expression level of CCNE1, CCNA2, and P21 were reduced in the miR-17-5p mimics experimental group compared with the NC control group (). Similarly, the protein expressions level of CCNE1, CCNA2, and P21 increased after transfection with miR-17-5p inhibitor (). The above results showed that miR-17-5p is closely related to the resistance of A549 cells to gemcitabine, and it is likely to proceed by regulating the cell cycle.
A. The cell cycle changes after transfection miR-17-5p mimics; B. The cell cycle changes after transfection miR-17-5p inhibitor; C. The protein changes after transfection miR-17-5p mimic; D. The protein changes after transfection miR-17-5p inhibitor.
RRM2 is verified one of miR-17-5p’s target genes in A549/G+ cells
According to the prediction of miR-17-5p target genes in the three databases of mortar base, miRDB, Target Scan, and references, RRM2 was proposed as one of the miR-17-5p’s target genes. It was verified by a double luciferase activity assay.
The results of the dual-luciferase experiment showed that only the miR-17-5p mimics and RRM2 WT group have the lowest dual-luciferase ratio (P < 0.01, ). The ratios of the other groups are not statistically significant. The results indicated that RRM2 is one of miR-17-5p’s target genes.
Figure 3. The results of dual-luciferase reporter gene experiment, the expression of RRM2 after transfection of miR-17-5p mimics and inhibitor and growth & clone formation of treated by siRRM2.
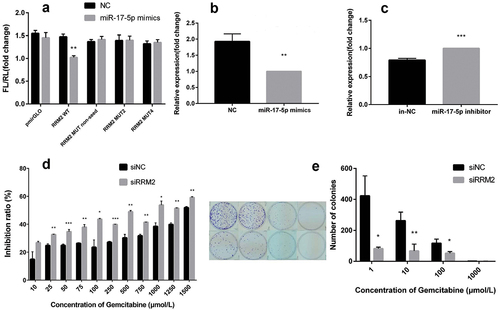
In the meantime, the mRNA expression level of RRM2 was detected by qPCR. The results displayed that the expression level of RRM2 was reduced or increased in the miR-17-5p mimics group or inhibitor group compared with the respective control groups (P < 0.01, P < 0.001, ). The above results showed that miR-17-5p negatively regulates the RRM2 gene at the mRNA level.
Interference with RRM2 gene expression can increase the sensitivity of A549/G+ cells to gemcitabine
The restorative assay was used to verify further that RRM2 is one of miR-17-5p’s target genes. CCK8 experiments hinted that at the same concentration, the cell survival rate was lower in the siRRM2 experimental group than in siNC group (P < 0.05, ). IC50 of the siRRM2 experimental group was lower than one of the siNC group (772 μmol/L vs. 4362 μmol/L, P < 0.001). The cell clone formation experiment found that the number of cell clonal plaques formed was significantly more in the siNC group than in the siRRM2 experimental group ().
All this suggested that interference with RRM2 gene expression can reduce the tolerance of drug-resistant A549/G+ cells to gemcitabine, reduce the clone formation ability of A549/G+ cells, and weaken the proliferation ability of A549/G+ cells, which accords with the previous results of miR-17-5p’s overexpression.
A. The results of dual-luciferase reporter gene experiment; B. The expression changes of RRM2 after transfection of miR-17-5p mimics; C. The expression changes of RRM2 after miR-17-5p inhibitor transfection; D. The inhibition rate of gemcitabine at each concentration on the experimental group (siRRM2) and the control group (siNC); E. The changes in clone formation after transfection siRRM2.
Interfering with RRM2 gene expression may affect the cell cycle
After transfecting RRM2 siRNA, we observed the changes of the cell cycle in A549/G+ cells. These results displayed that the number of cells in the G1 phase of the cell cycle increased in the experimental group compared with the control group, while the number of cells in the S phase decreased (). This indicated that inhibition of RRM2 expression can block cells from G1 to S phase.
Figure 4. The cell cycle changes, the protein changes of RRM2, and cell cycle relative protein.
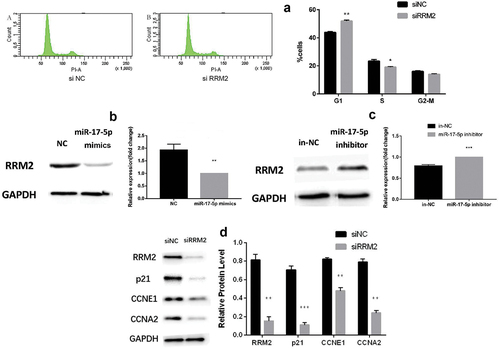
Western blot experiments demonstrated that the expression level of RRM2 in the miR-17-5p mimics or inhibitor experimental group was significantly reduced (P < 0.001, ) or increased (P < 0.001, ) compared with the control group. The above results suggested that miR-17-5p negatively regulates the target gene RRM2 at the protein level.
Then cell cycle protein expression was observed to determine whether it is affected when RRM2 interferes. The results showed that siRRM2 could reduce the RRM2 protein level significantly, and the expression levels of P21, CCNE1, and CCNA2 protein were all reduced (P < 0.01, ). These results accord with the results of overexpression of miR-17-5p. This indicated that RRM2, as a miR-17-5p’s target gene, takes part in the drug resistance process in A549/G+ cells. P21, CCNE1, and CCNA2 are most likely to be RRM2 downstream genes.
A. The cell cycle changes treated by siRRM2; B. The changes of RRM2 protein expression treated by miR-17-5p mimics; C. The changes of RRM2 protein expression treated by miR-17-5p inhibitor; D. The protein expression changes of RRM2, P21, CCNE1, and CCNA2 treated by siRRM2.
PI3K/AKT pathway activation caused by P-PTEN reduction leads to drug resistance in A549 cells
Western blotting was used to measure protein expression levels in A549/G+ cells and A549/G- cells. These results displayed that the PTEN and PI3K protein expression levels in the A549/G+ group were higher and the P-PTEN protein expression level was lower compared with the A549/G- group (P < 0.05, ). This demonstrated that the drug resistance of A549/G+ cells is not related to the total PTEN protein but is related to the decrease of activated PTEN protein – p-PTEN.
Figure 5. The protein expression difference PTEN, p-PTEN, and PI3K under different conditions.
The protein expressions of related proteins PTEN, P-PTEN, PI3K, and P-AKT (Ser) (AKT protein phosphorylated at serine site) were measured. The results showed that the protein expression level of p-PTEN increased or reduced significantly in the miR-17-5p mimics or inhibitor experimental group, while p-AKT (Ser) decreased (P < 0.01, ) or significantly increased (P < 0.01, ). However, there has been no change in the protein expression levels of PI3K and PTEN ().
Similarly, to observe whether the change in RRM2 expression affects the expression of these proteins. The results displayed that the protein expression of p-PTEN was increased (P < 0.001, ) in the siRRM2 experimental group, while the expression level of PI3K, PTEN, and p-AKT (Ser) proteins was unchanged (). Combined with the results before, it further showed that the drug-resistance of A549/G+ cells is associated with p-PTEN and it can be speculated that the expression of the p-PTEN protein may increase when RRM2 expression is inhibited, thereby reducing the resistance of A549 cells to gemcitabine, increasing the sensitivity of A549 cells to one. The above results indicated that there may be a PI3K/AKT resistance pathway activated by a decrease of p-PTEN in A549/G+ cells, and this pathway is regulated by miR-17-5p and its target gene RRM2.
A. The protein expression difference PTEN, p-PTEN, and PI3K in A549/G- group and A549/G+ group; B. The changes of protein expression PI3K, PTEN, p-PTEN, and p-AKT (Ser) after transfection miR-17-5p mimics; C. The changes of protein expression PI3K, PTEN, p-PTEN, and p-AKT (Ser) after transfection miR-17-5p inhibitor; D. The changes of protein expression PI3K, PTEN, p-PTEN, and p-AKT (Ser) after transfection siRRM2.
Discussion
Here we demonstrated that miR-17-5p is expressed at lower levels in A549G+ cells than in A549G- cells. We confirmed that RRM2 is one of the target genes of miR-17-5p by dual-luciferase reporter assay and RT-qPCR.
CCK-8 assay and clone formation survival experiment showed that overexpression of miR-17-5p or down-regulated of RRM2 gene expression in A549/G+ cells, the cell survival rate, IC50, and clone formation ability were all decreased. And the cells became sensitive to gemcitabine. On the other hand, with overexpression of RRM2 or down-regulated miR-17-5p in A549/G-cells, the opposite results emerged in the cell survival rate, IC50, and clone formation ability. These suggest that the tolerance of A549 to gemcitabine is related to miR-17-5p/RRM2 pathway.
Coincidentally, Lu et al. [Citation15] studies suggest that inhibiting the expression of RRM2 combined with gemcitabine could significantly reduce the drug resistance of drug-resistant pancreatic cancer cell-line Mia-PaCa2-Gem. It coincides with our results. Similarly, Mah et al. [Citation16] used tissue microarray analysis to conclude that RRM2 is a very useful disease-specific predictor, which can predict the survival outcome of different subtypes of non-small cell lung cancer. High levels of RRM2 expression were associated with poor survival outcomes. These are the same as the previous result “RRM2 highly expressed, and cells become drug-resistant.”
Similar studies by Grolmusz et al. [Citation17] found gemcitabine can strongly inhibit the proliferation of ACC and increase their apoptosis. However, after a period of treatment, RRM2 was up-regulated, resulting in cell resistance to gemcitabine, which was consistent with the clinical therapeutic effect of ACC. These also show that the high expression of RRM2 can make cells develop drug resistance. In addition, some studies [Citation18,Citation19] found that the expression level of RRM2 was much higher in tumor tissues than in normal tissues in patients with lung adenocarcinoma. The overexpression of RRM2 could boost A549 cell proliferation. On the contrary, inhibiting the expression of RRM2 could also inhibit A549 cell proliferation. These are consistent with our results.
The flow cytometry results showed that overexpression of miR-17-5p or low-expression of RRM2 in drug-resistant cells A549/G+, the number of G1 phase cells rose, and the number of the S phase cells declined. Instead, when interfering with the expression of miR-17-5p or overexpressing RRM2 in sensitive cells A549/G-, the number of the G1 phase cells dropped, and the number of the S phase cells went up. Based on the previous results, under the same miR-17-5p (or RRM2) expression conditions, when the number of the G1 phase increased, the cells turned into sensitive. When the number of the G1 stage decreased, the corresponding cells became resistant. These suggest that the tolerance of A549 to gemcitabine is related to the cell cycle.
Then, we selected the G1/S-related proteins CCNE1, CCNA2, and P21 for Western blotting detection. These results presented that expression levels of CCNE1, CCNA2, and P21 were down-regulated at overexpression of miR-17-5p in drug-resistant A549/G+, and they increased when miR-17-5p is inhibited in sensitive cells A549/G-. At the same time, CCNE1, CCNA2, and P21 down-regulated at the low-expression RRM2 in drug-resistance cells A549/G+, just as with miR-17-5p overexpression. These indicate that the tolerance of A549 to gemcitabine is related to cell cycle-related proteins CCNE1, CCNA2, and P21.
CCNE1 appears in the late stage of the G1 phase, and cytokines and some tumors could increase the expression of CCNE1. CCNE1 can promote the G1/S phase transition, shorten the G1 phase, and reduce the cell requirement for growth factors [Citation20,Citation21]. The cycling-CDK2 complex is a crucial kinase for cells to get into the S phase from the G1 phase [Citation20,Citation22,Citation23]. It could phosphorylate its substrates such as retinoblastoma protein (Rb), Rb family members P107, CDC6, etc. CCNA2 is mainly expressed in the S phase and mediates the initiation of the S phase [Citation20,Citation24,Citation25] and is a crucial cell cycle regulator and essential for DNA synthesis and G1/S transition [Citation26,Citation27]. Therefore, when the expression level of miR-17-5p increases (or low expression of RRM2), when the expression level of CCNE1 decreases, it is difficult for cells to complete G1/S transformation, resulting in cell arrest in the G1 phase, cell proliferation is blocked, and cells become sensitive to gemcitabine. Zhang [Citation28] et al. also had similar results in the study of cisplatin resistance in gastric cancer. However, when the expression level of miR-17-5p (or RRM2) is opposite, the cells become resistant to gemcitabine.
Then we detected the expression level of PI3K/AKT signaling pathway protein. First, Western blotting suggested that PTEN and PI3K expressed a higher level in A549/G+ cells than in A549/G- cells, but the level of p-PTEN (phosphorylated PTEN) was lower. These show that the activated PTEN (p-PTEN) is at a low level and has a weak inhibitory effect on AKT in the A549/G+ cells. AKT isCA Cancer J Clin activated and can activate downstream signal molecules and play its physiological function, including cell growth, survival, proliferation, etc. All these help tumor cells survive better under drug pressure and show drug resistance [Citation29,Citation30].
Secondly, PI3K and PTEN levels did not change, but p-PTEN levels increased, and p-AKT (phosphorylated AKT) levels decreased at overexpression of miR-17-5p in A549/G+ cells. After inhibition of miR-17-5p in A549/G- cells, the levels of PI3K and PTEN remained unchanged. The level of p-PTEN decreased, and the level of p-AKT increased. This suggested that the miR-17-5p expression level was consistent with one of p-PTEN but opposite to that of p-AKT. However, it had no change in the expression level of PI3K and PTEN. That is to say that miR-17-5p could positively regulate p-PTEN, while p-PTEN negatively regulates p-AKT. After the overexpression of miR-17-5p in A549/G+ cells, the level of p-PTEN increased and inhibited the level of p-AKT, thus inhibiting the downstream signal pathway function of AKT, inhibiting the drug resistance of cells, and finally, the cells became sensitive. Otherwise, by knocking down the expression of miR-17-5p, the level of p-PTEN also decreases and weakens the effect of p-AKT in A549/G- cells. p-AKT can start the function of the downstream signal pathway and promote the resistance of cells to drugs [Citation30,Citation31]. We can reproduce almost all the previous experimental results when we use RRM2 instead of miR-17-5p for the restorative experiment. These indicate that miR-17-5p/RRM2 is involved in the PI3K/AKT signaling pathway and regulates the cell response to drugs by regulating PI3K/AKT pathway.
Interestingly, inhibition of RRM2 expression did not reduce phosphorylated AKT (Ser) protein as overexpression of miR-17-5p did. It only adds P-PTEN. However, inhibition of RRM2 expression also reduced drug resistance in A549/G+ cells. Therefore, we believe that the contribution of miR-17-5p to the resistance of A549/G+ cells may have two aspects. The first is by regulating the cell cycle, mainly by miR-17-5p’s regulating RRM2, thereby reducing the expression of CCNE and CCNA proteins. The second is through the PI3K/AKT pathway. The primary indicator is decreasing AKT (Ser) expression. The results of Liao et al. demonstrated that phosphorylation of AKT in Ser473 (p-Ser473-Akt) is necessary for complete AKT functional activity [Citation32]. As a target gene of miR-17-5p, RRM2 may not directly participate in regulating AKT (Ser) but play an auxiliary role in regulating the PI3K/AKT pathway by miR-17-5p, thereby affecting drug resistance. Shah et al. [Citation33] also reported similar results. Similarly, Xu et al. [Citation34] found that miR-421 could promote the proliferation, migration, and invasion of NSLC cells by inhibiting PTEN and affecting PI3K/Akt signaling pathway. It also indicated that knockdown of RRM2 expression in AKT-induced tamoxifen-resistant breast cancer cells could inhibit the proliferation of these breast cancer cells under tamoxifen. That is, reduction of RRM2 expression can reverse AKT-induced tamoxifen resistance. These indicated that AKT-induced breast cancer cell tamoxifen is closely related to RRM2. The RRM2 and PI3K/AKT pathways may play a key role in but are not limited to lung cancer drug resistance.
Conclusions
In brief, the present study found that RRM2 is one target gene of miR-17-5p in A549 cells. It demonstrated that miR-17-5/RRM2 changed the cell cycle and cell tolerance to gemcitabine by affecting the expression level of CCNE1, CCNA2, and P21. This change is related to altering the p-PTEN expression level through miR-17-5/RRM2, which affects PI3K/AKT signal pathway and finally affects various effects downstream of AKT. We can change the drug resistance of A549 cells to gemcitabine by changing the expression level of miR-17-5p/RRM2, which provides an experimental basis and points out the research direction for overcoming the drug resistance of lung cancer. However, whether the miR-17-5/RRM2 axis and the PI3K/AKT signaling pathway affect the cell cycle involving the MAPK/Ras signaling pathway needs to be experimentally verified.
Author’s contribution
Conception and design: Ai-Ling Liang, Mu-Yi Zhong, and Yong-Jun Liu; Collection and assembly of data: Xuan Ma, Tian Fu, Zhi-Yin Ke, Shen-Lin Du, Xue-Chun Wang, Ning Zhou; Data analysis and interpretation: Xuan Ma, Tian Fu, Ai-Ling Liang, and Yong-Jun Liu; Manuscript writing: Xuan Ma, Tian Fu; All authors read and approved the final manuscript.
Disclosure statement
No potential conflict of interest was reported by the authors.
Data availability statement
We confirm that the data supporting the findings of this study are available within the supplementary materials.
Additional information
Funding
References
- Sung H, Ferlay J, Siegel RL, et al. Global Cancer Statistics 2020: GLOBOCAN Estimates of Incidence and Mortality Worldwide for 36 Cancers in 185 Countries. CA Cancer J Clin. 2021;71:209–249.
- Osmani L, Askin F, Gabrielson E, et al. Current WHO guidelines and the critical role of immunohistochemical markers in the subclassification of non-small cell lung carcinoma (NSCLC): moving from targeted therapy to immunotherapy. Semin Cancer Biol. 2018 Oct;52(Pt 1):103–109.
- Fang C-L, Guo L-L. Research situation of miRnas in regulating chemotherapy resistance of lung cancer. Chin J Cancer Prev Treat. 2014;21(01):72–76.
- Siegel RL, Miller KD, Fuchs HE. Cancer Statistics, 2021. CA Cancer J Clin. 2021;71(1):7–33.
- Shi W-C, Liu X-M. Research progress on the drug resistance mechanism of gemcitabine in the treatment of non-small cell lung cancer. Chin J Lung Diseases (electronic Edition). 2013;6(6):557–559.
- Liu Q, Yu S, Zhao W, et al. EGFR-TKIs resistance via EGFR-independent signaling pathways. Mol Cancer. 2018 Feb 19;17(1):53.
- Wanigasooriya K, Tyler R, Barros-Silva JD, et al. Radiosensitising cancer using phosphatidylinositol-3-Kinase (PI3K), Protein Kinase B (AKT) or mammalian target of rapamycin (mTOR) Inhibitors. Cancers (Basel). 2020 May 18;12(5). DOI:10.3390/cancers12051278
- Sastry SK, Elferink LA. Checks and balances: interplay of RTKs and PTPs in cancer progression. Biochem Pharmacol. 2011 Sep 1;82(5):435–440.
- Burris HA. 3rd. Overcoming acquired resistance to anticancer therapy: focus on the PI3K/AKT/mTOR pathway. Cancer Chemother Pharmacol. 2013 Apr;71(4):829–842.
- Liang AL, Du SL, Zhang B, et al. Screening miRnas associated with resistance gemcitabine from exosomes in A549 lung cancer cells. Cancer Manag Res. 2019;11:6311–6321.
- Li L, He L, Zhao JL, et al. MiR-17-5p up-regulates YES1 to modulate the cell cycle progression and apoptosis in ovarian cancer cell lines. J Cell Biochem. 2015 Jun;116(6):1050–1059.
- Dhar S, Kumar A, Rimando AM, et al. Resveratrol and pterostilbene epigenetically restore PTEN expression by targeting oncomiRs of the miR-17 family in prostate cancer. Oncotarget. 2015;6(29):27214–27226.
- Gong A-Y, Eischeid AN, Xiao J, et al. MiR-17-5p targets the p300/CBP-associated factor and modulates androgen receptor transcriptional activity in cultured prostate cancer cells. BMC Cancer. 2012;12:492.
- Meng L-J, Wang J, Fan W-F, et al. Effects of miR-17-5P on the proliferation and invasion of lung cancer cell lines A549, SPCA-1 and GLC-82. Chin J Surg Oncol. 2015;7(05):282–286.
- Lu H, Lu S, Yang D, et al. MiR-20a-5p regulates gemcitabine chemosensitivity by targeting RRM2 in pancreatic cancer cells and serves as a predictor for gemcitabine-based chemotherapy. Biosci Rep. 2019 May 31;39(5). DOI:10.1042/BSR20181374
- Mah V, Alavi M, Márquez-Garbán DC, et al. Ribonucleotide reductase subunit M2 predicts survival in subgroups of patients with non-small cell lung carcinoma: effects of gender and smoking status. PLoS ONE. 2015;10(5):e0127600.
- Grolmusz VK, Karászi K, Micsik T, et al. Cell cycle dependent RRM2 may serve as proliferation marker and pharmaceutical target in adrenocortical cancer. Am J Cancer Res. 2016;6(9):2041–2053.
- Jin CY, Du L, Nuerlan AH, et al. High expression of RRM2 as an independent predictive factor of poor prognosis in patients with lung adenocarcinoma. Aging. 2020 Dec 19;13(3):3518–3535.
- Zhao Y, Zheng Y, Zhu Y, et al. M1 macrophage-derived exosomes loaded with gemcitabine and deferasirox against chemoresistant pancreatic cancer. Pharmaceutics. 2021 Sep 17;13(9). DOI:10.3390/pharmaceutics13091493
- Fagundes R, Teixeira LK. Cyclin E/CDK2: dNA replication, replication stress and genomic instability. Front Cell Dev Biol. 2021;9:774845.
- Chu C, Geng Y, Zhou Y, et al. Cyclin E in normal physiology and disease states. Trends Cell Biol. 2021 Sep;31(9):732–746.
- Suski JM, Braun M, Strmiska V, et al. Targeting cell-cycle machinery in cancer. Cancer Cell. 2021 Jun 14;39(6):759–778.
- Tadesse S, Anshabo AT, Portman N, et al. Targeting CDK2 in cancer: challenges and opportunities for therapy. Drug Discov Today. 2020 Feb;25(2):406–413.
- Loukil A, Cheung CT, Bendris N, et al. Cyclin A2: at the crossroads of cell cycle and cell invasion. World J Biol Chem. 2015 Nov 26;6(4):346–350.
- Li J, Chen Y, Wang X, et al. CDCA2 triggers in vivo and in vitro proliferation of hepatocellular carcinoma by activating the AKT/CCND1 signaling. J Buon. 2021 May-Jun;26(3):882–888.
- Malumbres M, Barbacid M. Mammalian cyclin-dependent kinases. Trends Biochem Sci. 2005 Nov;30(11):630–641.
- Kikuchi K, Kaida D. CCNE1 and E2F1 partially suppress G1 phase arrest caused by spliceostatin a treatment. Int J Mol Sci. 2021 Oct 27;22(21):11622–11632.
- Zhang C, Zhu Q, Gu J, et al. Down-regulation of CCNE1 expression suppresses cell proliferation and sensitizes gastric carcinoma cells to Cisplatin. Biosci Rep. 2019 Jun 28;39(6). DOI:10.1042/BSR20190381
- Zhou JS, Yang ZS, Cheng SY, et al. MiRNA-425-5p enhances lung cancer growth via the PTEN/PI3K/AKT signaling axis. BMC Pulm Med. 2020 Aug 24;20(1):223–229.
- Manning BD, Toker A. AKT/PKB signaling: navigating the network. Cell. 2017 Apr 20;169(3):381–405.
- Fresno Vara JA, Casado E, de Castro J, et al. PI3K/Akt signalling pathway and cancer. Cancer Treat Rev. 2004 Apr;30(2):193–204.
- Liao Y, Hung MC. Physiological regulation of Akt activity and stability. Am J Transl Res. 2010 Jan 1;2(1):19–42.
- Shah KN, Mehta KR, Peterson D, et al. AKT-induced tamoxifen resistance is overturned by RRM2 inhibition. Mol Cancer Res. 2014 Mar;12(3):394–407.
- Xu YJ, Wei RS, Li XH, et al. MiR-421 promotes lipid metabolism by targeting PTEN via activating PI3K/AKT/mTOR pathway in non-small cell lung cancer. Epigenomics. 2022 Jan 20;14:121–138.